Change timeframe of the current chart with a script doesn't work
I had the same problem here which was solved by angevoyageur: https://forum.mql4.com/66327#1004959
But I have no idea how to change the timeframe of the current chart by a script and I need that now.
I had the same problem here which was solved by angevoyageur: https://forum.mql4.com/66327#1004959
But I have no idea how to change the timeframe of the current chart by a script and I need that now.
You don't need a script.
- Download your history on each timeframe. It's mandatory to have needed data for the following points to work (of course).
- On D1 chart, unset Autoscroll, you will have a little cursor on the leftmost bottom corner of the chart.
- Drag and drop this cursor (tooltip is "Fixed chart position") to the rightmost corner (or any other position you want).
- Draw your line at the same position as the "Fixed chart position".
- Switch to W1 or any other timeframe and your line will be always in the same place (provided you have history data).
Maybe, you can to that by script, I didn't try. But anyway, you need a workaround as if you change the symbol/period the script will be removed from the chart. I will let you imagine a solution ![]()
angevoyageur, that's awesome! Thank you!! I didn't know about that feature.
I finished the script but I am not 100% pleased yet. I hide the very right of the chart because for me it is much pleasanter when the chart doesn't end at the very right of the window. For example if you go to your chosen date on the daily it works fine. If your switch to the weekly then it also works perfect. But when you go back to the daily the chart is not in the correct place anymore. It's not such a big deal but I would like to know why. The lower timeframes work great if history is loaded.
The last thing I don't know how to fix is that on the very right side you can see a bit of a bar. Do you see any chance to hide this? I tried everything but without success.
Like I said, only two small issues and it also works really fine for me if they can't be fixed. It would just make it 100%. :)
Here is my code:
//+------------------------------------------------------------------+
//|                                       [Script]VisualBacktest.mq4 |
//|                           Copyright 2015, Marcus Riemenschneider |
//|                   http://www.facebook.com/riemenschneider.marcus |
//+------------------------------------------------------------------+
#property copyright "Copyright 2015, Marcus Riemenschneider"
#property link      "http://www.facebook.com/riemenschneider.marcus"
#property version   "1.00"
#property strict
#property show_inputs

extern datetime   date        = D'2014.05.30';

//+------------------------------------------------------------------+
//| Script program start function                                    |
//+------------------------------------------------------------------+
void OnStart()
  {
//---
   ObjectsDeleteAll();
   color Background  = (color)ChartGetInteger(0, CHART_COLOR_BACKGROUND, 0);
   for(int x = 0; x < 25; x++) {
      for(int y = 0; y < 60; y++) {
         string ObjName = "Label" + (string)x + "_" + (string)y;
         ObjectCreate(ObjName, OBJ_LABEL, 0, 0, 0, 0, 0);
         ObjectSet(ObjName, OBJPROP_CORNER, 3);
         ObjectSet(ObjName, OBJPROP_XDISTANCE, x*10);
         ObjectSet(ObjName, OBJPROP_YDISTANCE, y*10);
         ObjectSetText(ObjName, CharToStr(110), 20, "Wingdings", Background);
      }
   }
   ChartSetInteger(0, CHART_AUTOSCROLL, false);
   ChartSetDouble(0, CHART_FIXED_POSITION, 82.9);
   ChartNavigate(0, CHART_END, -iBarShift(NULL, 0, date)-1);
   ObjectCreate(0, "DATELINE" + (string)date, OBJ_VLINE, 0, date, 0);
  }
//+------------------------------------------------------------------+
I tested a lot of charts today and there is one problem with hiding the right part of the chart. When you scroll the chart forward bar by bar it often happens that the scale changes and because of that you know that the hidden chart is going up or down and that influences the exercise. So I think the only possible solution is to start at the very right border even if it is not very nice to see no space to the right. But that's the only way not to be influenced by a changing scale and watch the chart like it's printed the real way.
PS. But using no space to the right makes the current bar very hard to read because Metatrader shows only half of the bar. Really bad... Obviously visual backtests are not really possible. Even if I just hide 2-3 bars on the right side (then the scale doesn't change that much if a strong move occurs), there is still the problem that the very right bar can't be hidden. Whatever I try with the label objects I can't hide this very right bar.
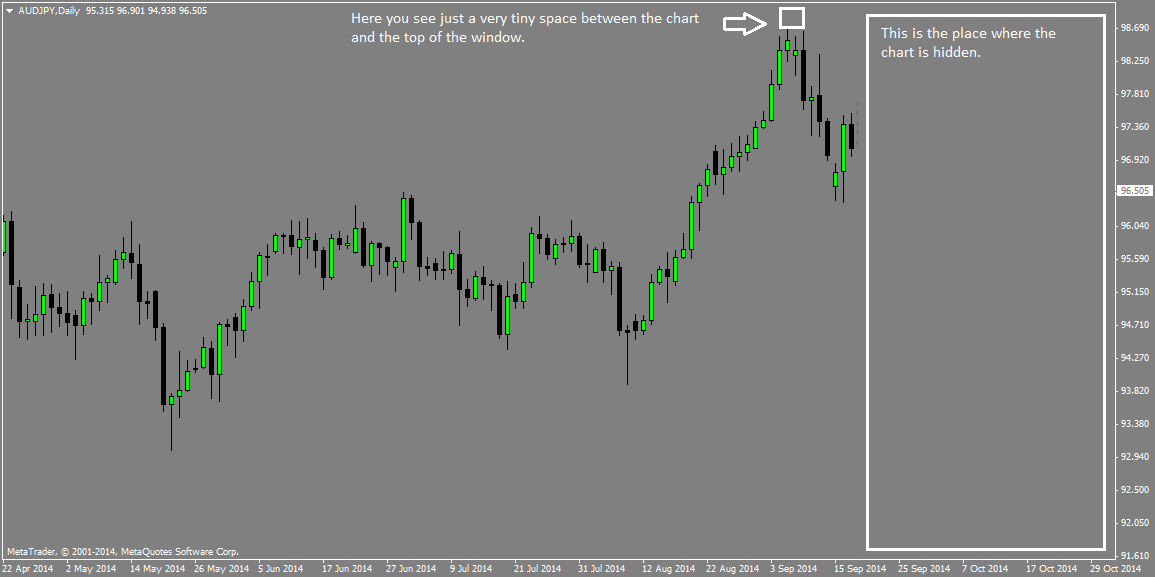
I attached three charts to demonstrate the problem. If the right part of the chart is hidden it may be that in this hidden part a sudden up- or downmove takes place. You don't see it (because it is still hidden) but you see the scale on the y-axis compresses. And this is what makes an objective analysis impossible. If I go through the charts to learn I absolutely don't want to know what happens next. And the change of the y-axis makes that impossible.
I changed the script in a way that there is just a very tiny part of the right chart is hidden. Just 2 or 3 bars. That avoids this huge change of the y-axis because very seldom there is a dramatic move within two bars. But then I still have the problem that the very current bar is displayed because the label objects can't be painted until the very right border.
Do you see any other chance to hide 2-3 bars on the right side?
Here are the screenshots showing the problem with the y-axis:
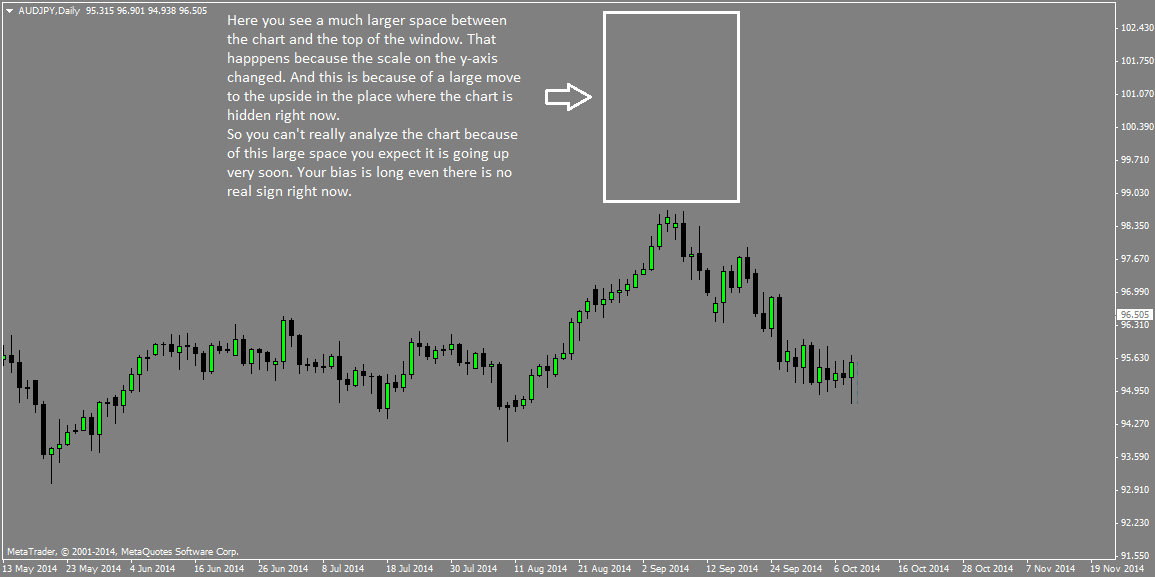
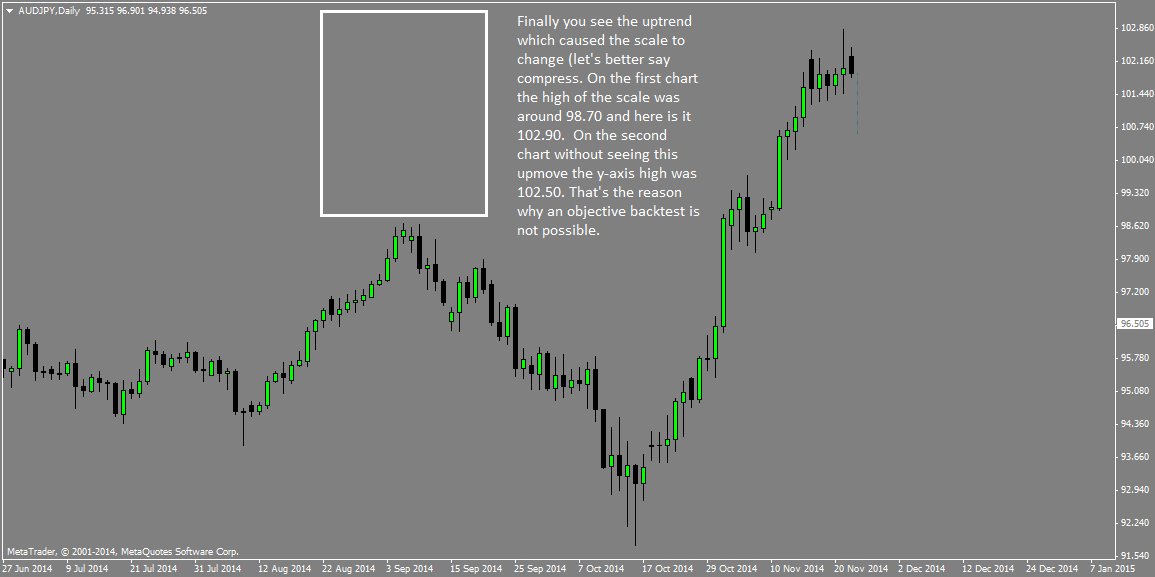
Yes, that's a good idea. But then I have to make an expert advisor because I have to change the fixed scale or at least check if the scale is still ok when a new bar opens. I will do that.
Unfortunately, there is one small question left: is there any chance to hide the bar at the right border? With my label objects there are a few pixels on the right which can't be hidden and so I could see that bar. If there is no possibility, it's not the biggest problem. But it would be nice to do the expert advisor 100%.
- The space on the right hand side is controlled by the button and slider.
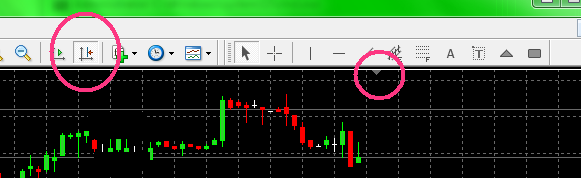
- The vertical space is created when you dragged the price bar down. It stays that way until price move outside the window and it goes back to auto-scaling. Drag the bar back up to go back to auto-scaling.
- I doubt that there are any bars hidden.
- Free trading apps
- Over 8,000 signals for copying
- Economic news for exploring financial markets
You agree to website policy and terms of use
Hi,
just a few word about my idea:
I want to visually backtest support and resist zones. To do that I have to go back in time and plot them. Then I scroll forward bar by bar until a line is hit. Then I decide what to do and scroll further. Just a simple exercise to learn about price action. Ok, now there is one problem. Let's say I want to start looking at the 2010.10.11. Then I swtich to the D1, scroll back until this date is the first bar to the right and plot my lines. But I also want to plot lines on the weekly. And when I switch to the weekly the 2010.10.11 is somewhere in the middle of the chart and I can see everything what happens after this date. And this is exactly what I want to avoid. I don't want to see anything after the 2010.10.11 because if I know that it is no exercise anymore.
Here you can see what I mean:
The first is the daily and here I would plot my daily lines and simulate trading from the date I chose. But switching to the weekly to plot the lines there makes it obsolete. So I also want the 2010.10.11 be on the very right side of the weekly.
This is the script I made but I get a error message which has to do with ChartSetSymbolPeriod():
Thanks for help!