Does anyone have MovingAverage code (all 4 calcMethods) that uses bar data *otherThan* TimeSeries data ?
Excuse the rather laboured post but is hard for me to explain unless the ramble factor is at max :-)
No kidding, and you didn't even ask a question.
- You said you have the 4 ma in Moving Averages.mq4. They all work the same, processing Open[Bars], High[Bars], Low[Bars], Close[Bars].
So YOU create your tick arrays O[tBars], H[tBars], L[tBars], C[tBars] and have the routines work on them. Incorporate the code inside your EA.
- Alternately, search offline charts (range bars) convert that to tick charts, then all indicators run on the offline chart.
Well I did say it was hard for me :)
.
Nevertheless, thought I did strongly imply if not specifically ask, since "..I cannot achieve for EMA/LWMA.." was for me an invite to others to help me achieve better for these two calcMethods.
So, ok: The question is why does it take 100's of lookback bars and hence loop iterations to get same results as iMA() for EMA and LWMA ?
I even supplied possibilities as to why I cannot - to hopefully encourage all you clever people (which this site has plenty of :) to ponder a bit.
ie, the published algorithms would have one believe is not needed to have such large lookback window as I have found I need.
.
Additionally, maybe some maths oriented type would just say - sure... that's probably ok because to get same as iMA() for these two methods one needs a largish lookback window
OR indeed they may say: Here's the way iMA() actually works.
OR maybe with this source you can determine what you do differently to iMA()
OR who knows?
.
Your kind answer may well prove of interest given enough time for me to digest (I'm slow on the uptake you see...) and then see how it may map onto my current setup.
I was not asking for 'how' to process tickBars - that's done and dusted, takes few functions to implement and works for any tickBar size and/or Bar Queue/array.
Unless of course your suggestion could, for me, prove to be a path to follow which gives even better performance etc. One can always, generally speaking, improve on what is used - at the moment. Also, suggestions force one to think in areas not walked and hence expand in many areas, yes?
.
Cheers
EDIT
Getting data from offline charts to me implies continuity of incoming ticks at all times. I'd guess one could run tick logger in background, assuming no break in logging. That could work as the EA could either take over logging or even just poll file. I'm after single .ex4 system and anyway, 'continuity of tick data' could prove problematical.
Also, running on offline chart needs EA to have while(1) body [with some suitable sleep/refresh], as Terminal not call start(). init() can call, which I do on weekends and use the while(1) paradigm.
Not really my cup of tea, tbh...
- So, ok: The question is why does it take 100's of lookback bars and hence loop iterations to get same results as iMA() for EMA and LWMA ?Because YOUR code is broken, and you didn't show it. No mind readers here. SMA(x) and LWMA(x) requires x bars. EMA(x) requires 3.45*x
- I'd guess one could run tick logger in background, assuming no break in logging. That could work as the EA could either take over logging or even just poll fileNo polling needed. The writer processes incoming ticks (when they happen) and updates the offline bar chart, and tells the offline chart to refresh. The EA/indicators simply run when they get a new tick. go search range bar offline charts. The EA/indicators don't need to change, you can put them on a time chart or a range bar chart or a tick chart with no modifications.
No need search - I have and run on platform startup, all code which produce offline tick charts. The 3.45 factor is interesting.
I'll not trouble you further...
Cheers
Your EMA is getting thrown out of wack for hundreds of bars because your not giving it something to start with.
EMA actually only requires 1 lookback bar
7 Period EMA: EMA[i] = 0.25 * Pos(i) + 0.75 * EMA[i + 1];
(0.25 is the exponent for a 7 period EMA)
Obviously when the EMA tries to make its first calculation on the first bar there is no EMA[i+1] for it to work on so yours is probably using an empty array index which will create a wildly innacurate first EMA calculation.
As each new EMA calculation uses the previous one, that first error is getting carried forward through every subsequent EMA calculation until after a few hundred bars it is gradually diminished enough that is is not noticable.
What you need to do is give the first EMA calculation something to work on, the usual way is to start the EMA 1 bar forward of the beginning of the chart and use the close price of the very first bar of the chart as a substitute EMA result, so in the first calculation of the EMA, EMA[i+1] = Close[i+1]
If you are applying the EMA to your own array you just start the EMA one array index forward of the first one with a value in it and let it use whatever value is in the first one for EMA[i+1]
If you look at the code in the included moving averages you can see they do that like this:
if(pos==Bars-2) ExtMapBuffer[pos+1]=Close[pos+1];
If you do the same your EMA will be identical to the one generated by iMA() from the beginning of the chart.
- Alpha = 2.0/(len+1) so a 7 period has alpha of 0.25
- You should never compute ema that way, it amplifies round off errors. instead use the simplier: EMA[i] = Ema[i+1] + alpha * (Pos(i) - EMA[i+1] )
That was just an example of an ema to show why the first bar error results from EMA[i + 1]
I didnt intend it to be an example of how to most efficiently code an EMA but I am interested to know what you mean by rounding off errors, what kind of error is it and how is it caused ?
I made an indicator to detect any differences between EMA calculated as in the mt4 moving average, EMA calculated as you said and EMA calculated as I did in my earlier post all drawn at 21 periods.
while(i>=0)
     {if(i==Bars-2)
        {ema_mt4[i+1] = Close[i+1];
         ema_sdc[i+1] = Close[i+1];
         ema_whr[i+1] = Close[i+1];
        }
      ema_mt4[i] = Pos(i) * exp + ema_mt4[i+1] * (1-exp);
      ema_sdc[i] = exp * Pos(i) + (1-exp) * ema_sdc[i+1];
      ema_whr[i] = ema_whr[i+1] + exp * (Pos(i) - ema_whr[i+1]);
      err += ema_mt4[i] - ema_sdc[i];
      err += ema_mt4[i] - ema_whr[i];
      err += ema_whr[i] - ema_sdc[i];
      error[i]=err;
      i--;
     }
It accumulates any differences found between any of the three methods of calculating an EMA and draws it as an error line, I ran it on my one minute chart over 50,000 bars and there is no such error so all three methods of calculating an EMA give identical results.
Here is the resulting chart all three lines appear as one as they are placed exactly on top of each other.
First Bars In Chart

Last Bars In Chart
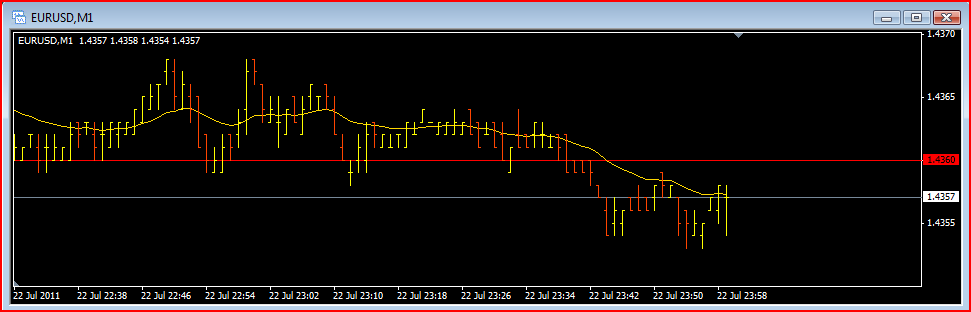
After nearly 50,000 bars there were no discrepencies between any of the EMA's so error line ramains at zero

I didnt intend it to be an example of how to most efficiently code an EMA but I am interested to know what you mean by rounding off errors, what kind of error is it and how is it caused ?
| INT(9/10*A2)+1/10*110 | B2+INT(110-B2)/10 |
|---|---|
| 100 | 100 |
| 101.00 | 101.00 |
| 101.00 | 101.90 |
| 101.00 | 102.70 |
| 101.00 | 103.40 |
| 101.00 | 104.00 |
| 101.00 | 104.60 |
| 101.00 | 105.10 |
| 101.00 | 105.50 |
| 101.00 | 105.90 |
| 101.00 | 106.30 |
| 101.00 | 106.60 |
| 101.00 | 106.90 |
| 101.00 | 107.20 |
| 101.00 | 107.40 |
| 101.00 | 107.60 |
| 101.00 | 107.80 |
| 101.00 | 108.00 |
| 101.00 | 108.10 |
- Free trading apps
- Over 8,000 signals for copying
- Economic news for exploring financial markets
You agree to website policy and terms of use
Let me clarify - I have system that uses <anySize>Tick sized TickBars supported by circular Q management environment etc,etc, to include all required emulations of 'normal' MT/builtins that work with TimeSeries arrays. Basically it all functions (as expected) asif EA running off of TimeSeries Bars (it can use for faster forwards testing, TimeSeries instead of TickBars controlled by a bool).
Use of TickBars are many - the concept of fixed time mapped onto random fx transactions is what finally pushed me to only use TickBars since they occur whenever they feel like it... Anyways, that's probably a contentious area ;)
.
Recently took codebase "Moving Averages.mq4" indicator that supports SMA,EMA,SMMA,LWMA calcMethods (just like iMA() does) and proceeded to convert into using published algorithms (in 1st instance/for testing against MT/builtIn comparison convience using TimeSeries) leading to using same algorithms used by codebase implementation.
No arrays/indicator buffers etc. and only calculating left->right/'down to' [iShift], the Bar which a caller has requested the MA for. For ease, TimeSeries Close[] Bar datums used.
By way of contrast, as expected, the indicator code always goes down to [0]. I'd assume that iMA() only goes down to [iShift] but unless see source that's a guess...!
Guess can be proved if eg, iShift = Bars-1 or so and then call with a MAperiod of say 100. Presume "ERR_HISTORY_WILL_UPDATED (4066)" would be generated. This is side issue methinks.
.
Two of the four calcMethods were 100% spot on when cmp'd with iMA() and only requiring iShift+iMAperiod historical Bar datums. These two were the SMA and LWMA (the 'almost' noBrainer ones)
The other two calcMethods, EMA and SMMA were found to need many hundreds of historical Bar datums to achieve acceptable 'difference' values (for any requested [iShift] and/or calc method etc.) between my code and MT/builtin iMA() .
.
Seems that the one thing of greatest difference is the indicator code has it's 'indicator buffer' which holds previous calculations and will be referenced during it's calculations.(*)
.
(*)However, even the indicator on first entry will have to commence leftmost Bar calculations without having an indicator buffer stuffed with 'previous calcs' which the algorithm can reference...
iow, on first call: the indicator code must bootstrap self up effectively using the same algorithms that are well known/published all over the place. Additionally, it would be good that it's leftMost or first Bar MA calculation were spot on. ie, no settling time needed. You know? like when apply an MA to chart, one would not expect that the leftMost Bars were kinda 'getting closer' to a true MA calculation!
.
That's exactly what I cannot achieve for EMA/LWMA unless eg, for an EMA calc, my 'same calc' as used in the codebase indicator has many 100's (in some instances) iterations/historical Bars prior to returning the EMA/LWMA for [iShift]. Actually, if use other published algorithms (for whatever reason) they can take longer to reach near equality with iMA()...
.
The test harness is simple enough, just call my code and compare full double result with iMA() result to give the Difference datum. That's the rub, if start with the minimum required historical Bars needed by the algorithm and incrementally bumping up how many historical Bars/'lookback' are used, the code will eventually reach tolerable or even zero difference in MA calc result compared to iMA()
.
What I really need (dream on...) is the MT Moving Average BUILTIN code so that can understand just what it does that could be different from the published algorithms (even those in codebase example).
.
OR... perhaps many interations/historical Bars are needed to achieve same outcome as iMA() since it too may need a largish 'lookback' window of Bars...
I somehow doubt this to be the case but I'm not a maths sort of person and although my algorithms are faithfully encoded/replicated it is a sense of frustration that cannot achieve the same as iMA() does for EMA and LWMA calcMethods unless I pump up the 'lookback' window size.
.
I appreciate that this is of academic interest for most since TimeSeries is what's on offer and it can be generally assumed that there is sufficient quantity of history... But using TickBars requires a startup period during which the TickBar Queue is built and that can vary enormously depending on TickBar size. Is easy enough to use tester even tho the tick data could be described as far from real. At least the EA functionality can be tested fast compared to live data where EA must firstly build it's TickBar Q.
.
Excuse the rather laboured post but is hard for me to explain unless the ramble factor is at max :-)