Indicators: AdaptiveRenko_HTF
Forum on trading, automated trading systems and testing trading strategies
newdigital, 2013.09.03 11:03
Renko (extraction from Achelis - Technical Analysis from A to Z)
============
Overview
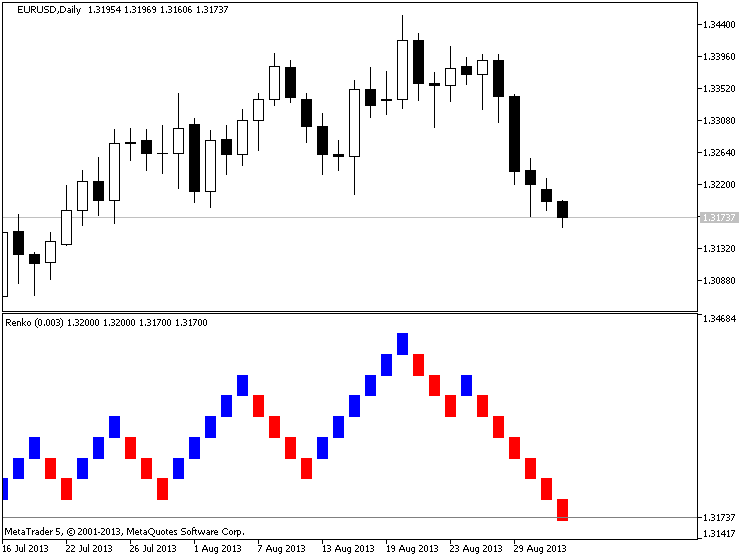
The Renko charting method is thought to have acquired its name from "renga" which is the Japanese word for bricks. Renko charts are similar to Three Line Break charts except that in a Renko chart, a line (or "brick" as they're called) is drawn in the direction of the prior move only if prices move by a minimum amount (i.e., the box size). The bricks are always equal in size. For example, in a 5-unit Renko chart, a 20-point rally is displayed as four, 5-unit tall Renko bricks.
Kagi charts were first brought to the United States by Steven Nison when he published the book, Beyond Candlesticks.
Interpretation
Basic trend reversals are signaled with the emergence of a new white or black brick. A new white brick indicates the beginning of a new up-trend. A new black brick indicates the beginning of a new down-trend. Since the Renko chart is a trend following technique, there are times when Renko charts produce whipsaws, giving signals near the end of short-lived trends. However, the expectation with a trend following technique is that it allows you to ride the major portion of significant trends.
Since a Renko chart isolates the underlying price trend by filtering out the minor price changes, Renko charts can also be very helpful when determining support and resistance levels.
Calculation
Renko charts are always based on closing prices. You specify a "box size" which determines the minimum price change to display.
To draw Renko bricks, today's close is compared with the high and low of the previous brick (white or black):
-
If the closing price rises above the top of the previous brick by at least the box size, one or more white bricks are drawn in new columns. The height of the bricks is always equal to the box size.
-
If the closing price falls below the bottom of the previous brick by at least the box size, one or more black bricks are drawn in new columns. Again, the height of the bricks is always equal to the box size.
If prices move more than the box size, but not enough to create two bricks, only one brick is drawn. For example, in a two-unit Renko chart, if the prices move from 100 to 103, only one white brick is drawn from 100 to 102. The rest of the move, from 102 to 103, is not shown on the Renko chart.
Forum on trading, automated trading systems and testing trading strategies
newdigital, 2013.10.16 08:04
How to Use Renko Bricks and Moving Averages to Find Trades
Talking Points
- Renko bars help filter the noise
- Renko bars reveal clearer entries and exits
- Moving Averages can be used with Renko bars with some minor setting changes to pinpoint entries
Seeing the trend without Forex market noise is the goal of every trader. Too many times, traders get head-faked by the twists and turns of price action.
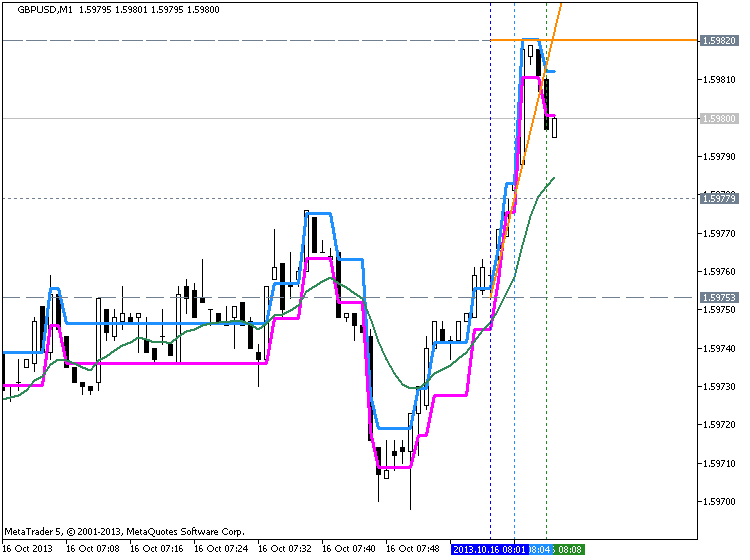
In addition moving averages can be used to signal entries and exits as well. A couple of settings have to be changed in order to get the moving averages which are usually tied to time, to work with a chart system that is based on price.
To add a 13-period exponential moving average to the Renko chart, choose EMA from the Add Indicator menu then change “Number of periods” to 13.
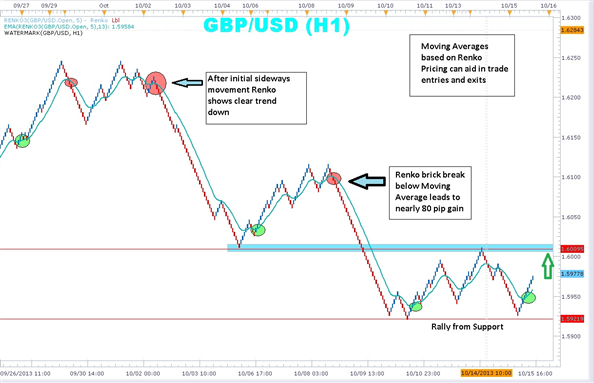
Notice the chart above which displays both Renko bars and a 13-period exponential moving average. A simple system can be built around the Renko bars and the moving average. When Renko price bars cross below the moving average and turns red, traders can enter short and stay with the trend until the Renko bars cross back above the moving average.
An initial stop could be placed just above the last blue Renko brick. Keep in mind that in the above example, each brick is equal to five pips. In the above example, the red circles mark where the Renko bars crossed below the moving average. A trader can see that a number of pips could have been gathered as the bars stayed below the moving average.
On the other hand, when the Renko bars change color and cross above the moving average, traders can enter long placing stop just below the last red Renko brick. The above chart shows in the green circles, points were the Renko price bars moved above the moving average generating a clear buy signal.
Renko charts, without the dimension of time, may take a little getting a little used to. But once you get the hang of them, you may find it difficult to go back to the candles. Adding a moving average gives excellent signals for entry and exit. Marrying them up with other indicators can magnify the benefits of trading without noise and scary wicks!
- Free trading apps
- Over 8,000 signals for copying
- Economic news for exploring financial markets
You agree to website policy and terms of use
AdaptiveRenko_HTF:
Author: Nikolay Kositsin