Indicators: LineBreakOnChart
Trading Trends with Renko Charts
Talking Points
- Renko harts filter out the noise of wicks and are based solely on price without time.
- Renko charts clearly indicate support and resistance.
- Can be used to confirm trends or can be traded on their own.
Have you ever been stopped out of trade only to have it move in the direction you originally thought?
Do you have trouble recognizing trend direction?
If you answered “Yes” to either one of these questions, then you may want to give Renko charts a try.
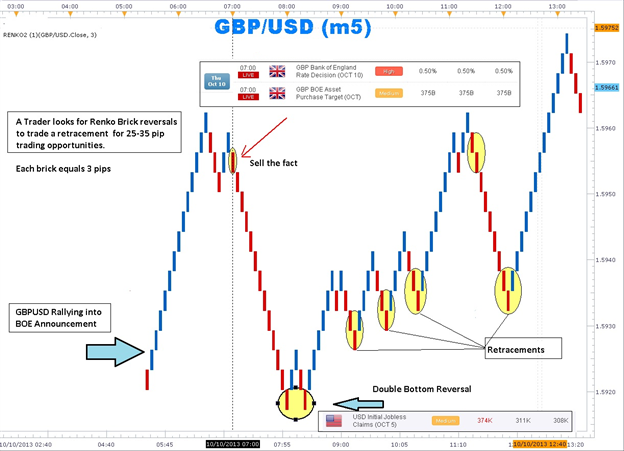
Renko means brick in Japanese. Every brick is the same size and a new brick is drawn one brick size below or above the brick before it. Bricks that are adjacent never overlap. Every brick starts where the previous brick ends. Traders can specify the size of bricks in pips. In the example above, the distance from the high and low of the brick is three pips. So a ten brick move is equal to 30 pips (10 bricks times 3-pip height brick).
Price can move above and below the previous brick until the minimum number of brick is met. This may be a surprise for most traders who are used to a new candle being formed at a specific time. We can see 13 bricks in a row heading up going into the Bank of England rate decision. Once the decision is released the bricks changed in color from blue to red and there was a lower high leading to a 13 brick decline.
A double bottom that happened when the US Initial Jobless Claims was released ended the selling and the uptrend resumed on the weaker US data. The negative sentiment for GBPUSD following the Bank of England interest rate announcement could be easily seen with streak of red bricks.
How to Trade Using Renko
A simple system could be used in which if we have 2 bricks of the same color establishes a trend that we could use as a trigger to either get long or short. On the other hand, a 1 brick of the opposite color ends the trend and we would exit the trade.
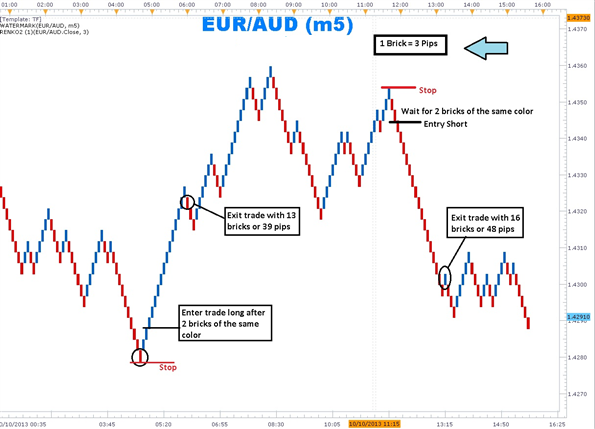
Buy filtering out time and whipsaws, Renko charts were able to map out market sentiment within small time frames like the 5-minute chart which usually have a lot of noise. However, Renko has its drawbacks. When a line of bricks goes into a range changing color after 2 or 3 bricks, traders can get whipsawed by price action.
It is easier to stand aside and wait for Renko bricks to move from the congestion channel and begin trending again. This can be clearly seen at the end of the EUR/AUD chart as the line of bricks breaks out to a new low clearing past the previous congestion area.
In sum, it is easy to see that Renko charts can provide forex traders with a new and fresh way to approach price action. Being based on price action rather than time, traders can stay with trends longer and exit with confidence with clear signals.
Forum on trading, automated trading systems and testing trading strategies
Expert Advisors: Renko Line Break vs RSI EA
newdigital, 2014.03.28 07:39
The 3 Step EMA and Renko Strategy for Trading Trends (based on dailyfx article)- Many Forex traders use weighted moving averages, called EMA’s, to trade currency pairs that are trending.
- Determine the direction of the dominant trend direction with a 200 period EMA.
- Use price crossing a 13 period MA as both an entry trigger and manual trailing stop
Developed in the 18th century in Japan to trade rice, Renko charting is a trend following technique. It is excellent for filtering out price “noise” so traders can catch a major part a given Forex trend. It was believed that the name “Renko” originated from the Japanese word ‘renga’ meaning ‘brick’.
Similar to Kagi and Point and Figure charting, Renko ignores the element of time used on candlesticks, bar charts, and line charts. Instead, Renko focuses on sustained price movement of a preset amount of pips.
For example, a trader can set the bricks for as little as 5 pips or as many as 100 or more. A new brick will not be formed until price has moved 100 pips. It could take 24 hours for a new brick to form or it could take just a few hours. However, no bricks will form until the preset limit is achieved.
Find the Trend Direction
Renko charts can incorporate many of the usual technical indicators like stochastics, MACD, and moving averages. Today’s strategy will marry up Forex Renko charts with a 200 Exponential Moving Average (EMA) to find trend direction. Very simply, if price is trading above its 200 EMA, then the trend is up. If price is trading below its 200 EMA, then the trend is down.
This filter will give us a directional bias much like a compass or GPS. We will look to only take long trades when the Renko bricks are trending above the 200 EMA. On the other hand, in a downtrend, if the Renko bricks are trending below the 200 EMA, then the trend down. Forex traders will only look to short the market. One of the biggest mistakes swing traders make is entering trades that go counter to the dominant trend.
When to Get In
After the dominant trend direction is determined, traders can use the simplicity of Renko charts with a single 13 period EMA as a ‘trigger’ to signal an entry in the direction of the major trend. First, wait for at least two green bricks to appear above the 13 EMA. Then enter long on the appearance of the second green brick above the 13 EMA.
Exiting for Profit and for Loss
Once a trader is “triggered” into the trade, a protective stop can be set one-brick size below the 13 EMA. As long as the bricks remain above the 13 EMA, we look to stay with the trend. Just as the 13 EMA can get you in a new trade, the same EMA can be used to stop out a winning trade locking in profits.
Traders will need to manually move the stop one brick-size below 13 EMA and the current price brick. You can see in the example above how the combination of Renko and the 13 EMA helps traders stay with the trend a longer time.
- Free trading apps
- Over 8,000 signals for copying
- Economic news for exploring financial markets
You agree to website policy and terms of use
LineBreakOnChart:
The indicator of (three) linear reversal on the main chart
Author: Serhii Ivanenko