USDJPY Technical Analysis 04.08 - 11.08 : Ranging
Price came to below kumo (Ichimoku cloud) which is indicating the primary bearish market condition for H4 timeframe :
MetaTrader Trading Platform Screenshots
MetaQuotes Software Corp., MetaTrader 5, Demo
usdjpy h4 below kumo

H1 timeframe: the price is already below kumo with flat market condition for now :
MetaTrader Trading Platform Screenshots
MetaQuotes Software Corp., MetaTrader 5, Demo
USDJPY H1 below kumo with flat

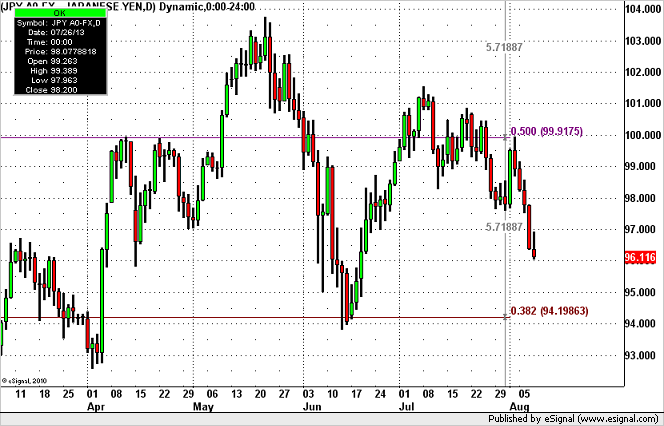
As to D1 timeframe so the situation is really interesting: Chinkou Span line of Ichimoku indicator is trying to cross historical price but on open bar for now sorry. Seems - we need to wait for 1 or 2 days to be fully sure about sell trades to open. But anyway - the price will come to Ichimoku cloud at the first (and as we know - if the price is inside Ichimoku cloud so it is "signal" for ranging market condition) :
MetaTrader Trading Platform Screenshots
MetaQuotes Software Corp., MetaTrader 5, Demo
USDJPY D1 breakdown started on open bar


newdigital, 2013.08.05 16:46
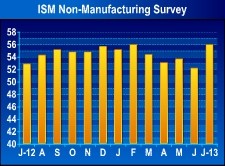
2013-08-05 14:00 GMT (or 16:00 MQ MT5 time) | [USD - ISM Non-Manufacturing PMI]
- past data is 52.2
- forecast data is 53.0
- actual data is 56.0 according to the latest press release
If actual > forecast = good for currency (for USD in our case)
==========
U.S. Service Sector Expands At Faster Than Expected Rate In July :
Activity in the U.S. service sector grew at a faster rate in the month of July, according to a report released by the Institute for Supply Management on Monday, with the index of activity in the sector rising by much more than economists had anticipated.
The ISM said its non-manufacturing index jumped to 56.0 in July from 52.2 in June, with a reading above 50 indicating growth in the service sector. Economists had been expecting the index to show a more modest increase to a reading of 53.0.
With the bigger than expected increase, the non-manufacturing index rose to its highest level since a matching reading in February.
"According to the NMI, 16 non-manufacturing industries reported growth in July," said Anthony Nieves, chair of the ISM Non-Manufacturing Business Survey Committee. "Respondents' comments are mostly positive about business conditions and the overall economy."
The improvement by the headline index was partly due to a notable increase by the business activity index, which surged up to 60.4 in July from 51.7 in June.
The new orders index also showed a substantial increase for the month, climbing to 57.7 in July from 50.8 in the previous month.
The report also showed that the prices index jumped to 60.1 in July from 52.5 in June, indicating that prices increased at a significantly faster rate.
Meanwhile, the employment index dipped to 53.2 in July from 54.7 in June, suggesting a modest slowdown in the pace of job growth in the service sector.
Last Thursday, the ISM released a separate report showing that its index of activity in the manufacturing sector jumped to a two-year high in July.
The ISM said its purchasing managers index surged up 55.4 in July from 50.9 in June, with a reading above 50 indicating growth in manufacturing activity. Economists had expected the index to climb to a reading of 53.1.
With the much bigger than expected increase, the ISM's manufacturing index rose to its highest level since reaching 55.8 in June of 2011.
James Knightley, senior economist at ING, said, "Taking the two ISM series together it paints a relatively upbeat growth picture, but we remain concerned over a lack of agreement on the fiscal situation."
"This has the potential to drag on and given what happened in 2011 we suspect that the Fed will err on the side of caution rather than go headlong into a September taper whatever happens," he added.
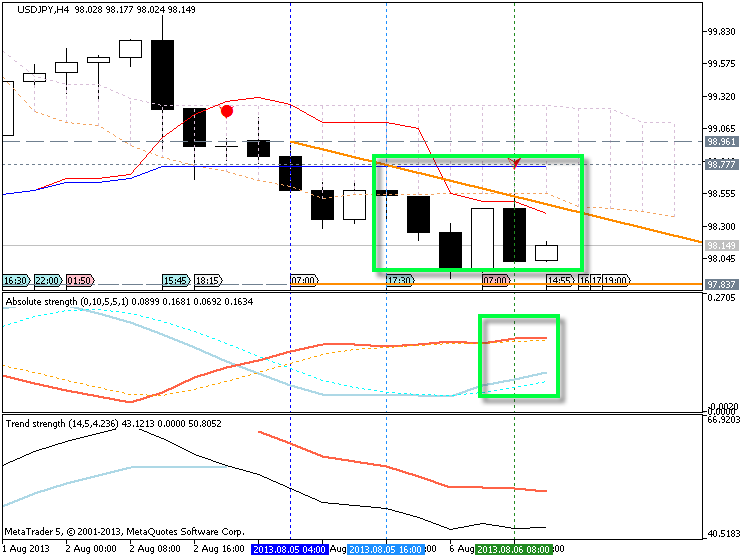
Yes, this is ranging market condition on H4 - see the images :
MetaTrader Trading Platform Screenshots
MetaQuotes Software Corp., MetaTrader 5, Demo
usdjpy h4 ranging

Just something about RSI indicator related to USDJPY :
MetaTrader Trading Platform Screenshots
MetaQuotes Software Corp., MetaTrader 5, Demo
enter exit trend following

Indicators: Relative Strength Index (RSI)
newdigital, 2013.08.07 12:55
RSI Indicator Forex Trading StrategyRelative Strength Index or RSI is the most popular indicator used in Forex trading. It is an oscillator indicator which oscillates between 0 -100. The RSI is a trend following indicator. It indicates the strength of the trend, values above 50 indicate a bullish trend while values below 50 indicate bearish Forex trend.
The RSI measures momentum of a currency.
The centerline for the RSI is 50,crossover of the centerline indicate shifts from bullish to bearish and vice versa.
Above 50, the buyers have greater momentum than the sellers and price of a currency will keep going up as long as RSI stays above 50.
Below 50, the sellers have greater momentum than the
buyers and price of a currency will keep going downwards as long as RSI
stays below 50.
In the example above, when the RSI is below 50, the price kept moving in a downward trend. The price continues to move down as long as RSI was below 50. When the RSI moved above 50 it showed that the momentum had changed from sell to buy and that the downtrend had ended.
When the RSI moved to above 50 the price started to move upwards and the trend changed from bearish to bullish. The price continued to move upwards and the RSI remained above 50 afterwards.
From the example above, when the trend was bullish sometimes the RSI would turn downwards but it would not go below 50, this shows that these temporary moves are just retracements because during all these time the price trend was generally upwards. As long as RSI does not move to below 50 the trend remains intact. This is the reason the 50 mark is used to demarcate the signal between bullish and bearish.
The RSI uses 14 day period as the default RSI period, this is the period recommended by J Welles Wilders when he introduced the RSI. Other common periods used by forex trader is the 9 and 25 day moving average.
The RSI period used depends on the time frame you are
using, if you are using day time frame the RSI 14 will represent 14
days, while if you use 1 hour the RSI 14 will represent 14 hours. For
our example we shall use 14 day moving average, but for your trading
you can substitute the day period with the time frame you are trading.
- The number of days that a currency is up is compared to the number of days that the currency is down in a given time period.
- The numerator in the basic formula is an average of all the sessions that finished with an upward price change.
- The denominator is an average of all the down closes for that period.
- The average for the down days are calculated as absolute numbers.
- The Initial RS is then turned into an oscillator.
Center-line: The center-line for RSI is 50. A value above 50 implies that a currency is in a bullish phase as average gains are greater than average losses. Values below 50 indicate a bearish phase.
Overbought and Oversold Levels:Wilder set the levels at which currencies are overextended at 70 and 30
Just about BoJ Interest Rate - even unchanged interest rate can produce such a price movement: 13 pips to one side and 23 pips to the other side :

newdigital, 2013.08.08 08:38
2013-08-08 03:00 GMT (or 16:00 MQ MT5 time) | [JPY - BoJ Interest Rate]
- past data is 0.1%
- forecast data is 0.1%
- actual data is 0.1% according to the latest press release
==========
Bank Of Japan Keeps Stimulus Program Unchanged
Japan's central bank announced on Thursday its decision to keep its monetary easing program unchanged, as the economy has begun to recover moderately and inflation data has turned positive.
It was breakdown for D1 but I missed this movement sorry
MetaTrader Trading Platform Screenshots
MetaQuotes Software Corp., MetaTrader 5, Demo
usdjpy d1 breakdown


newdigital, 2013.08.08 15:57
2013-08-08 12:30 GMT (or 14:30 MQ MT5 time) | [USD - Jobless Claims (Initial Claims)]
- past data is 328K
- forecast data is 336K
- actual data is 333K according to the latest press release
If actual < forecast = good for currency (for USD in our case)
==========
U.S. Weekly Jobless Claims Edge Up To 333,000, Below Estimate :
First-time claims for U.S. unemployment benefits showed a modest increase in the week ended August 3rd, according to a report released by the Labor Department on Thursday, although claims still came in below economist estimates.
The report showed that initial jobless claims edged up to 333,000, an increase of 5,000 from the previous week's revised figure of 328,000.
Economists had expected jobless claims to climb to 336,000 from the 326,000 originally reported for the previous week.
MetaTrader Trading Platform Screenshots
MetaQuotes Software Corp., MetaTrader 5, Demo
usdjpy bearish finished?

newdigital, 2013.08.09 06:52
A Runaway USD/JPY Move Few Would Expect :
Guest Commentary: How Far Will USD/JPY Fall?
"From a fundamental perspective, the reasons for buying USDJPY, including Fed tapering and BoJ easing, remain intact, but at this stage, we would prefer to wait for the currency pair to stabilize and start to turn higher before buying."
Kathy Lien of BK Asset Management
So, this is what we are finally having for this pair for now.
D1 timeframe: primary bearish.

H4 timeframe - bearish with secondary flat :

- Free trading apps
- Over 8,000 signals for copying
- Economic news for exploring financial markets
You agree to website policy and terms of use
Chinkou Span line of Ichimoku is very near to the porice trying to cross it from above to below for good downtrend. But the price is above the cloud and in case of downtrend - the price will come to inside the cloud for ranging market condition. But if the price will continue with bullish so it will have to break few very strong resistance lines on the way to uptrend : 99.57 and 100.45. So, the direction of this pair will be fully based on fundamental news events for this week.
UPCOMING EVENTS (high/medium impacted news events which may be affected on USDJPY price movement for the next week)
2013-08-05 05:00 GMT | [JPY - Bank of Japan Monthly Economic Survey]
2013-08-05 14:00 GMT | [USD - ISM Non-Manufacturing PMI]
2013-08-06 05:00 GMT | [JPY - Leading Economic Index]
2013-08-06 12:30 GMT | [USD - Trade Balance]
2013-08-06 17:00 GMT | [USD - FOMC Member Speaks]
2013-08-07 23:50 GMT | [JPY - Current Account]
2013-08-08 03:00 GMT | [JPY - BoJ Interest Rate]
2013-08-08 05:00 GMT | [JPY - Eco Watchers Survey]
2013-08-08 23:50 GMT | [JPY - Tertiary Industry Index]
2013-08-09 01:30 GMT | [CNY - Consumer Price Index]
2013-08-09 05:00 GMT | [JPY - Consumer Confidence Index]
2013-08-09 05:30 GMT | [CNY - Industrial Production]
SUMMARY : ranging
TREND : depends on fundamental news events
Intraday Chart