Indicators: Relative Strength Index (RSI)
Hey
Im curious if you know how one could put a OVERLAY of a moving average on to this indicator
Thanks,
- Atonnie
- www.tradeforextrading.com
Something Interesting in Financial Video November 2013
newdigital, 2013.11.14 07:48
Pretty cool way to use the RSI. How to trade using RSI Trading Strategy
=========
Identify the Trend
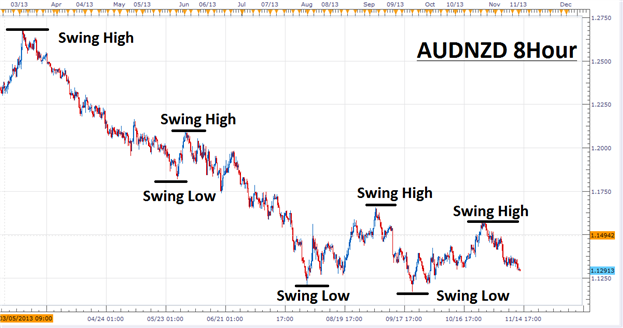
The first step to trading any successful trend based strategy is to find the trend! One of easiest ways to find the trend is through identifying a charts swing highs and swing lows. Traders can work from left to right on their graph and identify the outliers in price. If you see the peaks and valleys of price declining consistently, you are looking at a downtrend. If highs and lows are advancing, traders would consider a currency pair to be trending upward.
Given this information, traders should look to sell the AUDNZD as long as price continues to decline towards lower lows. If the trend continues, expectations are that price will decline allowing traders to look for new areas to sell the market.
RSI for Entry
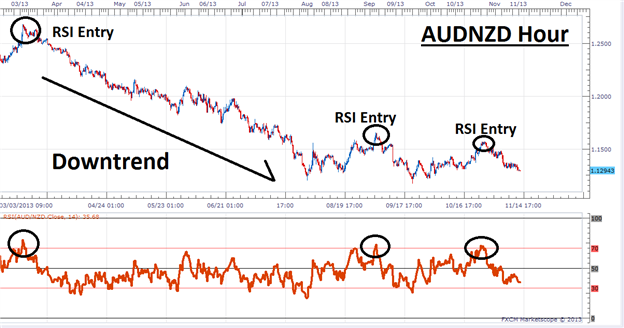
Once a strong trend is established, traders will look to join that trend with a technical market trigger. Oscillators are a family of indicators that are designed specifically to determine if momentum is returning to an existing trend. Below we can again see the AUDNZD 8 Hour chart, but this time the RSI (Relative Strength Index) indicator has been added. Since we have identified the AUDNZD as being in a downtrend, traders will look to sell the pair when the RSI indicator crosses back below a value of 70 (overbought). This will signal momentum returning lower after the creation of a new swing high.
Below you will find several previous examples of RSI entries signaled on the AUDNZD. Remember since the trend is down, only new sell positions should be initiated. At no point should a buy position be considered as price declines.
Manage Risk
Every good strategy needs a risk management component. When trading strong trends such as the AUDNZD, it is important to realize that they will eventually come to an end! Traders have a variety of choices when it comes to stop placement, but one of the easiest methods is to use a previous swing high on the chart. In the event that price breaks towards higher highs, traders will wish to exit any existing sell biased positions and look for new opportunities elsewhere.
Wether you are trading live money or just practicing on a demo it is also recomended to review your trades. This way you can track your progress while making sure you adhere to the strategy rules!
=========
- Free trading apps
- Over 8,000 signals for copying
- Economic news for exploring financial markets
You agree to website policy and terms of use
Relative Strength Index (RSI):
The Relative Strength Index technical indicator (RSI) is a price-following oscillator that ranges between 0 and 100. When Wilder introduced the Relative Strength Index, he recommended using a 14-day RSI.. Since then, the 9-day and 25-day Relative Strength Index indicators have also gained popularity.
A popular method of analyzing the RSI is to look for a divergence in which the security is making a new high, but the RSI is failing to surpass its previous high. This divergence is an indication of an impending reversal. When the Relative Strength Index then turns down and falls below its most recent trough, it is said to have completed a "failure swing". The failure swing is considered a confirmation of the impending reversal.
Ways to use Relative Strength Index for chart analysis:
Author: MetaQuotes Software Corp.