> I understand that ALWAYS the close of a candle should be the open of the follower
No! Why would you think that?
Maybe it used to be 'tidier' in the days of Forex brokers as market makers (i.e. dealing desk) but as we are generally connected more directly to the real market, there will be more gaps
-BB-
BarrowBoy:
> I understand that ALWAYS the close of a candle should be the open of the follower
No! Why would you think that?
Maybe it used to be 'tidier' in the days of Forex brokers as market makers (i.e. dealing desk) but as we are generally connected more directly to the real market, there will be more gaps
-BB-
I am sorry, but I don't see any logic on what you say. I mean, programmaticaly, the terminal receives DATA and the program (MQL4) organize it to show in the graphics. My terminal DOES NOT receive CANLDES, just DATA and the programm should organize the Data in order to show periods.
- Free trading apps
- Over 8,000 signals for copying
- Economic news for exploring financial markets
You agree to website policy and terms of use
I always had a question about Candlesticks and since I got answers in this forum, I am going to ask it here:
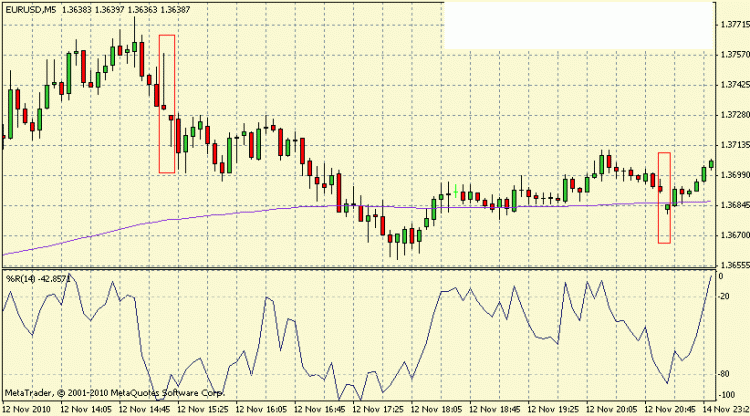
I understand that ALWAYS the close of a candle should be the open of the follower. But this NOT ALWAYS seems to be in the graphics. See the graphics I have:
Look in the RED RECTANGLES. Is this an error? Is this NORMAL? What does it means??