Intersection coordinates
I am new to MQL4 and have just created my first custom indicator - at the moment it is a grid indicator, however, I would like to add trend lines to it. What I would like to do if possible is to detect the intersection points of the vertical and horizontal lines. Then, pass the values to a trend line object in order to create the object. Is this possible, and if so, is anybody willing to teach me how or point me in the right direction?
Also, I have noticed that trend lines drawn on one time frame move on other time frames - I assume that this is caused by the variable scales and the fact that a time reference on one time frame wont necessarily exist in the data of another...is there anyway to avoid this?
Would really appreciate any help on these questions.
Thanks in advance
More digging around in the book leads me to believe that I will need to use the objectGet function to collect the coordinates and then use those for the trend line object. Am I correct?
....anybody.....
hi, i am not shure if i get your problem.
but if you have drawn your v/hlines you already have all variables you need.
point 1 of the trendline should be (vline1_time1,hline_upper_Price)
point 2 of the trendline should be (vline2_time1,hline_lower_Price)
the best is to store the variables you use inte the indicator buffers so that you can easily get them from outside the indicator.
if you don't store them in variables your clue to get the values with the objectGet function is correct. but for that you have to know the name of the lines.
i personally don't like the objectGet function so whereever possible i store my values in the buffers.
but maybe if you post your code we can help you a bit more
Thank you zzuegg for responding to my request for help - I can't access the computer with my code for a few hours so I will have to post it up later.
Hi zzueg,
I checked my code again and noticed that I had made a couple of errors - I am attaching the test code that I used anyway, just in case you have any comments on the way that I have written it - good or bad! Open to any improvements in the way that I am doing things....
Here is an image to show the result
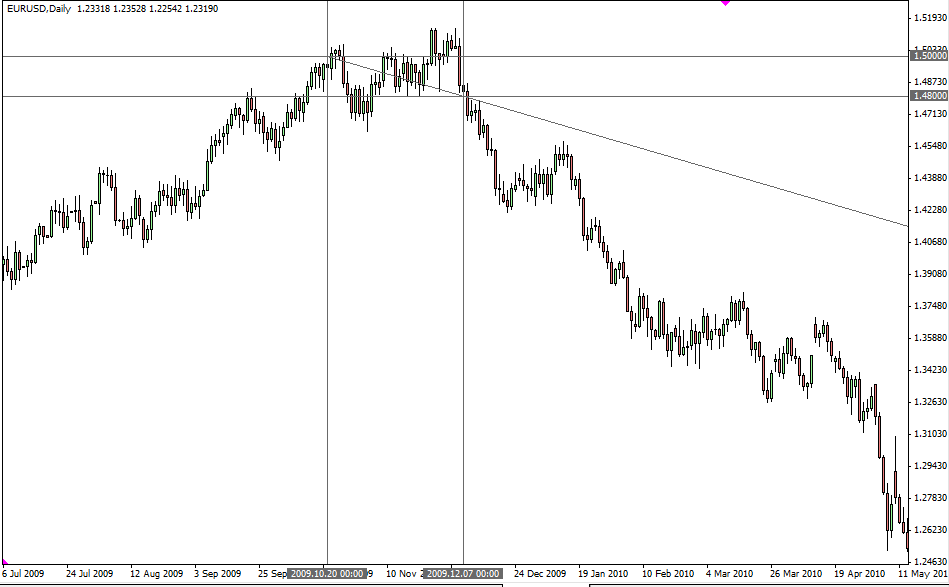
//+------------------------------------------------------------------+
//|                                                  Test coords.mq4 |
//|                      Copyright © 2010, MetaQuotes Software Corp. |
//|                                        http://www.metaquotes.net |
//+------------------------------------------------------------------+
#property copyright "Copyright © 2010, MetaQuotes Software Corp."
#property link      "http://www.metaquotes.net"

#property indicator_chart_window
//---- input parameters
extern double    base_price;
extern color     Base_price_colour=DimGray;

datetime t1;
double p1;
datetime t2;
double p2;

double low_price;
int Font_size;

//+------------------------------------------------------------------+
//| Custom indicator initialization function                         |
//+------------------------------------------------------------------+
int init()
  {
//---- indicators
    low_price = base_price - 0.02;
    Font_size = 12;


//DRAW THE BASELINE LEVEL
    ObjectCreate("Baseline",OBJ_HLINE,0,0,base_price);
    ObjectSet("Baseline",OBJPROP_COLOR,Base_price_colour);
    ObjectSet("Baseline",OBJPROP_WIDTH,1);
    ObjectSetText("Baseline","BASELINE"+ "   " +DoubleToStr(base_price,Digits),Font_size,"TAHOMA",0);
//DRAW THE low LEVEL
    ObjectCreate("lowline",OBJ_HLINE,0,0,low_price);
    ObjectSet("lowline",OBJPROP_COLOR,Base_price_colour);
    ObjectSet("lowline",OBJPROP_WIDTH,1);
    ObjectSetText("lowline","lowline"+ "   " +DoubleToStr(low_price,Digits),Font_size,"TAHOMA",0);
//DRAW THE START LINE
    ObjectCreate("STARTline",OBJ_VLINE,0,D'2009.10.20 00:00',0);
    ObjectSet("STARTline",OBJPROP_COLOR,Base_price_colour);
    ObjectSet("STARTline",OBJPROP_WIDTH,1);
    ObjectSetText("STARTline","STARTline",Font_size,"TAHOMA",0);

//DRAW THE END LINE
    ObjectCreate("ENDline",OBJ_VLINE,0,D'2009.12.07 00:00',0);
    ObjectSet("ENDline",OBJPROP_COLOR,Base_price_colour);
    ObjectSet("ENDline",OBJPROP_WIDTH,1);
    ObjectSetText("ENDlinee","ENDline",Font_size,"TAHOMA",0);

      t1 = ObjectGet("STARTline",OBJPROP_TIME1);
      p1 = ObjectGet("Baseline",OBJPROP_PRICE1);
      t2 = ObjectGet("ENDline",OBJPROP_TIME1);
      p2 = ObjectGet("lowline",OBJPROP_PRICE1);
Alert(p1);
//DRAW THE TREND
    ObjectCreate("TRENDline",OBJ_TREND,0,t1,p1,t2,p2);
    ObjectSet("TRENDline",OBJPROP_COLOR,Base_price_colour);
    ObjectSet("TRENDline",OBJPROP_WIDTH,1);
    ObjectSetText("TRENDline","TRENDline",Font_size,"TAHOMA",0);//setting the displayed name


//----
   return(0);
  }
//+------------------------------------------------------------------+
//| Custom indicator deinitialization function                       |
//+------------------------------------------------------------------+
int deinit()
  {
      ObjectDelete("Baseline");
      ObjectDelete("lowline");
      ObjectDelete("STARTline");
      ObjectDelete("ENDline");
      ObjectDelete("TRENDline");

//----
   return(0);
  }
//+------------------------------------------------------------------+
//| Custom indicator iteration function                              |
//+------------------------------------------------------------------+
int start()
  {
   int    counted_bars=IndicatorCounted();
//----

//----
   return(0);
  }
//+------------------------------------------------------------------+
- Free trading apps
- Over 8,000 signals for copying
- Economic news for exploring financial markets
You agree to website policy and terms of use
I am new to MQL4 and have just created my first custom indicator - at the moment it is a grid indicator, however, I would like to add trend lines to it. What I would like to do if possible is to detect the intersection points of the vertical and horizontal lines. Then, pass the values to a trend line object in order to create the object. Is this possible, and if so, is anybody willing to teach me how or point me in the right direction?
Also, I have noticed that trend lines drawn on one time frame move on other time frames - I assume that this is caused by the variable scales and the fact that a time reference on one time frame wont necessarily exist in the data of another...is there anyway to avoid this?
Would really appreciate any help on these questions.
Thanks in advance