HOW CAN DRAW: in chart_window Simultaneously in separate_window with one mql5 file
hi.
is it possible ?
draw in main chart Simultaneously in separate_window with one mql5 file.
Hi ,
bool  ObjectCreate(
   long         chart_id,      // chart identifier
   string       name,          // object name
   ENUM_OBJECT  type,          // object type
   sub_window   nwin,          // window index
   datetime     time1,         // time of the first anchor point
   double       price1,        // price of the first anchor point
   ...
   datetime     timeN=0,       // time of the N-th anchor point
   double       priceN=0,      // price of the N-th anchor point
   ...
   datetime     time30=0,      // time of the 30th anchor point
   double       price30=0      // price of the 30th anchor point
   );
hi.
is it possible ?
draw in main chart Simultaneously in separate_window with one mql5 file.
What do you want to draw ?
hi & thanks for your help.
assume that:in below picture;
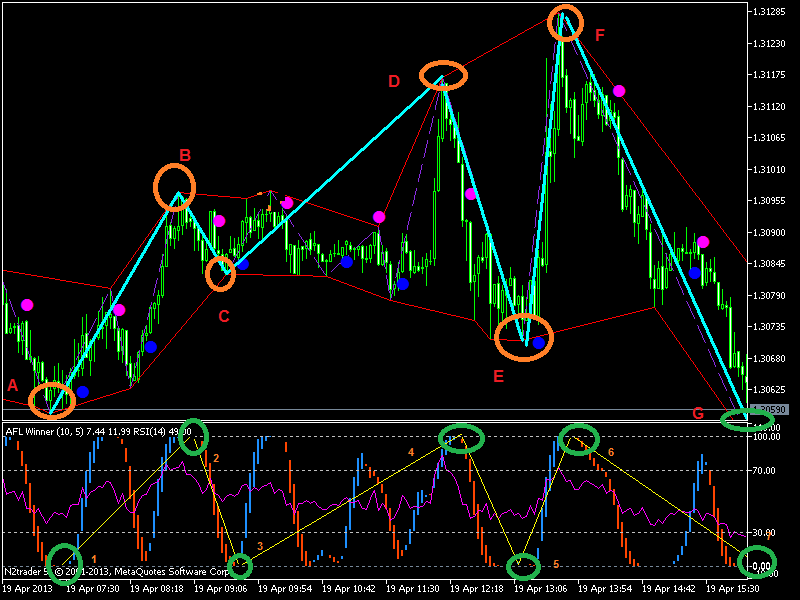
there is 2 indicator .
a) we have 1 indicator (mql5 file) in main chart ; with several indicator and operation ( ZigZag;... &
b) and 1 indicator in separate window ; with several; as you see (AFL & RSI;...
--------------------------------------
i want to draw such as pic. ( zigzag or line;)
for example:
when at least 1 candle of AFL has value=100 draw from 1 to 2 ( in separate window, there is now one candle have value=0) and also in main chart from A to B
and price is given from maximum extermum of zigzag .
then from 2 to 3 ( from last value=100 to value=0) ( in separate window, there is now one candle have value=100) , and also in main chart from B to C
and price is given from MINIMUM extermum of zigzag .
AND ....
------------------------------------------------------------------------------
I PREFER IF IT WAS POSSIBLE;
the adding line code needed for do this;
they are wrote in first indicator ; that is in main chart.
hi & thanks for your help.
...
they are wrote in first indicator ; that is in main chart.
thank you for before;
LET MAKE IT EASY & SIMPLE ;
in pic below;
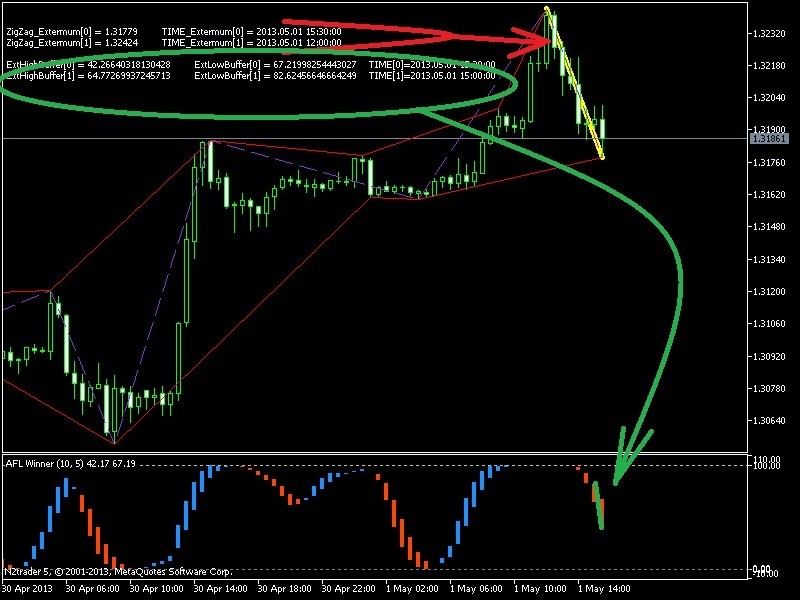
for 2 latest zigzag extermum point, yellow line is drawn by;
   ObjectCreate(0,"line",OBJ_TREND,0,TIME_Extermum[1],ZigZag_Extermum[1],TIME_Extermum[0],ZigZag_Extermum[0]);
   ObjectSetInteger(0,"line",OBJPROP_RAY_LEFT,false);
   ObjectSetInteger(0,"line",OBJPROP_RAY_RIGHT,false);
   ObjectSetInteger(0,"line",OBJPROP_COLOR,Yellow);
   ObjectSetInteger(0,"line",OBJPROP_STYLE,STYLE_SOLID);
   ObjectSetInteger(0,"line",OBJPROP_WIDTH,5);
   ObjectSetString(0,"line",OBJPROP_TEXT,"12");
   ObjectSetInteger(0,"line",OBJPROP_BACK,true);
if in separate window for "AFL_winner" indicator ; want to draw line from lowest previous candle to highest of current candle :
how to define " AFL_winner" indicator ?
find what ? to draw in it.
thank you
answer was:
int indicatorWindow=ChartWindowFind(0,"AFL_Winner");
problem solved.
- Free trading apps
- Over 8,000 signals for copying
- Economic news for exploring financial markets
You agree to website policy and terms of use
hi.
is it possible ?
draw in main chart Simultaneously in separate_window with one mql5 file.