visualization timeframe
I selected M5 as the time frame to execute my EA. Strategy Tester opened the M5 chart, but the candles in the chart are daily. I held my cursor over three consecutive candles so you could see the info
any comments?
MODERATOR EDIT : please, see my post below before applying phamdung196 solution.
I used to be like that but happily find the solution. See the picture below and you will see 2 solution to change from D1 chart to M5 chart.
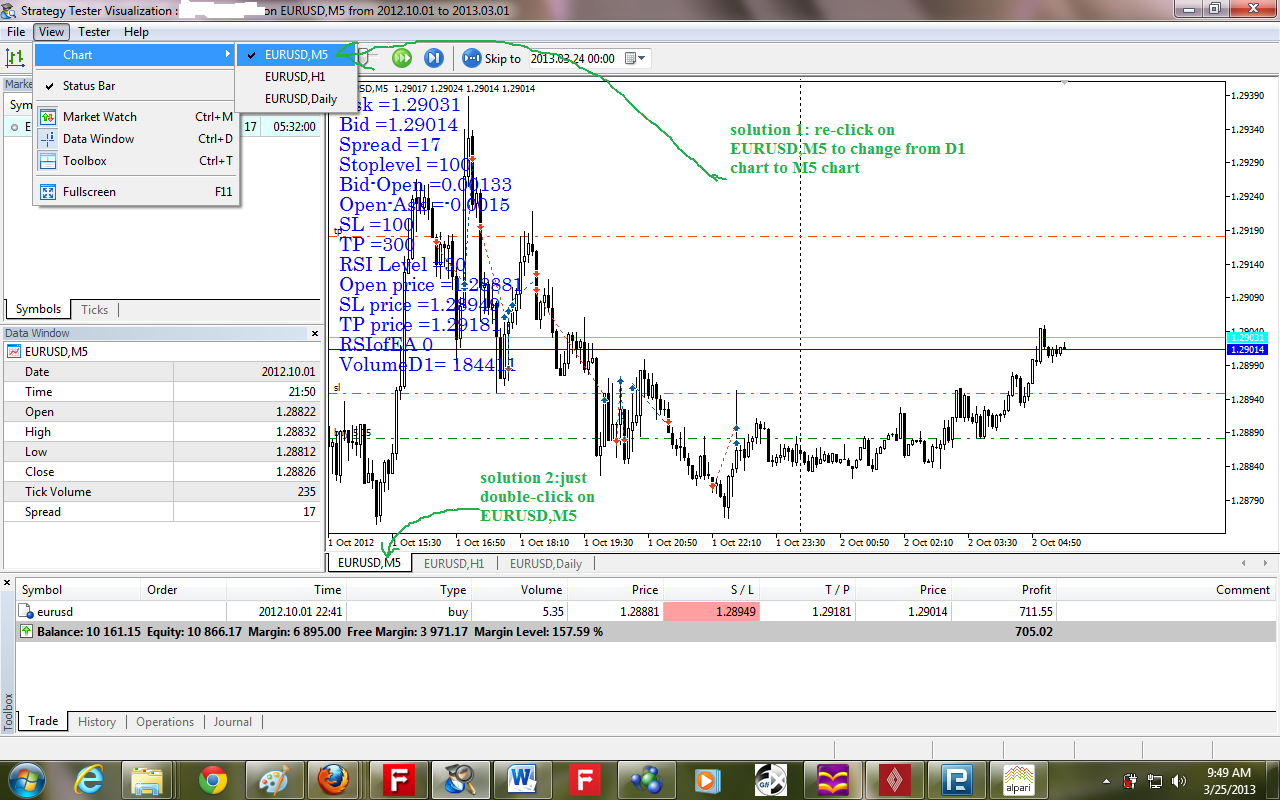
Sometime testing the strategy in M5 period, but visualization only show D1 chart. And we do one of 2 solution as the picture, but it only show H1 period. It's because the testing symbol history only have H1 period and higher ( H4, D1) and don't have the history below H1 ( M30, M15,....). To solve that problem, we need to download the M1 history, you can read the method to download M1 history from link below:
https://www.mql5.com/en/forum/7028
p/s: If you want to change the default templates of visualization , save your templates with name is the exactly as the name of the EA you are testing in the directory
.....MT5 of your broker/Profiles/Templates
any comments?
I contacted the service desk about this problem. They answered me with this : "Open the same data in the client terminal and compares it with visual chart". So if you open an M5 chart on GBPUSD, what do you get?
EDIT : Last answer of Service Desk : "We've found the problem. Please wait for the next build".
- Free trading apps
- Over 8,000 signals for copying
- Economic news for exploring financial markets
You agree to website policy and terms of use
I selected M5 as the time frame to execute my EA. Strategy Tester opened the M5 chart, but the candles in the chart are daily. I held my cursor over three consecutive candles so you could see the info