Indicators: Rabbit
sever29 :
Tell us in detail about your strategy of working on the levels of this indicator.
The simplest one is"Angel's Wings". In the morning two direct pending orders (Buy Stop and Sell Stop) of the same volume without Stop Loss are placed at Rabbit levels. The distance from the current price to each order should be not less than half of the morning flat corridor. It can be calculated by placing the standard indicator Average True Range with a period of 30 on the daily scale chart and then dividing the displayed number by 4. For example, for EURUSD at the current moment ATR = 198 pips, divided by 4, we get about 50 pips. So, if from the price to the nearest Rabbit level, for example, 30 points - the order is placed at the next level. Further, in case of a trend, the profit is fixed manually, by Take Profit, or with the help of Trailing Stop. In case one order triggers and the price moves to the second order, both orders will close at the moment of its opening, fixing the loss.
No Martin? Entry once a day? Why not extend an entry similar to "Asian" to other sessions? Have you tested the idea?
"The simplest"... are there others, more complicated? But without increasing the lot....
No Martin? Entry once a day? Why not extend an entry similar to the "Asian" entry to other sessions? Have you tested the idea?
"The simplest"... are there others, more complicated? But without increasing the lot...
I tested it on EURUSD and GBPUSD - it works like clockwork. If the price is flat, you get a fixed, known in advance minus or 0 if the price does not activate any of the orders during the day. If there is a trend or at least a slow movement to one side - you fix profit or move Stop Loss to the profitable area with the hope for the trend continuation tomorrow. For a month on EURUSD minus the losses we get about 800 pips of profit. Rabbit in this case is a universal filter of the morning flat.
A slightly more complicated strategy isButterfly: placing inverted pending orders (Buy Limit and Sell Limit) at the levels closest to the price, and direct pending orders (Buy Stop and Sell Stop) at the other levels. Take Profit for each order is set slightly less (by a couple of spreads) than the Step value of the indicator, and Stop Loss - at a distance of two Steps. Stop Loss for inverted orders is not set - in case of price movement in a loss, they will be closed by the straight orders following them. For the"Butterfly" is good either a flat within the first levels, or a trend with the crossing of at least three Rabbit levels in one direction. The most unsuccessful is a dangling price with the crossing of only two levels and a pullback. It works more effectively than"Angel Wings", as the profit is fixed by itself, human participation is required only once a day - in the morning, when placing orders. Orders should have a time limit of existence until the end of the day. Profit at the size of the deposit for one order only 1/20 of the deposit is 10 - 50% of the deposit per day. If a loss occurs, it is usually compensated during the day by other orders, but even in the case of a net total loss, its size is 10 - 20% of the deposit. During a month there are 3 - 5 losing days on average, the rest are closed with profit or with 0.
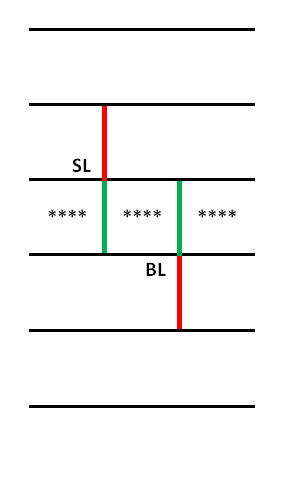
The One is a trading strategy using the Rabbit indicator. In the morning, in the period from 6:30 to 7:30, two pending inverted orders Sell Limit and Buy Limit with Take Profit and Stop Loss in the size of Step are placed at the Rabbit levels closest to the price. After opening of one of them the other order is removed.
Hello! Interesting strategy. Only I have Average True Range with period 30 showing values like 0,0029 or 0,0039. Can't you just divide the width of the corridor by 2? And half of the corridor will be known.
And another question: should I place orders (Buy Stop and Sell Stop) only at levels?
This all relates to the strategy "Angel Wings".
Thank you in advance...
Wow, so many strategies, which one is more profitable?
Do you have a script for MT5?
Although "Angel's Wings" is certainly attractive because of its simplicity.
- Free trading apps
- Over 8,000 signals for copying
- Economic news for exploring financial markets
You agree to website policy and terms of use
Rabbit:
The Rabbit indicator plots the true support/resistance levels for any currency pair. The distance between the levels in points is shown in upper left corner.
Author: JonKatana