 MetaTrader 5
 Experts
 Indicators
 Scripts
 Libraries
 Storage
Join our fan page

News Trading Dashboard - indicator for MetaTrader 5

- Views:
- 1352
- Published:
- Updated:
-
 You are missing trading opportunities:
- Free trading apps
- Over 8,000 signals for copying
- Economic news for exploring financial markets
Registration Log inYou agree to website policy and terms of use
If you do not have an account, please register -
 Need a robot or indicator based on this code? Order it on Freelance
Go to Freelance
Need a robot or indicator based on this code? Order it on Freelance
Go to Freelance
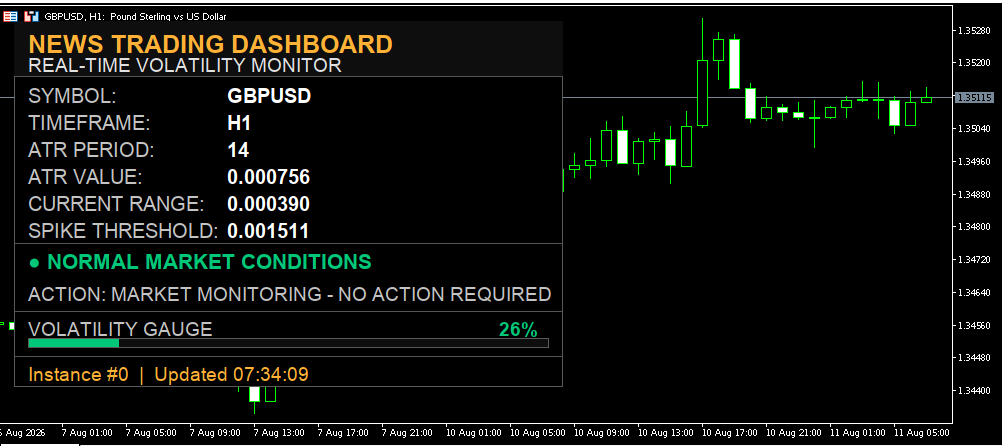
News Trading Dashboard is an informational on-chart panel (it does not trade automatically) that monitors market volatility in real time to detect "news spike" moments — the sudden price moves that occur when economic data is released (NFP, CPI, interest rate decisions, etc.).
Core logic: it compares the current bar's range (High − Low) against the market's average ATR, multiplied by a threshold factor. If the current range exceeds this threshold, it means the market is moving abnormally compared to normal conditions — a typical sign that important news has just hit the market.
How it helps a real trader:
-
It tells you at a glance whether the market is "calm" or "in a spike," without constantly watching the chart or a separate economic calendar.
-
It warns you not to open new positions during extreme volatility moments (wide spreads, slippage, stop-outs).
-
It can run on multiple symbols/charts simultaneously (each instance is independent), useful for anyone tracking several pairs in parallel around a major news release.
Explanation of Each Input
NEWS / VOLATILITY DETECTION
-
InpATRPeriod — the ATR period used as the "normal" reference baseline. A smaller value = more sensitive to recent moves; a larger value = a more stable, less reactive average.
-
InpSpikeMultiplier — how many times larger the current range must be compared to ATR to be considered a "spike." 2.0 = the range must be double the normal level.
-
InpTimerSeconds — how often the footer clock refreshes (the actual calculation runs on every tick via OnCalculate , not on the timer).
DASHBOARD APPEARANCE
-
InpShowDashboard — shows/hides the entire panel.
-
InpTheme — color theme (dropdown, 6 variants).
-
InpFontSize — base text size; the whole panel auto-scales based on it.
-
InpAutoScalePanel — the panel automatically widens to fit the longest possible text (statuses, actions), so nothing ever gets clipped.
-
InpMinPanelWidth — the guaranteed minimum width, regardless of auto-scaling.
DASHBOARD POSITION
-
InpCorner — the anchor corner (Top Left / Top Right / Bottom Left / Bottom Right).
-
InpOffsetX / InpOffsetY — the distance from that corner.
MULTI-INSTANCE
-
InpInstanceID — identifier used to run multiple copies on the same chart (e.g. one for short-term volatility on EURUSD, another with different parameters). If two instances get the same ID, the code automatically generates a unique suffix so they never interfere with each other.
A Few Trading Methods Using This Indicator
-
"No-trade zone" filter around news releases — set InpSpikeMultiplier to 1.5–2.0; when the status turns red ("HIGH VOLATILITY"), pause any automated or manual system for a few minutes, until the gauge drops back below 100%.
-
Breakout on confirmed spike — instead of avoiding the spike, trade it: once the status turns red, wait for the first impulse candle to close, then enter in the direction of the move (momentum trading), with a stop below/above the extreme of the spike bar.
-
Fade on extreme volatility — on major pairs, very large spikes (gauge >200–250%) are sometimes followed by a pullback ("overshoot" of the market). More experienced traders can trade against the initial move, with strict risk control (this is a riskier strategy, suited only to advanced users).
-
Multi-symbol setup for news correlations — by running multiple instances (different InpInstanceID ) on different charts (e.g. DXY, EURUSD, XAUUSD), you can immediately see whether a major macro news event hit all correlated markets at once, confirming that the move is systemic rather than local noise.
-
Amber zone as a position-sizing signal — the amber status ("APPROACHING VOLATILITY ZONE") appears before a full spike; you can use this moment to reduce position size or tighten your stop-loss, rather than waiting for the full red signal.
Channel Breakout Dashboard
Channel Breakout Dashboard is an informational panel (not an automated trading robot) that runs on the MetaTrader 5 chart and centralizes, in one place, several market conditions that would otherwise require 4-5 separate indicators open at the same time.
 MT5 Cash Risk Probe - Read-Only Sizing
Read-only MT5 script that estimates stop-distance cash loss in account currency, reserves explicit cash costs and floors volume to the broker grid. It never sends or modifies an order.
Day Trader Dashboard
The Day Trader Dashboard is a Bloomberg-style visual panel for MetaTrader 5 that tracks an intraday price range and flags when price is inside it (fade zone) or has broken out of it. It doesn't place trades — it's a decision-support overlay that computes the range High/Low from recent bars, draws those levels directly on the chart, and shows a live status readout (scanning / within range / breakout) in a themed, auto-scaling panel. It supports multiple independent instances on the same chart, several color themes, and cleans up 100% of its objects when removed.
FX Dashboard
This is a FX Dashboard style terminal panel on the MT5 chart, plus lines drawn on the chart (EMA, Bollinger, Donchian).