Watch how to download trading robots for free
Find us on Telegram!
Join our fan page
Interesting script?
So post a link to it -
let others appraise it
You liked the script? Try it in the MetaTrader 5 terminal
Indicators

Real-Time Spread Monitor with Session Statistics - indicator for MetaTrader 5

Lorenzo Caputo
Lorenzo Caputo
  • Funded Trader at  Independent Trader
  • Italy
  • 193
Funded trader.
Weekend music producer.
Occasional developer.

Mainly a creative.
Views:
97
Rating:
(1)
Published:
MQL5 Freelance Need a robot or indicator based on this code? Order it on Freelance Go to Freelance
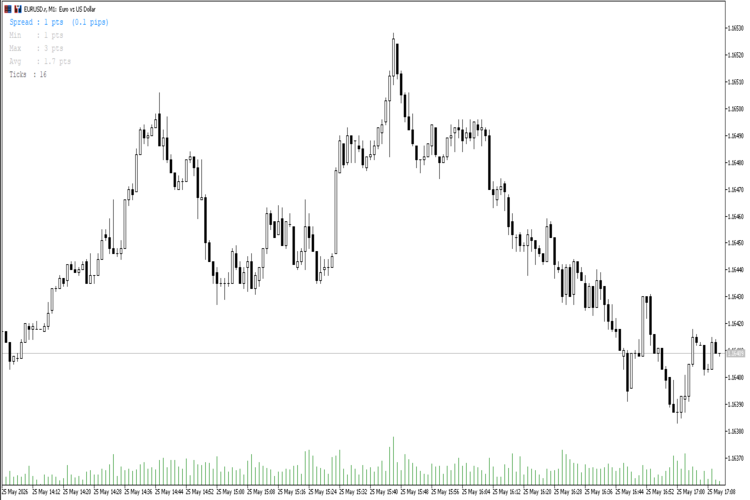
This indicator places a compact information panel in the top-left corner of the 
chart (position is configurable) showing four key spread metrics updated on every 
tick:

- Current spread in points and in pips
- Session minimum spread (lowest recorded since attach)
- Session maximum spread (highest recorded since attach)
- Session average spread (running arithmetic mean)

The current spread value changes color when it crosses a user-defined "wide spread" 
threshold. This is useful for identifying moments when execution costs are elevated 
- for example during news events, session opens, or low-liquidity periods.

All statistics reset when the indicator is reattached or MetaTrader is restarted.

Input Parameters:
- Color Normal Spread: color displayed when spread is below the threshold (default: DodgerBlue)
- Color Wide Spread: color displayed when spread meets or exceeds the threshold (default: OrangeRed)
- Wide Spread Threshold (points): the point value above which the wide-spread color activates (default: 20)
- Font Size: size of the display text (default: 10)
- X Position: horizontal offset of the panel from the corner (default: 15)
- Y Position: vertical offset of the panel from the corner (default: 20)

The indicator uses OBJ_LABEL objects and does not paint any buffers on the price 

chart. It is compatible with all symbols and all timeframes.

//+------------------------------------------------------------------+
//|                                            SpreadMonitorLive.mq5 |
//|                                        Copyright 2026, L.Caputo  |
//|                                                                   |
//+------------------------------------------------------------------+
#property copyright "Copyright 2026, L.Caputo"
#property link      ""
#property version   "1.00"
#property indicator_chart_window
#property indicator_buffers 0
#property indicator_plots   0

//--- Input parameters
input color  InpColorNormal    = clrDodgerBlue;  // Color: Normal spread
input color  InpColorWide      = clrOrangeRed;   // Color: Wide spread
input int    InpWideThreshold  = 20;             // Wide spread threshold (points)
input int    InpFontSize       = 10;             // Font size
input int    InpXPosition      = 15;             // X position (pixels)
input int    InpYPosition      = 20;             // Y position (pixels)

//--- Object name constants
#define SM_CURRENT  "SM_Current"
#define SM_MIN      "SM_Min"
#define SM_MAX      "SM_Max"
#define SM_AVG      "SM_Avg"
#define SM_SAMPLES  "SM_Samples"

//--- Session statistics
int    g_minSpread    = INT_MAX;
int    g_maxSpread    = 0;
double g_sumSpread    = 0.0;
long   g_sampleCount  = 0;

//+------------------------------------------------------------------+
//| Indicator initialization                                         |
//+------------------------------------------------------------------+
int OnInit()
  {
   //--- Reset session statistics on every (re)load
   g_minSpread   = INT_MAX;
   g_maxSpread   = 0;
   g_sumSpread   = 0.0;
   g_sampleCount = 0;

   CreateLabel(SM_CURRENT, InpXPosition, InpYPosition,      InpFontSize,     InpColorNormal);
   CreateLabel(SM_MIN,     InpXPosition, InpYPosition + 18, InpFontSize,     clrSilver);
   CreateLabel(SM_MAX,     InpXPosition, InpYPosition + 36, InpFontSize,     clrSilver);
   CreateLabel(SM_AVG,     InpXPosition, InpYPosition + 54, InpFontSize,     clrSilver);
   CreateLabel(SM_SAMPLES, InpXPosition, InpYPosition + 72, InpFontSize - 1, clrDimGray);
   return INIT_SUCCEEDED;
  }

//+------------------------------------------------------------------+
//| Indicator deinitialization                                       |
//+------------------------------------------------------------------+
void OnDeinit(const int reason)
  {
   ObjectDelete(0, SM_CURRENT);
   ObjectDelete(0, SM_MIN);
   ObjectDelete(0, SM_MAX);
   ObjectDelete(0, SM_AVG);
   ObjectDelete(0, SM_SAMPLES);
   ChartRedraw(0);
  }

//+------------------------------------------------------------------+
//| Main calculation called on every tick / bar                      |
//+------------------------------------------------------------------+
int OnCalculate(const int rates_total,
                const int prev_calculated,
                const datetime &time[],
                const double   &open[],
                const double   &high[],
                const double   &low[],
                const double   &close[],
                const long     &tick_volume[],
                const long     &volume[],
                const int      &spread[])
  {
   if(rates_total <= 0)
      return 0;

   bool inTester = (bool)MQLInfoInteger(MQL_TESTER);

   //--- Standard MQL5 loop: process only new/updated bars
   int start = (prev_calculated > 1) ? prev_calculated - 1 : 0;
   for(int i = start; i < rates_total; i++)
     {
      int s = spread[i];
      if(s <= 0) continue;
      if(s < g_minSpread) g_minSpread = s;
      if(s > g_maxSpread) g_maxSpread = s;
      g_sumSpread  += s;
      g_sampleCount++;
     }

   //--- Current spread for display
   //    Live: SymbolInfoInteger (tick-accurate)
   //    Tester: last value from spread[] buffer
   int currentSpread = inTester ? 0 : (int)SymbolInfoInteger(_Symbol, SYMBOL_SPREAD);
   if(currentSpread <= 0)
      currentSpread = spread[rates_total - 1];
   if(currentSpread <= 0)
      return rates_total;

   double avgSpread = (g_sampleCount > 0) ? g_sumSpread / g_sampleCount : 0.0;
   double pips      = currentSpread / 10.0;

   //--- Current spread label
   color labelColor = (currentSpread >= InpWideThreshold) ? InpColorWide : InpColorNormal;
   ObjectSetString(0,  SM_CURRENT, OBJPROP_TEXT,
                   StringFormat("Spread : %d pts  (%.1f pips)", currentSpread, pips));
   ObjectSetInteger(0, SM_CURRENT, OBJPROP_COLOR, labelColor);

   //--- Session statistics
   if(g_minSpread < INT_MAX)
      ObjectSetString(0, SM_MIN, OBJPROP_TEXT,
                      StringFormat("Min    : %d pts", g_minSpread));

   ObjectSetString(0, SM_MAX, OBJPROP_TEXT,
                   StringFormat("Max    : %d pts", g_maxSpread));

   ObjectSetString(0, SM_AVG, OBJPROP_TEXT,
                   StringFormat("Avg    : %.1f pts", avgSpread));

   ObjectSetString(0, SM_SAMPLES, OBJPROP_TEXT,
                   StringFormat("Ticks  : %lld", g_sampleCount));

   ChartRedraw(0);
   return rates_total;
  }

//+------------------------------------------------------------------+
//| Creates a text label anchored to the upper-left chart corner     |
//+------------------------------------------------------------------+
void CreateLabel(const string name,
                 const int    x,
                 const int    y,
                 const int    fontSize,
                 const color  clr)
  {
   if(ObjectFind(0, name) >= 0)
      ObjectDelete(0, name);

   ObjectCreate(0, name, OBJ_LABEL, 0, 0, 0);
   ObjectSetInteger(0, name, OBJPROP_XDISTANCE,  x);
   ObjectSetInteger(0, name, OBJPROP_YDISTANCE,  y);
   ObjectSetInteger(0, name, OBJPROP_CORNER,     CORNER_LEFT_UPPER);
   ObjectSetInteger(0, name, OBJPROP_FONTSIZE,   fontSize);
   ObjectSetInteger(0, name, OBJPROP_COLOR,      clr);
   ObjectSetString(0,  name, OBJPROP_FONT,       "Courier New");
   ObjectSetString(0,  name, OBJPROP_TEXT,       "---");
   ObjectSetInteger(0, name, OBJPROP_SELECTABLE, false);
   ObjectSetInteger(0, name, OBJPROP_HIDDEN,     true);
   ObjectSetInteger(0, name, OBJPROP_BACK,       false);
  }
//+------------------------------------------------------------------+


Spread Monitor Live Screenshot EUR/USD M1
XAUUSD Spread Alert Utility MT5 XAUUSD Spread Alert Utility MT5

Educational MT5 chart utility that monitors XAUUSD spread on the chart and alerts when spread rises above user-defined warning or danger levels.

Gold Spread ATR Trend Panel MT5 Gold Spread ATR Trend Panel MT5

Educational MT5 chart panel for XAUUSD showing live spread, ATR volatility, EMA trend bias, RSI condition, daily range and active trading session.

Accelerator Oscillator (AC) Accelerator Oscillator (AC)

The Acceleration/Deceleration Indicator (AC) measures acceleration and deceleration of the current driving force.

MACD Signals MACD Signals

Indicator edition for new platform.