Watch how to download trading robots for free
Find us on Twitter!
Join our fan page
Interesting script?
So post a link to it -
let others appraise it
You liked the script? Try it in the MetaTrader 5 terminal
Indicators

XANDER Adaptive Cross - indicator for MetaTrader 5

Cristhian Alexander Gaibor Cuasquer
  • Founder & Systems Engineer at  Xander Pro
  • Ecuador
  • 5031
5 (25)
I'm Cristhian — systems engineer and part of the MQL5 community since 2017. For years I built these tools for my own account, not to sell. I'm publishing them now for one reason: I won't release anything I wouldn't trade with my own money.
| English Русский 中文 Español Deutsch 日本語 Português 한국어 Français Italiano Türkçe
Views:
2639
Rating:
(5)
Published:
Updated:
MQL5 Freelance Need a robot or indicator based on this code? Order it on Freelance Go to Freelance


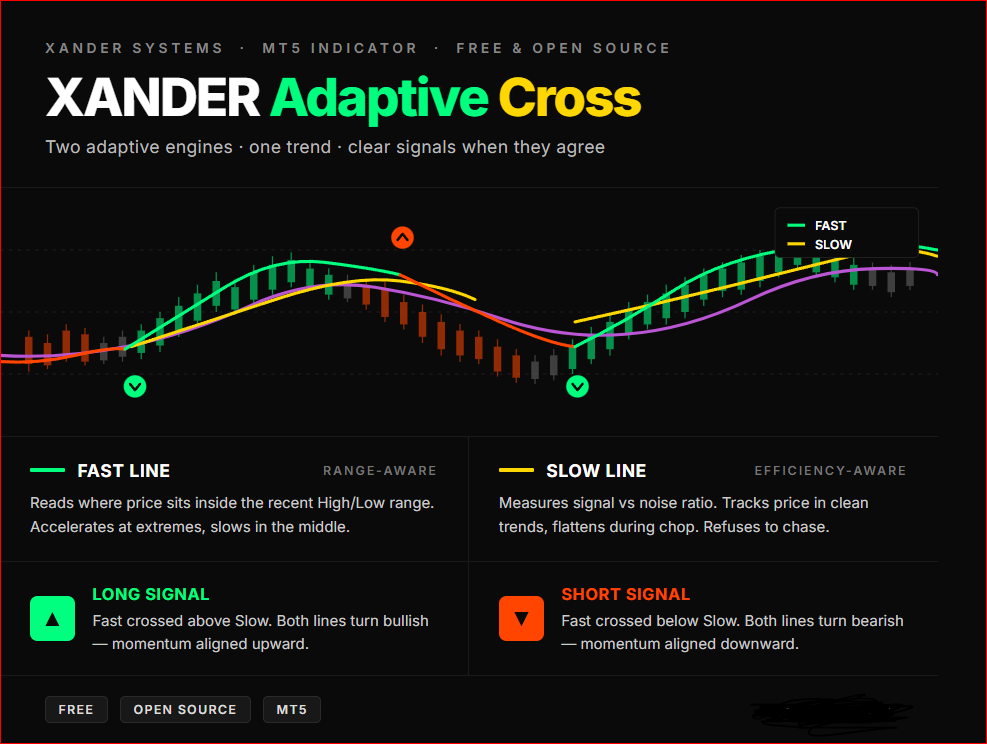
XANDER Adaptive Cross plots two adaptive moving averages on your chart, each one

reading the market through a different lens. When they cross, the system flags a 
trend shift with a color-coded arrow. When they align, you ride the trend with 
visual confirmation from both lines.

━━━━━━━━━━━━━━━━━━━━━━━━━━━━━━
🔍 HOW THE TWO LINES THINK
━━━━━━━━━━━━━━━━━━━━━━━━━━━━━━

▸ FAST LINE — Range-aware adaptive
Reads where the current price sits inside the recent High/Low range.
When price hugs the extremes, the line accelerates — capturing breakouts fast.
When price drifts in the middle of the range, it slows down — filtering noise.

▸ SLOW LINE — Efficiency-aware adaptive
Measures the ratio between net price movement and total path traveled.
When the market is trending cleanly, the line tracks price closely.
When the market is choppy or noisy, the line flattens — refusing to chase.

The two lines don't see the same thing. That's the point. When they agree, 
you have conviction. When they disagree, you have warning.

━━━━━━━━━━━━━━━━━━━━━━━━━━━━━━
🎨 COLOR LANGUAGE
━━━━━━━━━━━━━━━━━━━━━━━━━━━━━━

FAST LINE
🟢 Spring Green — Fast line above Slow (bullish bias)
🔴 Orange Red  — Fast line below Slow (bearish bias)

SLOW LINE
🟡 Gold        — Fast line above Slow (bullish bias)
🟣 Orchid      — Fast line below Slow (bearish bias)

⚪ Dim Gray on either line — undefined or transitioning state

ARROWS
🟢 Green arrow below candle — Fast just crossed above Slow (long signal)
🔴 Red arrow above candle   — Fast just crossed below Slow (short signal)

━━━━━━━━━━━━━━━━━━━━━━━━━━━━━━
📌 HOW TO USE
━━━━━━━━━━━━━━━━━━━━━━━━━━━━━━

- Wait for an arrow — that's your potential entry trigger.
- Confirm both lines have switched to their bullish or bearish color.
- Use the Slow line as a dynamic trailing reference.
- Avoid trading when both lines are flat and gray — the market is undecided.
- Higher timeframe = stronger signal. Test on M15 and above for cleaner results.

━━━━━━━━━━━━━━━━━━━━━━━━━━━━━━
⚙️ KEY PARAMETERS
━━━━━━━━━━━━━━━━━━━━━━━━━━━━━━

- Adaptive Period — Lookback window for both adaptive calculations (default 14).
- Fast Smoothing Period — Maximum responsiveness of the adaptive engines (2).
- Slow Smoothing Period — Maximum smoothing in flat markets (30).
- Efficiency Curve Power — Curvature of the adaptation (default 2.0).
- Applied Price — Close, Open, High, Low, Median, Typical, or Weighted.
Market Clock Pro Market Clock Pro

Candle countdown HUD with trading sessions (UTC), live spread and anomaly detection, daily range vs ADR, and market-closed state with reason (holiday / weekend / session). Holidays calendar included for seven major markets.

Institutional GARCH(1,1) Volatility Forecaster Institutional GARCH(1,1) Volatility Forecaster

A predictive quantitative engine that replaces lagging retail ATR, it utilizes the Nobel-prize-winning GARCH(1,1) econometric model to mathematically forecast future market volatility and variance.

Machine Learning Supertrend Machine Learning Supertrend

A machine-learning inspired approach towards trending regimes. Providing accurate signals and backtest confidence built-in

Easy Range Breakout EA - MT5 Easy Range Breakout EA - MT5

This EA implements a range breakout trading strategy. It calculates a price range between start and end times defined by the user, draws a visual rectangle on the chart to mark the high and low of that range, and then monitors price action after the range closes. If the market breaks above the range high, it opens a buy trade; if it breaks below the range low, it opens a sell trade.