Join our fan page

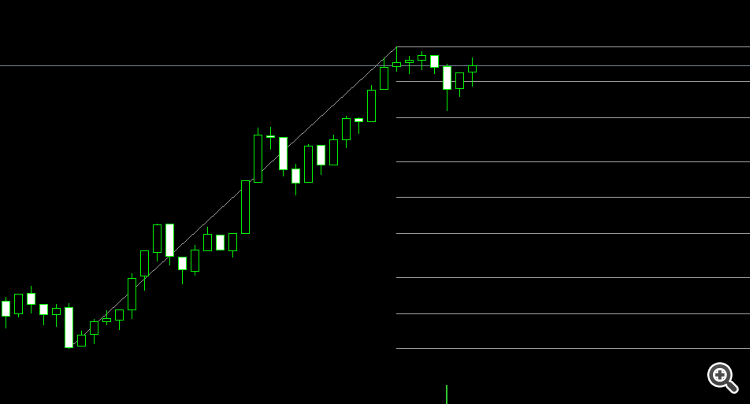
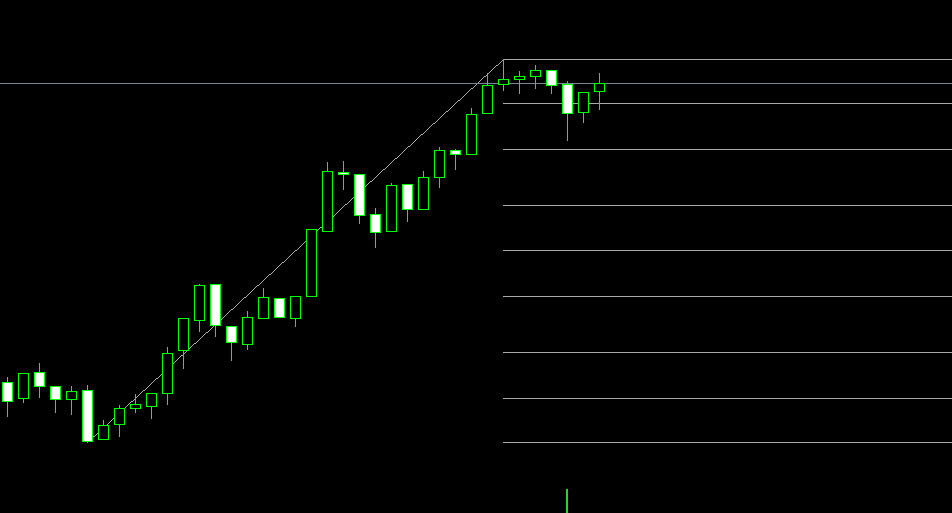
Smart Fibonacci - indicator for MetaTrader 5

- Views:
- 14397
- Rating:
- Published:
- Updated:
-
 You are missing trading opportunities:
- Free trading apps
- Over 8,000 signals for copying
- Economic news for exploring financial markets
Registration Log inYou agree to website policy and terms of use
If you do not have an account, please register -
 Need a robot or indicator based on this code? Order it on Freelance
Go to Freelance
Need a robot or indicator based on this code? Order it on Freelance
Go to Freelance
Key Features
- Automatic Wave Detection: Identifies significant price swings and draws Fibonacci levels automatically
- 23 Fibonacci Levels: Including retracement (0%, 23.6%, 38.2%, 50%, 61.8%, 76.4%, 88.6%, 100%), extension (127.2%, 138.2%, 161.8%, 200%, 261.8%), and negative levels
- Multiple Retracements: Display up to 4 different Fibonacci retracements simultaneously with custom colors
- Pattern Recognition: Detects 4 market patterns (uptrend/downtrend continuation, recent upswing/downswing)
- Body-to-Body Mode: Special mode for JPY pairs for precise candle body measurements
- Customizable Display: Adjustable colors, labels, fonts, and line styles
Main Parameters
- SF_ScanBars : Bars to scan for wave analysis (default: 200)
- SF_RetracementCount : Number of retracements to display (1-4)
- WaveDetectionDepth : Wave detection sensitivity (default: 5)
- WaveDeviationPips : Minimum price movement (default: 3)
- SF_ShowLabels : Display level labels with prices
Usage
The indicator automatically analyzes price action, detects wave patterns, and draws Fibonacci levels. Works on all timeframes and symbols. Best results on H1 and higher timeframes.
Compatibility
MT5 Platform | All pairs | All timeframes
 Checking the time change on the server due to daylight saving time transition
Unfortunately, I found that some brokers Changing the time on the server is a bit incorrect, which I didn't expect. and which surprised me a lot. Here is a script that anyone can use to check their broker.
Checking the server time changes due to the summer time changeover
Unfortunately I had to realise that some brokers are a bit careless with the server time changeover, which I had not expected and which surprised me a lot. Here is a script with which everyone can check their broker.
 TicksShort
A short format for storing ticks.
Value Area Retracement Volume Indicator
The Value Area Retracement indicator, is a powerful volume profile-based tool designed to identify key trading levels—Point of Control (POC), Value Area High (VAH), Value Area Low (VAL), and Profile High/Low—across different timeframes. It helps traders spot potential retracement opportunities to the POC, breakout zones, and value areas, making it useful for intraday, swing, and position trading.