Volume Delta Estimation: suitable methods and their potential drawbacks
Volume delta analysis is a well-known technique used by many traders to get predictive signals on the market. As a handy addition to the total trading volume on a single bar or specific time interval, volume delta is a difference between buy and sell volumes on the same span. It's a signed value.
Thanks to availability of tick history in MetaTrader 5, it's possible to calculate volume delta for exchange instruments. If a tick is marked by TICK_FLAG_BUY, its volume should be counted as positive, and if a tick is marked by TICK_FLAG_SELL, it's negative. This is a most reliable method, because it's not an estimation, but gives actual volume delta. Which is why we mention it first, out of the list of other methods of estimation. If you wish, it can be listed as 0-th, just for reference.
0. Delta by Tick Flags
This approach is implemeted in several products supporting volume delta analysis, such as custom charts generators (PointFigureKagiCharts, RenkoFromRealTicks) and indicators (VolumeDeltaWaves, VolumeDeltaScanner, VolumeDeltaPercentRange).
Unfortunately, it does not work for Forex, CFDs and other non-exchange symbols, where real volumes are unavailable. For such environments we should implement an algorithm (or a set of algorithms) of volume delta estimation based on available tick properties.
The products mentioned above provide several suitable methods to choose from, but since they try to approximate the delta using some assumptions on indirect price-volume interconnections, they may work good under one conditions and not under the others.
Lets us consider the available methods. If you come up with another algorithm, feel free to suggest it.
1. Ask or Bid change
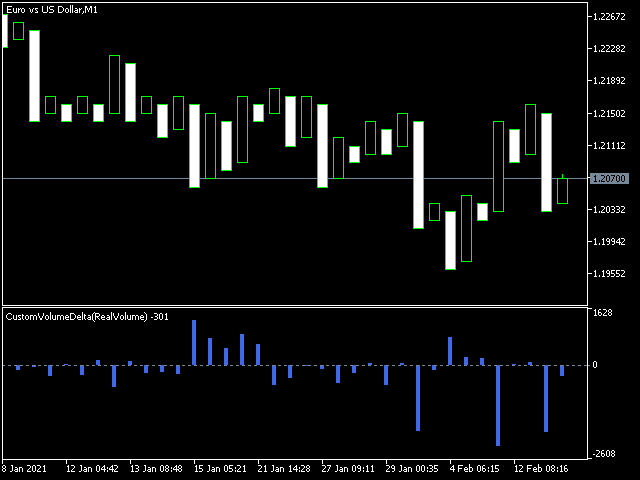
It seems logical that if Ask price moves up between 2 consecutive ticks, there was a buy trade and volume delta should be incremented by 1 (we can only count ticks when real volumes are missing). Similarly, if Bid price moves down between 2 consecutive ticks, there was a sell trade and volume delta should be decremented by 1. If both Ask and Bid have been changed in opposite directions simultaneously, the effect is neutralized: +1 and -1 gives 0.
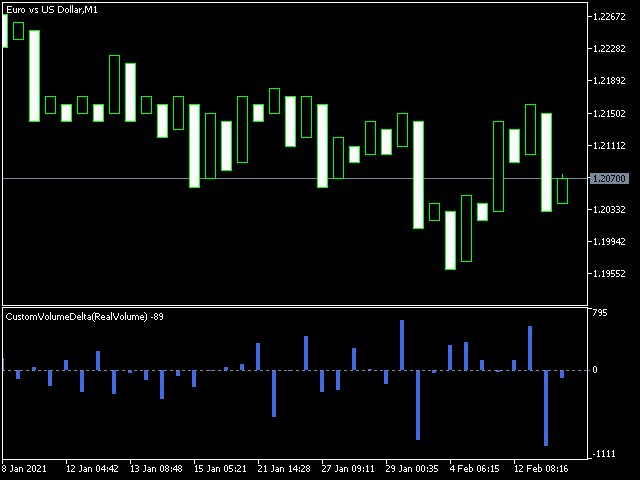
Here is how it looks on a custom Point And Figure chart generated for EURUSD. Please note that the delta is displayed by means of a special indicator CustomVolumeDelta.
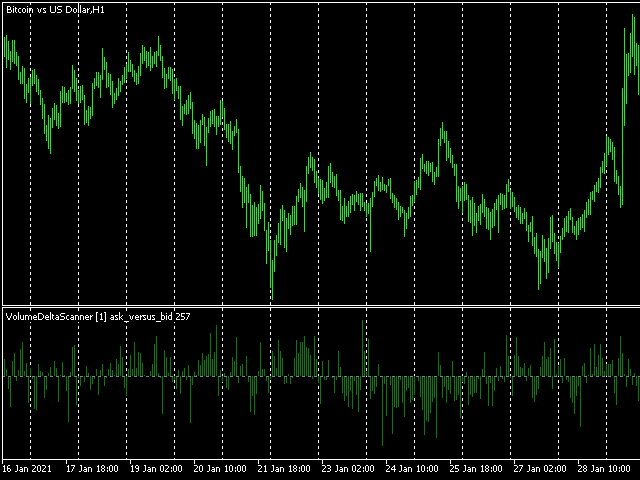
For BTCUSD this algorithm is illustrated by VolumeDeltaScanner indicator. Internally, both implementations share the same source code.
2. Average price change (Ask + Bid) / 2
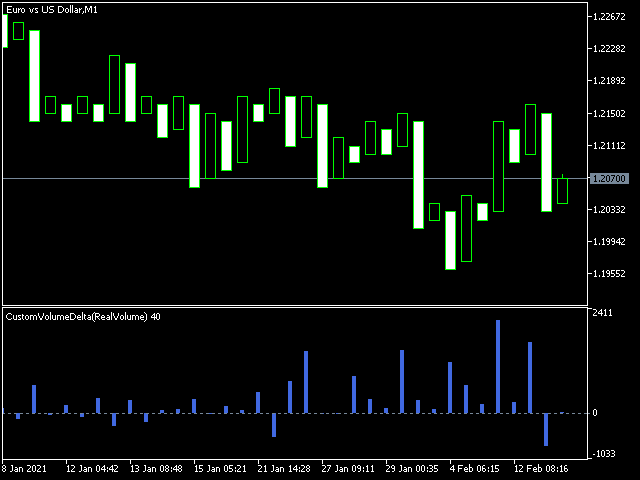
If the sum of Ask and Bid prices moves up or down with a tick, this can be considered as a result of buy or sell trade respectively. Hence the delta should be increased or decreased.
Here is how the delta looks for this method on the same EURUSD PnF custom chart:
And here is how BTCUSD laid out:
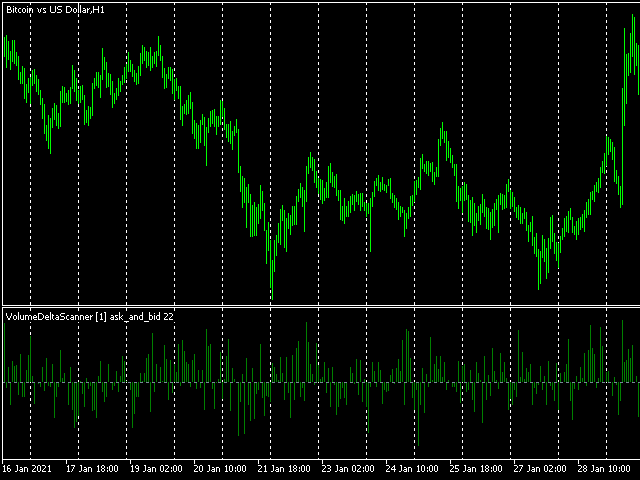
One important thing to note: different algorithms produce different results, and you should manually estimate which one looks more correct. The selection is specific to market, symbol, broker, and probably other circumstances.
This becomes even more obvious as we move to the next method.
3. Chart's building price change (Bid or Last)
The underlying price type used to form candles is considered in MT5 as a leading/base price. One can count its upward change as a buy, and downward change as a sell. For some instruments this should be a preferrable method, whereas for some others it may produce strange results.
For EURUSD PnF we got the following screen:
But on the BTCUSD chart we see obvious positive bias in the delta.
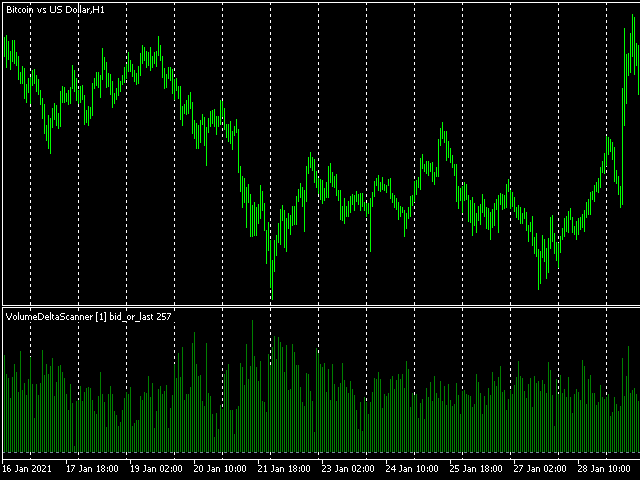
All possible skewness of the volume deltas is explained by underlying tick flow for specific instrument (from a particular broker), there is no bug in the algorithm. This is the result of the specificity of the ticks: upward ticks arrive much frequently then downward ticks. For example, MT5 gets 10 ticks where the price goes 1 point up in every tick, then MT5 gets 1 tick where the price goes 10 points down. All algorithms of volume delta calculation based on price move, will count this as (+10 -1), which gives +9, despite the fact that price is retraced or even may go down (hence we could suppose that the volume delta should be near zero, but that's not the case). According to some researches, this issue may mostly affect the method 3: delta by Bid or Last.
Anyone willing to check such data singularity can export tick history to a csv file, import it to Excel (or other e-table software) and perform calculations by built-in formulae. Alternatively, you can download the script TickFlow.mq5 (see below), and let it accumulate the delta for you.
Taking price delta into account
To make the picture more adequate from user's point of view, a special option can be introduced - name it UsePriceChangeInDelta - to take price distance between ticks into consideration when estimating volume delta. In other words, the volume added or subtracted to/from the cumulative delta is a factor of points/pips.
Here is how BTCUSD chart changes when this option is enabled in VolumeDeltaScanner:
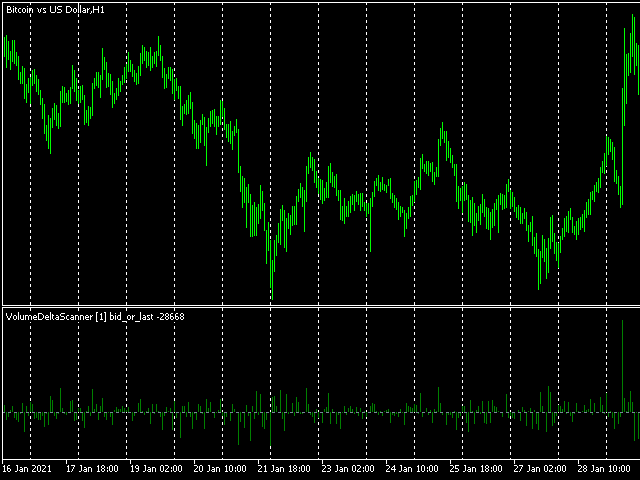
Now it looks more valid.
Yet this option may have its own drawbacks, so it should be enabled only for those symbols for which the broker sends such oddly biased quotes/ticks. The main drawback is that the volume delta becomes more dependent from price action, and less valuable in comparison to other methods, where volume delta can and in many cases does indeed show divergence with price, giving up predictive insights - this seems to be the main power of the volume analysis.
The fact that a data feed may have peculiarities is one the reasons why the products should provide many different modes of the delta calculation. And a trader should choose an appropriate one.
long calcDelta(const MqlTick &t, const MqlTick &p) // t - new tick, p - previous tick
{
  const long v = (long)MathMax(t.volume, 1);
  if(t.bid > p.bid) return v;
  else if(t.bid < p.bid) return -v;
  return 0;
}
The script outputs collected stats to the log.
