

4
215
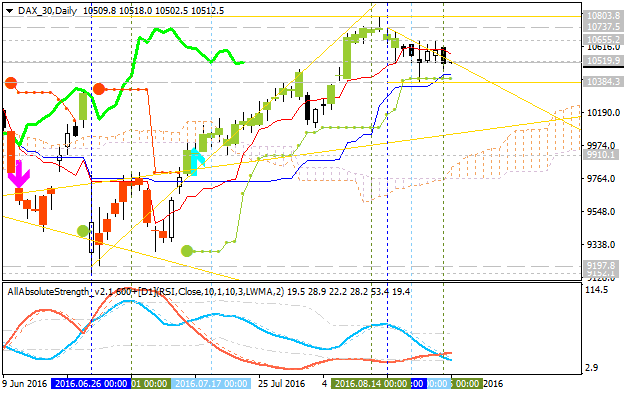
Daily price is above Ichimoku cloud in the bullish area of the chart for the ranging within the following support/resistance levels:
- 10,803.8 resistance level located far above Ichimoku cloud in the bullish area, and
- 10,384.3 support level located in the beginning of the secondary correction to be started.
Chinkou
Span line of Ichimoku indicator is located above the price for the
possible correction in the near future, and Absolute Strength indicator
is estimating the the trend as the local downtrend to be started.
If D1 price breaks 9,197.8 support level on close bar so we may see the reversal of the price movement to the primary bearish market condition.
If D1 price breaks 10,803.8 resistance level on close bar from below to above so the bullish trend will be resumed.
If not so the price will be on bullish ranging within the levels.
| Resistance | Support |
|---|---|
| 10,737.5 | 10,384.3 |
| 10,803.8 | 9,197.8 |
SUMMARY : correction


")