
Statistical Verification of the Labouchere Money Management System
There are three kinds of lies: lies, damned lies, and statistics.
Introduction
While surfing the depths of the Internet during the weekends, I stumbled upon a money management system I had never heard of before. It is called the Labouchere, or Cancellation system (Forex Vacuum Cleaner System using the Labouchere, in Russian). The English description of the system can be found here. The system is a variation of Martingale, since you need to raise your bet after you lose and minimize it after you win. However, it is a less aggressive version, since bets are not doubled, but are raised by a certain amount instead.
Below are some passages describing the system properties that intrigued me very much:
-
"So, please note that the amount of profitable trades should exceed 33-40% percent in order for the system to work properly and win!!!" – This is a very strong statement. However, it is not clear why the initial percentage range is so wide – from 33% to 40%.
-
"Keep in mind, that this method can be considered to be a dishonest scheme by a gaming house". – Really? So, may be it actually works then?!
-
"But the principle remains the same – 33% of wins compensate 66% of losses. So, if you want to apply this money management in real Forex trading, you need a trading system with the winning chance of 50% and the profit factor >=1".
In fact, the mentioned article states that you need a trading system where wins are equal to losses and the win probability is 50% (or even "more than 33%"). If you have such a system, the Labouchere method can easily make it profitable! So, do we even have to look for a system with a positive mathematical expectation, since there is a way to shift it into positive territory? After all, it is not too difficult to develop a trading system featuring, say, 47% of wins...
Let's see how the Labouchere system varies the stakes.
The minimum bet is conventionally assumed to be equal to one. If we win, the bet size remains the same, while our trading balance increases slightly.
If we lose, our bet size is increased by one – up to 2, and we add the losing bet size to the line:
-1
If we win at this point, we should add 2 to our line:
-1 2
Then we cross out these two numbers, since we have managed to win our loss back (in other words, we have increased our balance by one in a series consisting of two bets).
Now, let's consider a longer losing series.
-1
Let's bet 2. Loss:
-1 -2
Let's bet 3. Loss:
-1 -2 -3
Let's bet 4. Loss:
-1 -2 -3 -4
Let's bet 5. Loss:
-1 -2 -3 -4 -5
Let's bet 6. Loss again:
-1 -2 -3 -4 -5 -6
Let's bet 7. We finally win:
-1 -2 -3 -4 -5 -6 +7
Thus, we cross out "-1", "-6" and "+7", since our winning bet compensates two losing ones. The next bet is the sum of the first and the last of the values remaining in the line, i.e. it is 7 again. If we win:
-2 -3 -4 -5 +7We cross out "-2", "-5" and "+7". Our next bet size is again the sum of the first and the last of the values remaining in the line. Yes, it is 7 again (some method followers recommend adding 1 to such a bet, so that you receive the minimum profit instead of 0 in case of a good luck). If we win:
-3 -4 +7
We cross out all the numbers remaining in the line, since we have won our losses back.
If we receive a loss at one of the intermediate stages, the loss size is also entered to the line, and the next bet is equal to the sum of the first and the last values in the line.
So, what are the initial conclusions?
-
A series of 6 losses is indeed compensated by a series of only 3 wins (however, it should actually be a series; we will talk about that later). At first glance, the system really makes it easy to leave the market with no losses.
-
The bet size is increased much slower compared to Martingale. If we have used such a series with the original Martingale system, our final bet would have had to exceed the initial one by 64 times.
-
The total deposit drawdown (the sum of losing bets) in the example above comprises only 21, while it would have been 63 for the original Martingale.
-
Simple calculations show that we should suffer 13 losses in a row to lose all our funds in case the initial bet is 1% of the deposit and 44 losses in a row if it is 0.1%. You may already think: "44 losses in a row with 50/50 ratio!? The probability is vanishingly small! It is more likely that I will be struck by a meteorite! Such probability fits me just fine!", etc.).
-
You can easily find numerous studies devoted to the drawbacks and dangers of the Martingale system. In fact, you can experience these drawbacks on your own by performing simple calculations using a pen and a paper. However, I was not able to find similar studies for the Labouchere system.
-
The betting system looks very complicated, thus hindering the calculation of a resulting mathematical expectation.
But let's go back to our losing series of bets. Let's consider that our 6 losses in a row were followed by only 2 wins, instead of 3. Then our line of numbers will look as follows:
-3 -4
We bet 7 and lose:
-3 -4 -7We bet 10 (note that while we lose, the bet size starts growing by 3 instead of 1 making our series much less safe for our deposit). We lose again:
-3 -4 -7 -10
We have to bet 13 now.
So, the system makes us raise our stakes by more than 1 in case of repeated losses. This seems to be the only way to fully overcome the drawdown. Here is where our deposit may fall into real trouble, since we need a series of wins to overcome the drawdown. Calculating the expectation on paper still seems to be too complicated or at least too boring...
Are you interested in what this system is capable of? If yes, then let's delve into more details.
Setting the Task: Subject and Methods
The most important question is if the Labouchere money management system is really able to shift a mathematical expectation (especially into the positive area). The quoted passage about 33% of wins where win = loss sounds rather unrealistic, of course. But may be 49% or 50% of wins will be enough? And if not, maybe the Labouchere system has some other advantages?
We will use statistics, which means that we need to develop an MQL program (it is MQL4 in this case, since I have not fully mastered MQL5 yet). Let our program perform millions of deals and "wipe out" thousands of deposits — we will look and analyze the results without any harm to our funds. If the program turns out to be profitable, it will be possible to implement the algorithm into real trading.
The Labouchere system has been developed based on the win = loss assumption. It can be adapted for other ratios as well but that does not seem reasonable. If the system can affect the mathematical expectation with win = loss, then it can affect other ratios as well. And if it cannot, then we will simply waste our time pondering over a suitable adaptation.
Besides, we can imagine the system with win = loss and the equilibrium value of 50% of winning bets much easier, since we are all familiar with coin tossing. Therefore, let's call our program CoinTest.
First, we should describe the main features of our future program:
-
We should have an ability to change the winning probability. A 50/50 ratio is just a special case of equilibrium condition.
- We should have an ability to set a risk level. The Labouchere system features a fixed bet size. If we scale our initial bet according to our deposit size, the essence of the system will be lost since our deposit will never return to its initial state after all values are crossed out of the line. We can recalculate a bet size after exiting a drawdown, however, this will lead to fractional numbers which are difficult to work with. Thus, we will use the two variables to set the risk – initial deposit and initial bet.
-
It is necessary to set the maximum number of deals per deposit. It should be big enough, so that we can find out if we are going to lose the deposit even at a very low initial risk. After all, if the deposit continues to grow, the process can be infinite and we may never know the result.
-
We should have an ability to examine the results of trade series on a single deposit both for the program debugging and for changing our business logic. Output to a file suits our purpose well.
-
After we are done with writing a code for a single deposit pass, we should move on to collecting statistics on a series of passes on separate deposits and (preferably) with varying parameters. As you understand, one experiment means almost nothing here. Statistical results are also sent to the file. We no more need to examine a history of individual deposits.
Our bet size selection system can potentially be used in real trading, therefore we should make it a class.
The actual opening of deals in MetaTrader is useless for us at this stage and extremely costly in terms of computing resources. We only need to fix the results of random deals performed using a required lot size and a given winning probability. With this in mind, we will develop a script, since this type of MQL programs is perfect for a single run as compared to Expert Advisors or indicators.
Statistical Verification of the Pseudo-Random Number Generator Quality
The quality of the pseudo-random number generator (PRNG) is of the utmost importance to us, since it will be used to define the outcome of each deal (win/loss). The accuracy of long win/loss series distribution is most critical. We will try to evaluate the latter without referring to complicated mathematical statistics theory.
This article is not intended for a serious study of the PRNG quality (otherwise, we would have had to conduct 15 different tests). We are most interested in the PRNG properties that can affect the Labouchere system testing results and do not require too complex verification procedures.
MetaTrader features the standard MathRand() PRNG function. The PRNG sequence is initialized by the MathSrand() function.
Let's write a small script (RandFile) to check the standard PRNG quality. The script will have 2 parameters:
-
Number of millions of 32-bit random words it should generate (one 32-bit word per 3 calls of the MathRand() function providing 15 significant bits). The unit of measurement is a usual decimal million instead of 2 raised to the 20th power, since we are going to examine the results visually as well.
-
The CalcSeries logical parameter (if the distribution of similar bits series lengths should be calculated).
The calculation of a bit series lengths distribution is very resource-intensive (increasing the script execution time tenfold). Therefore, it has been arranged as a separate option.
The script produces the following results:
- the calculation time (displayed in the journal);
- amount of 1 bits detected among all generated bits (displayed in the journal);
- RandFile.bin file — binary file with the PRNG operation result;
- RandStat.csv file — log file containing the occurrence rates of certain bytes;
- RandOnesSeries.csv file — log file containing "1" bit series lengths;
- RandZerosSeries.csv file — log file containing "0" bit series lengths.
- 10 million test words of 4 bytes each (40 million bytes in total);
- 100 million test words of 4 bytes each (400 million bytes in total);
- 1 000 million test words of 4 bytes each (4 000 million bytes in total).
Now, let's check the following parameters:
- Compressibility of files containing random data by WinRAR with the maximum compression settings. High-quality random data is not compressed. Of course, the incompressibility of files does not necessarily mean the high quality of the random data they contain. But if they are compressed, that means the data has statistical regularity.
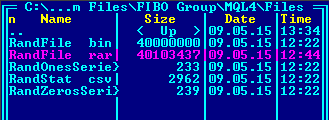
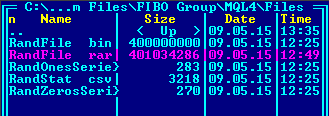
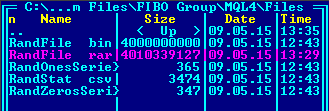
- Amount of "1" bits:
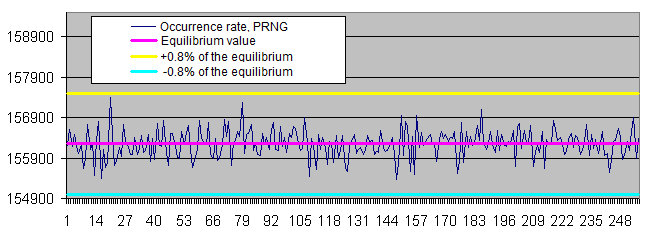
Equilibrium Actual Absolute deviation Deviation, % 10М 160 000 000 160 004 431 4 431 0,0027694 100М 1 600 000 000 1 599 978 338 21 662 0,0013539 1000М 16 000 000 000 15 999 996 180 3 820 0,0000239 - Occurrence rate of certain bytes' values in random files:
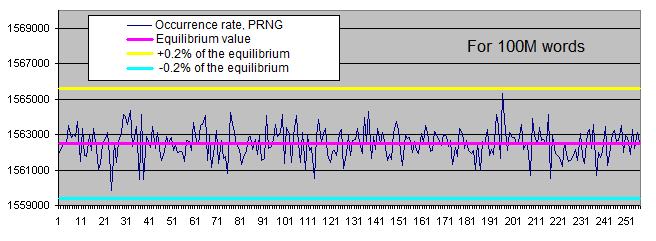
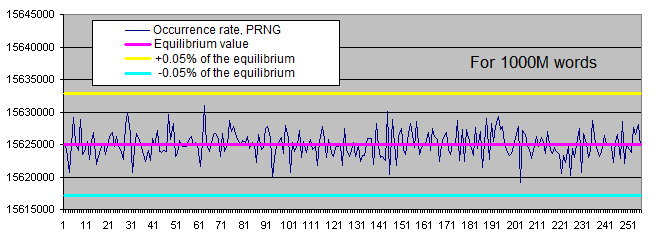
-
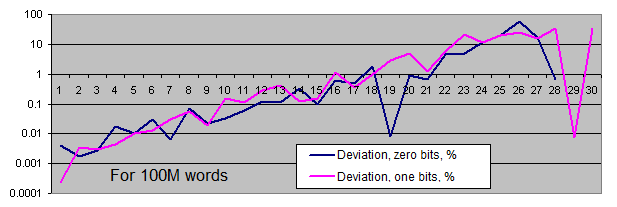
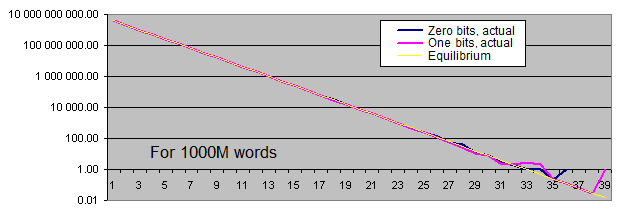
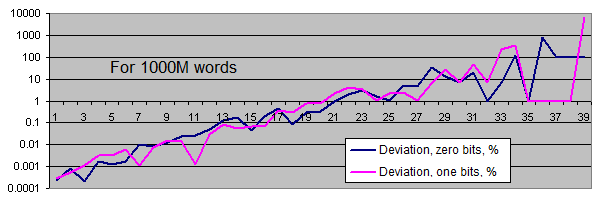
Lengths of identical bits series. We will generate two charts for each sample size:
- the first one displays the actual amount of detected identical bit series of a certain length, as well as the equilibrium value of the amount of series of that length (in logarithmic scale);
- the second shows the percentage deviation of the actual amount of detected identical bit series from the equilibrium (in logarithmic scale).
The linear chart scale is not suitable for us since the values we have are extremely scattered (the values ranging from 1 to 4 000 000 000 or from 0.00001 to 6 000 are present on a single chart). Besides, the chart displaying the equilibrium value of the amount of long series in logarithmic scale is shown as a straight line – while the series length is increased by 1, the probability of its occurrence is halved.
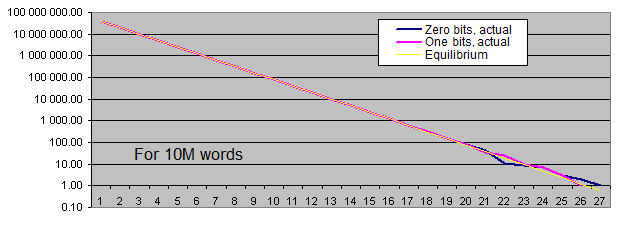

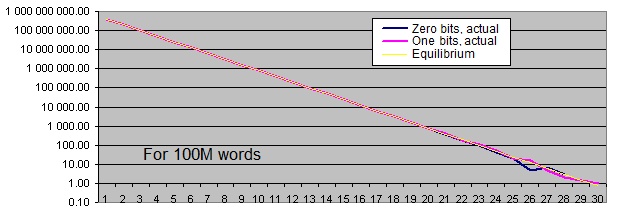
So, what are the conclusions?
-
The standard PRNG efficiency is acceptable for our task.
-
Archiving the files containing the PRNG operation results does not lead to their compression.
-
The amount of zero and one bits corresponds to the equidistant value. The deviation from equilibrium (in percentage) decreases as the sample size increases.
-
The distribution of the occurrence rate of certain bytes in the PRNG operation results fluctuates within a narrow range around the equilibrium. Occurrence rate scatter is reduced as the sample size is increased.
-
Occurrence rate of identical bits series deviates from the equilibrium only if the series are quite long (which is quite rare). With the increase of the sample length, the actual occurrence rate "deviation point" moves away from the equilibrium towards increasing of the series length and is always located around the value of 100 inclusions for the entire sequence.
Thus, we have not detected any major statistical flaws in the standard PRNG that are capable of distorting our test results even with the sequences of approximately 3 billion generations (3 generations are used per 32-bit word).
Writing the CLabouchere Class for Managing Position Size
The CLabouchere class has turned out to be small enough. Its interface consists of only two wrapper functions for setting/receiving initial lot size and two actually working functions – for setting a deal result and receiving the current position size, as well as for resetting to the initial state:
// Labouchere money management.
// Take/stop is assumed = 1/1.
class CLabouchere
{
        private:
        protected:
                // Initial lot. By default - 0.1.
                double p_dStartLot;

                // The string where numbers are stored according to Labouchere
                double p_dLotsString[];
        public:
                void CLabouchere();
                void ~CLabouchere();

                double GetStartLot() {return p_dStartLot;};
                void SetStartLot(double a_dStartLot) {p_dStartLot = a_dStartLot;};

                // Return a lot that is to be used during the next market entry
                double GetCurrentLot();

                // Write the current trade result - take (true) or stop (false)
                void SetResult(bool a_bResult);

                // Reset to the initial state except for the initial lot
                void Init() {ArrayResize(p_dLotsString, 0);};
};
Writing the Script. Preliminary Evaluation
Now, it is time to write a simple script having a hundred or so strings. The input parameters are as follows:
//--- input parameters
input int RepeatsCount=100000;
input int StartBalance = 10000;
input int Take = 50;
input double SuccessPercent = 50.0;
// If true, SuccessPercent is ignored
input bool FiftyFifty = true;
The script makes a series of deals till the deposit is lost or the RepeatsCount is reached.
The case of win/loss ratio = 50/50 is made a separate parameter. In the latter case, one bits of a pseudorandom number are used as coin tossing results. Otherwise, a profit/loss boundary value is calculated and a random number is compared to it. The separate parameter for 50/50 case has been implemented because the cycle of PRNG one bits fits us quite well, though we have not evaluated the occurrence cycle of the values exceeding a boundary value.
The default settings:
- deposit size – 10 000;
- initial bet – 50 (0.5% of the initial deposit).
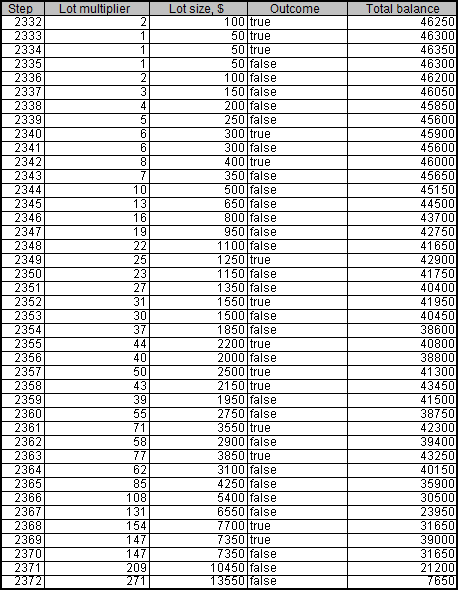
Approximately, at the 10th launch of the script, we receive a spectacular result – the deposit comprises 46 300 at the 2 335th step. However, the drawdown occurs at the 2 372nd step already:
This is how it looks on the chart:
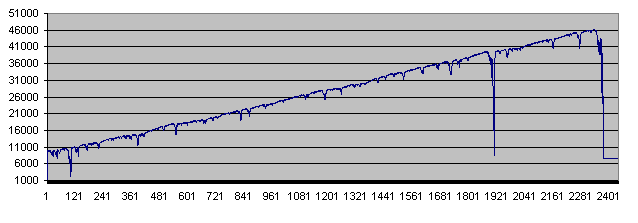
As we can see, the balance fell to critical values twice before the deposit was finally wiped out.
In some cases, the deposit was destroyed within the first few dozens of trades, and there was not even a single case when it showed the maximum lifetime of 100 000 trades.
While I was trying various parameters, the following modifications came to my mind:
-
It would be reasonable to add a parameter defining the amount of funds withdrawn from the trading account. If we manage to withdraw the funds exceeding the initial deposit before it is wiped out, then our initial deposit simply becomes a foreseeable loss. Thus, the new parameter called PocketPercent was implemented. It defines the percentage of successful trades that we withdraw from the trading account and put in the "pocket". Using the "pocket" money is forbidden, only the funds at the trading account are put to risk. After all, that is how it usually happens in real life.
-
Of course, the deposit should be launched multiple times on a loop (it would be quite a mundane task to perform the launch hundreds of times manually). We should also vary a couple of parameters – PocketPercent and Take (the initial bet size), as well as to calculate the average results ("pocket" funds and deposit funds, since the deposit is never brought down to the entire 0 but only down to the moment when it is impossible to perform the next trade).
-
We should have two versions of the script: the first one performs recurrent runs without writing the trading details into a file, while the second one works the opposite way. Recurrent runs mean that we should use the object code. Thus, we develop the "operating code" as the CCoinTest class, while the scripts are made as simple as possible.
The code for the one-pass script is so short that I can show it here in full (all work, including writing the trade details into a file, is done by the CCoinTest class):
#include <CCoinTest.mqh>

//--- input parameters
input int RepeatsCount=100000;
input int StartBalance = 10000;
input int Take = 50;
input int PocketPercent = 10;
input double SuccessPercent = 50.0;
input string S2 = "If true, SuccessPercent is ignored";
input bool FiftyFifty = true;
input string S3 = "If true, use a fixed lot instead of Labouchere";
input bool FixedLot = false;

void OnStart()
{
        MathSrand(GetTickCount());

        CCoinTest Coin;

        Coin.SetRepeatsCount(RepeatsCount);
        Coin.SetStartBalance(StartBalance);
        Coin.SetTake(Take);
        Coin.SetPocketPercent(PocketPercent);
        Coin.SetSuccessPercent(SuccessPercent);
        Coin.SetFiftyFifty(FiftyFifty);
        Coin.SetFileName("Coin.csv");
        Coin.SetFixedLot(FixedLot);

        Coin.Go();
}
After we add the "pocket", the system operation charts look a little different (40% of profit is withdrawn in the following example):

The purple line ("Pocket" balance) is very similar to the perfect trading account chart every trader dreams about. But in fact, we should pay more attention to the yellow line (total balance of the trade account and the "pocket"), which does not look so good. Besides, the following charts are much more common:

Below are our conclusions at the current stage:
-
The system actually demonstrates the behavior intended by the author: drawdowns are often overcome and the deposit tends to grow further.
-
Sometimes, such an attempt ends in complete failure. Actually, the system has only two options after entering the drawdown – it may either overcome it, or lose an entire deposit.
-
The longer a deposit lives, the greater heights it reaches.
-
The initial bet in these examples is 0.5% of the initial deposit (50 out of 10 000). In the first example, the basic risk level has been reduced approximately to 0.1% (the deposit was increased 4.5 times with the initial bet remaining the same). However, these measures did not save the deposit from failure.
Final Evaluation for Different Probability Values. Comparing the Results of the Labouchere and Fixed-Bet Systems
Now, let's move to the most exciting part – collecting the results of many experiments. We are about to find out if the wins on successful deposits can cover the losses on failed ones. Maybe the algorithm proves to be efficient if the initial bet size is lowered (thus, providing more protection to the deposit) or increased? What profit percentage should we withdraw from a trading account? Will the Labouchere system be any different from the fixed-rate one at all? And what will happen if the initial system has a positive mathematical expectation (the "coin" wins more often)? As you can see, there are a lot of questions we should deal with appropriately.
The script for launching deposits in the loop with varying parameters consists of about 100 strings. I will show only a few fragments here.
The input parameters:
//--- input parameters
input int RepeatsCount=100000;
input int StartBalance = 10000;
input string S1 = "Amount of deposits lost";
input int Deposits = 100;
input double SuccessPercent = 50.0;
input string S2 = "If true, SuccessPercent is ignored";
input bool FiftyFifty = true;
input string S3 = "If true, use a fixed lot instead of Labouchere";
input bool FixedLot = false;
The arrays containing the initial bet value and the win percentage placed in the "pocket":
// PocketPercent array
int iPocketPercents[24] = {1, 2, 3, 5, 7, 10, 15, 20, 25, 30, 35, 40, 45, 50, 60, 70, 75, 80, 85, 90, 95, 97, 98, 99};

// Initial bet array
int iTakes[15] = {5, 10, 15, 20, 50, 75, 100, 150, 200, 300, 400, 500, 1000, 2000, 3000};
As we can see, the initial bet size varies from 5 (0.05% of the initial deposit) to 3 000 (30% of the initial deposit). The funds placed in the "pocket" vary from 1% to 99%. The parameters are set with a safety margin that overlaps reasonable limits in both directions.
Thus, the search space is two-dimensional. 360 discrete points (24 * 15) are taken within that space. The average total balance ("pocket" funds + trading account funds) and the average amount of deals before the deposit loss (deposit lifetime) are calculated for each of the points based on the series result. The amount of deposits per series is set by the Deposits parameter.
The two-dimensional space calculation results are three-dimensional, which means that they are difficult to display by two-dimensional means. To overcome this issue, let's simply draw two-dimensional charts with the x-axis standing for the points' serial numbers from the search space (from 0 to 359). If necessary, some certain Takes and PocketPercent values are provided separately.
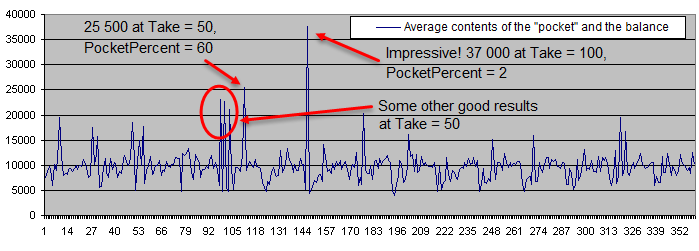
After running 100 deposits, the average balance is as follows:
Below is the deposit lifetime chart (in the logarithmic scale):

The deposit lifetime exceeds 10 000 trades with the initial risk of 0.05% steadily decreasing to less than 10 deals with the initial risk of 30%. The high PocketPercent value also reduces the average amount of deals before a deposit is lost. That is an expected result.
We can select a few promising points on the chart displaying the average contents of the "pocket" and the balance. Four of the points are located close to each other, so hopefully we can find the optimum area. Now, let's calculate the results for Deposits = 1 000 and superimpose them on the same chart:
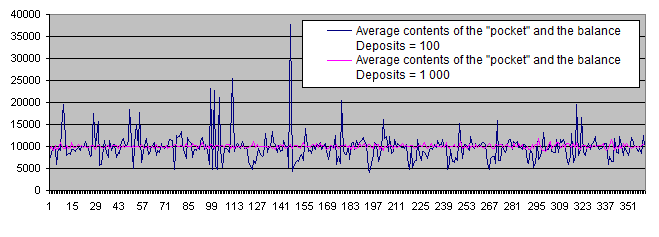
As we can see, the supposedly optimum area simply vanished under the pressure of a sufficiently large number of statistical data. Regardless of any parameters, the chart randomly fluctuates near the initial balance of 10 000.
Thus, Deposits = 100 is not sufficient. All further experiments will be carried out with Deposits = 1 000.
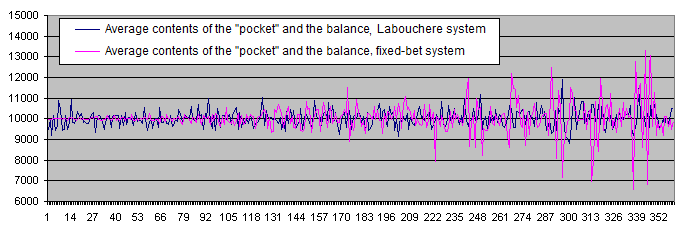
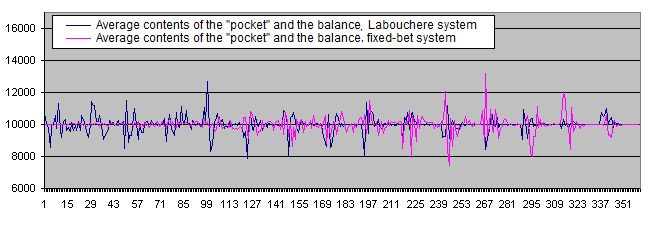
Let's display the results of the Labouchere and fixed-bet systems on a single chart:
The deposit lifetime chart for Labouchere and fixed-bet systems:
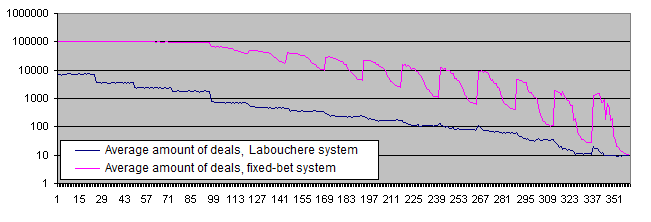
Conclusions:
-
The financial result of the Labouchere system is zero coinciding with that of the fixed-bet system.
-
Unlike the Labouchere system, the fixed-bet one shows increased data scatter around the average value. It seems that the fixed Deposits value does not conform with the statistical behavior of the fixed-bet system too well.
-
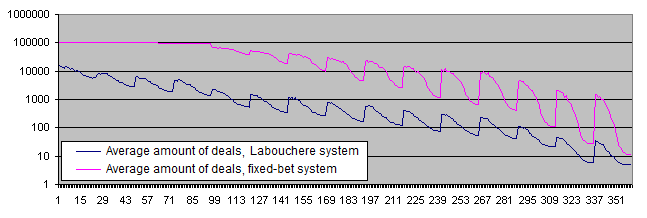
The deposit lifetime is much lower when using the Labouchere system (10 and more times with most parameters and even more than 100 times with certain parameters). In case of a low risk level, we can see that the chart reaches the limitation set by the RepeatsCount parameter (the default value is 100 000). These results partially confirm the popular opinion that the systems capable of increasing the risk level are dangerous for a deposit. Such systems reduce the deposit lifetime, though we have not discovered any dangers for financial results yet (at least on the average and providing that a certain win percentage is withdrawn).
Let's introduce a new script parameter that will allow us to collect sufficient stat data for evaluating the behavior of high-risk areas:
input string S2 = "Minimum amount of deals per each pair of parameters";
input int MinDeals = 10000000;
If we have less than 10 millions trades per 1000 lost deposits, then we should continue.
As a result, the chart data becomes less scattered:
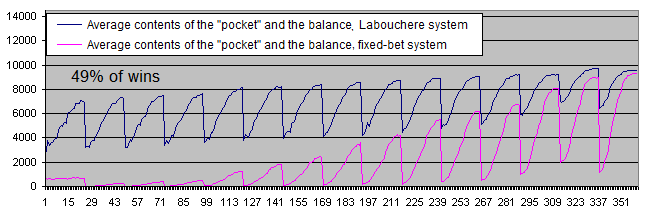
And now let's check the operation of the systems using the initial system probabilities not equal to 50/50.
The deposit lifetime:

What can we see on these charts?
-
In case of 49% of winning deals, both systems become clearly unprofitable.
-
Financial results of the fixed-bet system are very low showing that withdrawal of profit to the "pocket" is more suitable for the Labouchere system than for the fixed-bet one in case of a win ratio less than 50%. The funds are transferred to the "pocket" only after exiting a drawdown.
Unlike the fixed-bet system, the Labouchere is able to set new records over and over again (as long as there is enough money to make yet another bet) even with the win ratio of 49%. In case their deposit is decreasing rapidly, human traders will most probably not perform 100 000 or even 10 000 deals till it is completely wiped out. They will surely stop trading much earlier. The fixed-bet system algorithm cannot do that. The Labouchere system algorithm is much more human-like in this regard, since it behaves just like a trader encouraged by new records and trading till the deposit is completely destroyed.
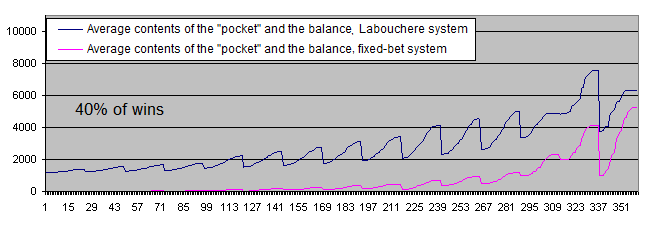
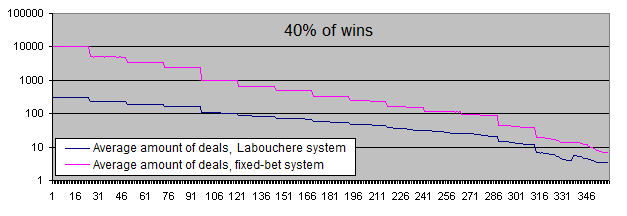
Do you remember the eulogic article I mentioned in the Introduction? It says that the system will work even with "33-40%" of wins. Let's check the upper boundary (40%) of this range just for the fun of it:
Now, let's consider the positive mathematical expectation of the initial system (more than 50% of wins).
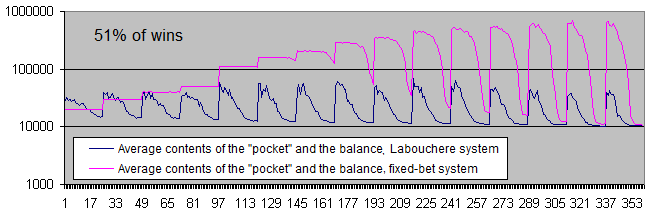
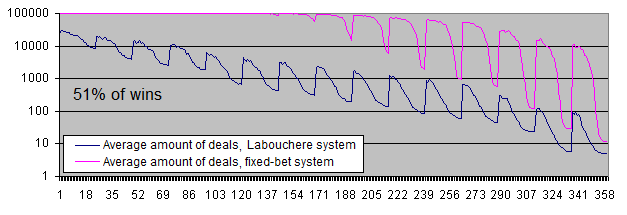
We have to display the balance charts in logarithmic scale even with the win ratio of 51%.
Conclusions:
-
Both systems have moved to positive expectation.
-
In case of a low risk level, the fixed-bet system shows the unlimited "vitality". In other words, it is almost impossible to lose a deposit.
-
However, the Labouchere system is still capable of destroying a deposit (but do not forget about the "pocket").
-
The fixed-bet system makes 10 times more profit than the Labouchere with most parameters (and sometimes even 17 times more profit with certain parameters).
Most readers may think that the fixed-bet system is in all respects superior to the Labouchere. Not only it protects a deposit better, but also brings 10 times more money! Unfortunately, they are deceived by statistics.
The fixed-bet system bumps into the limitation of 100 000 trades per one deposit. If the RepeatsCount parameter has been 200 000, then the system would have made 2 times more profit. "But it's just wonderful!" – the readers deceived by statistics will say. And they will be wrong again.
Take a look at the chart of the average profits made by the systems per trade (in logarithmic scale):

The chart of the profit per trade in percentage of the initial bet makes the entire picture even clearer:
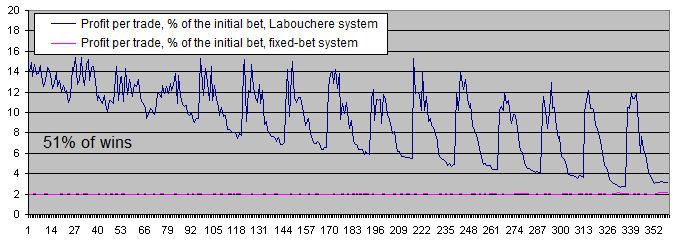
Conclusions:
-
The fixed-bet system makes 2% of the initial bet per trade. This is fully consistent with the theory, since the win/loss rate is 51/49 here. In other words, the wins exceed the losses by 2.
-
The Labouchere system makes more profit even with the most unsuitable parameters. And if the parameters are set correctly, it may yield as much as 6-7 times more profit.
So, it seems that if you have an unlimited amount of time, you can do quite well without the Labouchere system.
You may argue that the fixed-bet system can be replaced with the fixed risk percentage system, so that the profit per trade is increased (actually, the profit will grow continuously, but we should use similar distances for comparison). However, in this case, a position volume should be changed for the Labouchere system as well.
So, the Labouchere system seems to be more profitable, doesn't it?
If you say yes, then statistics has deceived you once again.
Take a look at the table:
| Bet size |
Percentage transferred to the "pocket" |
"Pocket" and balance average contents, Labouchere system |
Average amount of deals, Labouchere system |
"Pocket" and balance average contents, fixed-bet system |
Average amount of deals, fixed-bet system |
Profit per trade, Labouchere system |
Profit per trade, fixed-bet system |
Profit per trade, % of the initial bet, Labouchere system |
Profit per trade, % of the initial bet, fixed-bet system |
|---|---|---|---|---|---|---|---|---|---|
| 75 |
10 |
51 177.34 |
3 728.62 |
160 489.6 |
99 530.41 |
11.04 |
1.51 |
14.72 |
2.02 |
| 500 |
45 |
14 016.36 |
127.27 |
349 479 |
33 771.46 |
31.56 |
10.05 |
6.31 |
2.01 |
In fact, we can easily make the same amount of profit using the fixed-bet system. We simply need to raise the bet 7 times (from 0.75% up to 5% in this case). Of course, 5% is a very high risk level. But the fixed-bet system still has 10 times more "vitality" in this case.
So, the fixed-bet system seems to be more beneficial, doesn't it?
I think, statistics has betrayed you again.
In fact, it does not matter how many deals your deposit is able to survive (on the average, of course), since we put a part of our profits in the "pocket". If the total "pocket" funds exceed the initial account balance several times, the loss of the deposit is not a significant issue.
Perhaps, the most valid conclusion that can be drawn from these calculations is as follows: "If the win ratio is 51%, the profits made by the Labouchere and fixed-bet systems are roughly the same, provided that the former has the initial bet of 0.75% of a deposit and 10% of the profit is withdrawn from the account, while the latter has a fixed bet of 5% of the initial deposit and 45% of profit is withdrawn from the account. The Labouchere system reaches the same level of profitability by increasing the position size during its operation".
Besides, keep in mind that any statistical conclusions are considered to be valid only after conducting a large number of experiments. A single virtual account can be virtually split into several deposits. The loss of one virtual deposit means losing a part of the trading account and returning to the initial bet size when a certain risk level is reached. However, the article shows that simulation of as much as 100 deposits still yields very scattered data. If we split an average trader's deposit into 100 parts, normal trading will be impossible.
Which system is better? It is hard to say. The choice depends on traders' preferences, and the mathematical expectation of the initial system is of critical importance here. The code shown in the article allows anyone to simulate the Labouchere system operation on their own trading system.
Let's examine the charts of both systems with 55% of wins:
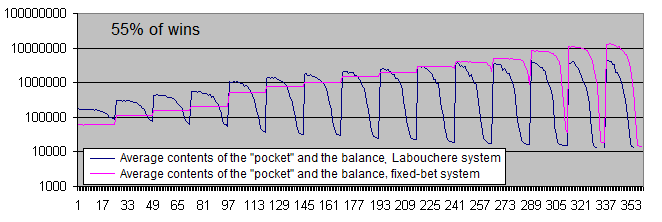
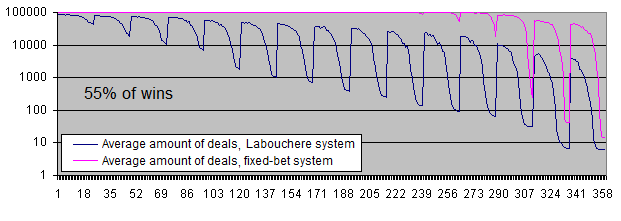

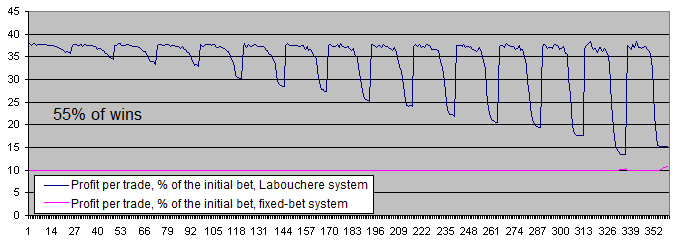
With 55% of wins, both systems become profitable.
The difference between the average profits per trade has decreased from 6-7 times (51% of wins) down to about 3.7 (55% of wins). This happens due to the fact that at a higher expectation of the initial system, the Labouchere system spends less time in drawdowns and therefore, does not have to trade using an increased lot too often.
Conclusion
No miracle happened. The Labouchere money management system cannot turn a loss-making or even a neutral system into a profitable one.
Besides, the sources of some misconceptions about the Labouchere system are clearly seen now:
- Complexity that hinders calculation of the system results.
- Lack of statistical data during manual tests.
- Ability of the system to set new profit records over and over again even if the initial system has negative expectation, thus making traders believe in its efficiency.
Is the Labouchere system worth trying with a positive expectation system? The choice is yours. The Labouchere system is quite complicated, and its efficiency can hardly be called outstanding. Anyway, I can give you two tips – do not exceed the acceptable risk level if you care about your deposit and try to improve the mathematical expectation of your trading system.
Translated from Russian by MetaQuotes Ltd.
Original article: https://www.mql5.com/ru/articles/1800
 Drawing Dial Gauges Using the CCanvas Class
 Managing the MetaTrader Terminal via DLL
- Free trading apps
- Over 8,000 signals for copying
- Economic news for exploring financial markets
You agree to website policy and terms of use
I would like to upload an EXCEL- (LO-) sheet for others to play and check the system but I have no possibility to upload anything since my profile has been changed. :(