Aller Uja / Profil
- Information
|
2 Jahre
Erfahrung
|
12
Produkte
|
3
Demoversionen
|
|
0
Jobs
|
5
Signale
|
23
Abonnenten
|
📊 Systematischer & algorithmischer Trader | Live-Signale | MT5 Expert Advisors & Tools | Seit 2011
Ein Multi-Strategie-EA-Portfolio mit diszipliniertem Risikomanagement.
Handel seit 2011 · Algorithmisch seit 2018 · Live-Signale auf MQL5 seit 2024
⚙️ Handelsansatz
- Vollautomatische Strategien (Expert Advisors)
- Multi-Strategie-Portfolio
- Kapitalschutz vor Wachstum
- Kein Martingale / kein Grid / kein Nachkaufen in Verluste
📈 Meine Signale
Aufgelistet im Reiter Signale oben. Jedes arbeitet mit Stop-Loss und festem Risiko pro Trade, und hinter jedem steht eine echte Strategie, die ich selbst einsetze und überwache.
🧰 Meine Expert Advisors
Regelbasierte Systeme, die Sie auf dem eigenen Konto laufen lassen statt zu kopieren — im Reiter Markt oben. Ein harter Stop auf jeder Position, gemessene statt versprochene Zahlen, und eine kostenlose Demo für Ihren eigenen Strategietester.
🛠️ Meine Tools
MetaTrader-5-Werkzeuge, die ein Konto schützen statt es zu handeln: Stop-Loss-Durchsetzung, Prop-Firm-Regeln, Drawdown-Grenzen, Trade-Audit, lokales Kopieren. Die meisten sind kostenlos.
⚡ Infrastruktur
Professionelles VPS für stabile Ausführung und geringe Latenz.
🔎 Transparenz
Hier gibt es keine Demokonten und keine Backtests, die als Live-Handel ausgegeben werden.
Die vollständige Historie, samt der Verlustmonate: https://technotrader.net
⚠️ Risikohinweis
Handel ist mit Risiko verbunden, und Drawdowns gehören normal dazu.
Handeln Sie nie mit Geld, dessen Verlust Sie sich nicht leisten können.
_______________________________
🔗 Dienste, die ich selbst nutze und empfehle:
🌐 Broker (ICTrading)
https://www.ictrading.com/?camp=83911
📒 Handelsjournal & Analyse (FXer)
https://fxer.net
💱 Code: TECHNOTRADER50 (50% Rabatt für 6 Monate)
🏛️ Prop-Firma (The5ers)
https://www.the5ers.com/?afmc=92n
🧪 Strategie-Inkubator (Darwinex Zero)
https://www.darwinexzero.com/?fpr=y68tgd
💱 Code: TECHNOTRADER_20 (20% Rabatt)
Einige der obigen Links sind Affiliate-Links.
_______________________________
📧 Kontakt
💬 Telegram https://t.me/TechnoTrader28
▶️ YouTube https://www.youtube.com/@TechnoTraderStream
TechnoTrader | Automatisierte Handelssysteme
Folgen Sie den Signalen, betreiben Sie einen EA auf Ihrem Konto, testen Sie die kostenlosen Tools oder fragen Sie auf Telegram.
Ein Multi-Strategie-EA-Portfolio mit diszipliniertem Risikomanagement.
Handel seit 2011 · Algorithmisch seit 2018 · Live-Signale auf MQL5 seit 2024
⚙️ Handelsansatz
- Vollautomatische Strategien (Expert Advisors)
- Multi-Strategie-Portfolio
- Kapitalschutz vor Wachstum
- Kein Martingale / kein Grid / kein Nachkaufen in Verluste
📈 Meine Signale
Aufgelistet im Reiter Signale oben. Jedes arbeitet mit Stop-Loss und festem Risiko pro Trade, und hinter jedem steht eine echte Strategie, die ich selbst einsetze und überwache.
🧰 Meine Expert Advisors
Regelbasierte Systeme, die Sie auf dem eigenen Konto laufen lassen statt zu kopieren — im Reiter Markt oben. Ein harter Stop auf jeder Position, gemessene statt versprochene Zahlen, und eine kostenlose Demo für Ihren eigenen Strategietester.
🛠️ Meine Tools
MetaTrader-5-Werkzeuge, die ein Konto schützen statt es zu handeln: Stop-Loss-Durchsetzung, Prop-Firm-Regeln, Drawdown-Grenzen, Trade-Audit, lokales Kopieren. Die meisten sind kostenlos.
⚡ Infrastruktur
Professionelles VPS für stabile Ausführung und geringe Latenz.
🔎 Transparenz
Hier gibt es keine Demokonten und keine Backtests, die als Live-Handel ausgegeben werden.
Die vollständige Historie, samt der Verlustmonate: https://technotrader.net
⚠️ Risikohinweis
Handel ist mit Risiko verbunden, und Drawdowns gehören normal dazu.
Handeln Sie nie mit Geld, dessen Verlust Sie sich nicht leisten können.
_______________________________
🔗 Dienste, die ich selbst nutze und empfehle:
🌐 Broker (ICTrading)
https://www.ictrading.com/?camp=83911
📒 Handelsjournal & Analyse (FXer)
https://fxer.net
💱 Code: TECHNOTRADER50 (50% Rabatt für 6 Monate)
🏛️ Prop-Firma (The5ers)
https://www.the5ers.com/?afmc=92n
🧪 Strategie-Inkubator (Darwinex Zero)
https://www.darwinexzero.com/?fpr=y68tgd
💱 Code: TECHNOTRADER_20 (20% Rabatt)
Einige der obigen Links sind Affiliate-Links.
_______________________________
📧 Kontakt
💬 Telegram https://t.me/TechnoTrader28
▶️ YouTube https://www.youtube.com/@TechnoTraderStream
TechnoTrader | Automatisierte Handelssysteme
Folgen Sie den Signalen, betreiben Sie einen EA auf Ihrem Konto, testen Sie die kostenlosen Tools oder fragen Sie auf Telegram.
Freunde
340
Anfragen
Ausgehend
Aller Uja
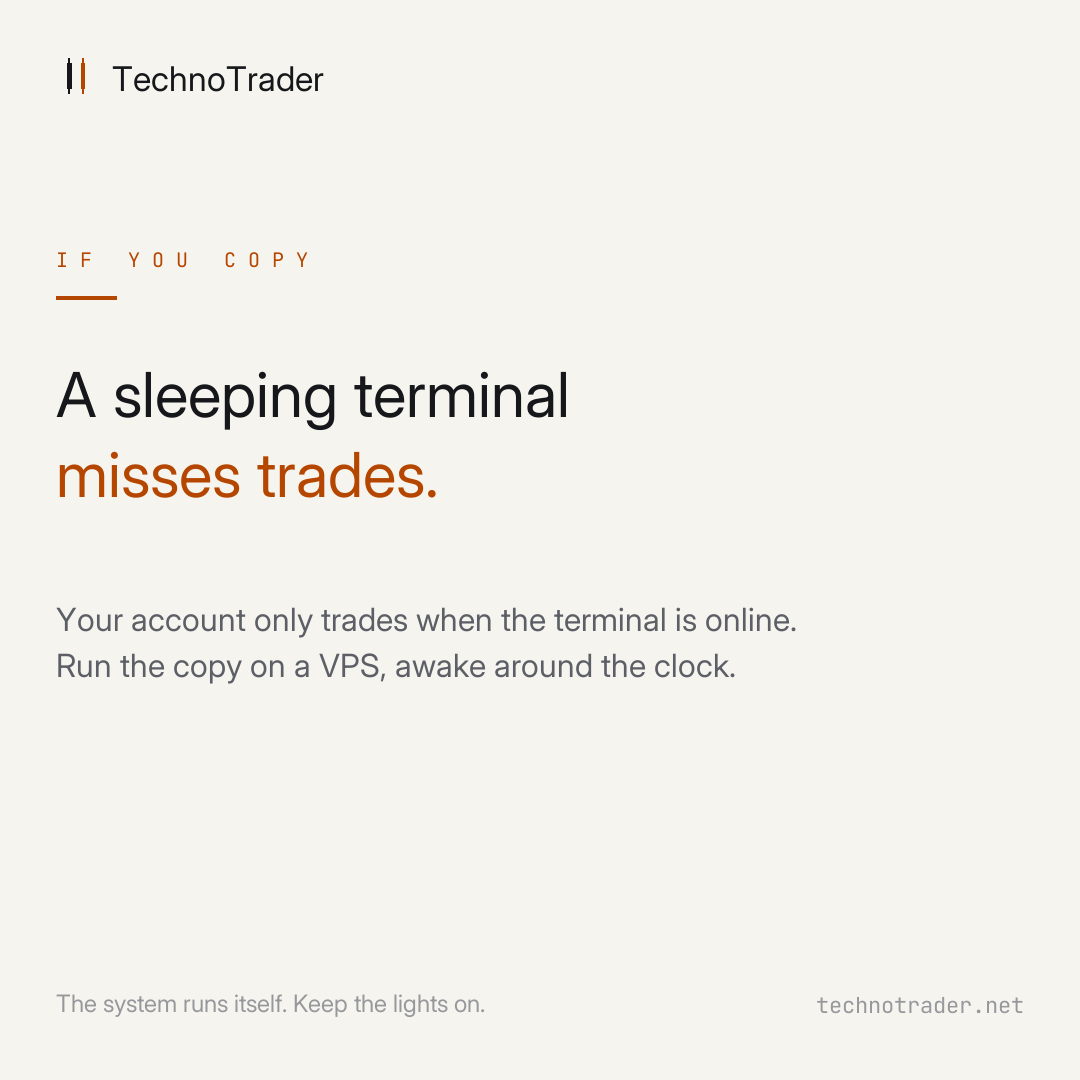
A practical note for anyone copying this signal. Your account only takes a trade if your terminal is online at the moment the master opens it.
A laptop that sleeps, a home connection that drops, a machine switched off overnight. Any of those and you quietly miss trades the master took. Over time that is the most common reason a copy drifts from the page, and it is entirely self-inflicted.
The fix is dull and it works. Run the copy on a VPS, a small server that stays on around the clock. Then your account is awake whenever the system is, and what you see on the page is closer to what you actually get.
The system runs itself. Your job is to keep the lights on.
https://www.mql5.com/en/signals/2307342
A laptop that sleeps, a home connection that drops, a machine switched off overnight. Any of those and you quietly miss trades the master took. Over time that is the most common reason a copy drifts from the page, and it is entirely self-inflicted.
The fix is dull and it works. Run the copy on a VPS, a small server that stays on around the clock. Then your account is awake whenever the system is, and what you see on the page is closer to what you actually get.
The system runs itself. Your job is to keep the lights on.
https://www.mql5.com/en/signals/2307342
Aller Uja
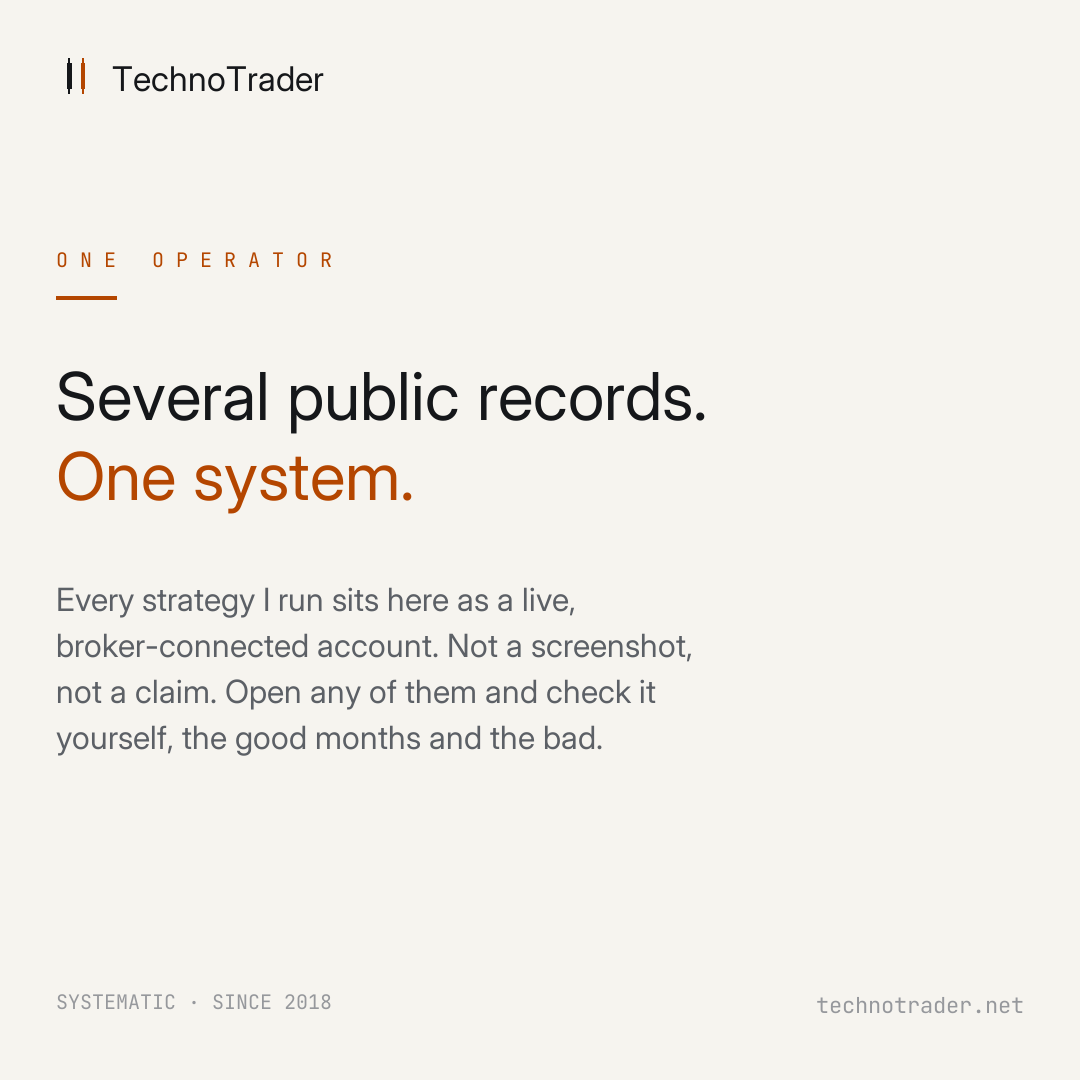
A note on how this profile is set up. Every strategy I run sits here as a public, broker-connected account, not a screenshot and not a claim.
One operator, several live windows into the same way of working. A flagship, a few more focused signals, a new EU-accessible entry signal for smaller accounts, and one that runs the same rules, not the same trades, on a completely independent broker as an independent check.
Different accounts, different brokers, one system. You can open any of them and check it yourself, including the stretches I would rather you did not see. Keeping all of it public, the good months and the bad, is the point.
https://www.mql5.com/en/users/aller.techno
One operator, several live windows into the same way of working. A flagship, a few more focused signals, a new EU-accessible entry signal for smaller accounts, and one that runs the same rules, not the same trades, on a completely independent broker as an independent check.
Different accounts, different brokers, one system. You can open any of them and check it yourself, including the stretches I would rather you did not see. Keeping all of it public, the good months and the bad, is the point.
https://www.mql5.com/en/users/aller.techno
Aller Uja
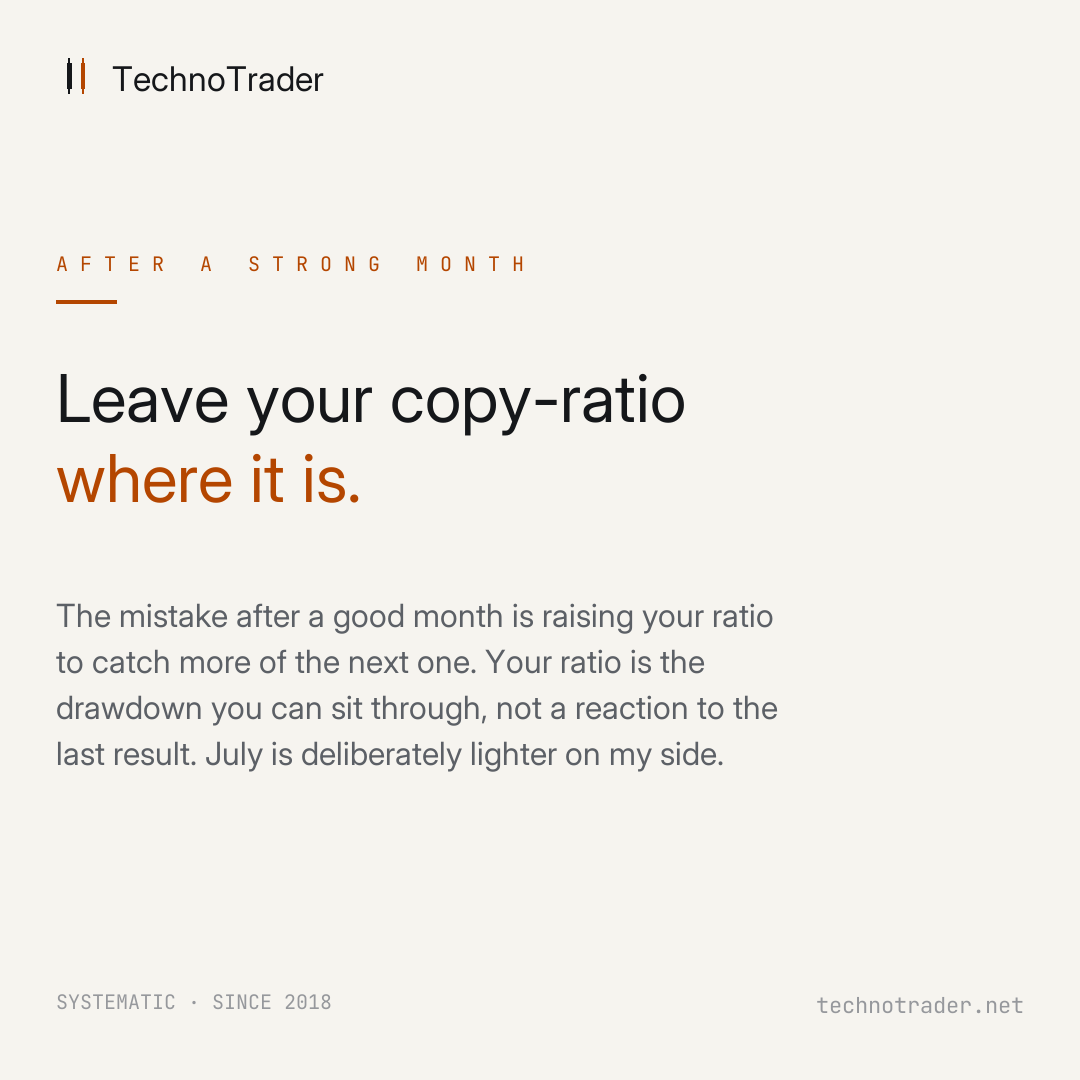
A quick note for anyone copying this signal after a strong month. The most common mistake right now is to see a good June and raise your copy-ratio to catch more of the next one.
Your copy-ratio is a risk setting, not a reaction to the last result. It should be set to the drawdown you can sit through, not to the month you just watched. A strong month does not change what the system can lose in a bad one.
If anything, this is the wrong moment to add risk. July is a deliberately lighter, lower-risk stretch on my side, planned in advance for the low-liquidity summer weeks. Raising your ratio into that is adding exposure exactly as I reduce mine.
Set the ratio once, to a drawdown you can live with, and leave it. Let the edge compound at a size you will not panic out of.
https://www.mql5.com/en/signals/2307342
Your copy-ratio is a risk setting, not a reaction to the last result. It should be set to the drawdown you can sit through, not to the month you just watched. A strong month does not change what the system can lose in a bad one.
If anything, this is the wrong moment to add risk. July is a deliberately lighter, lower-risk stretch on my side, planned in advance for the low-liquidity summer weeks. Raising your ratio into that is adding exposure exactly as I reduce mine.
Set the ratio once, to a drawdown you can live with, and leave it. Let the edge compound at a size you will not panic out of.
https://www.mql5.com/en/signals/2307342
Aller Uja
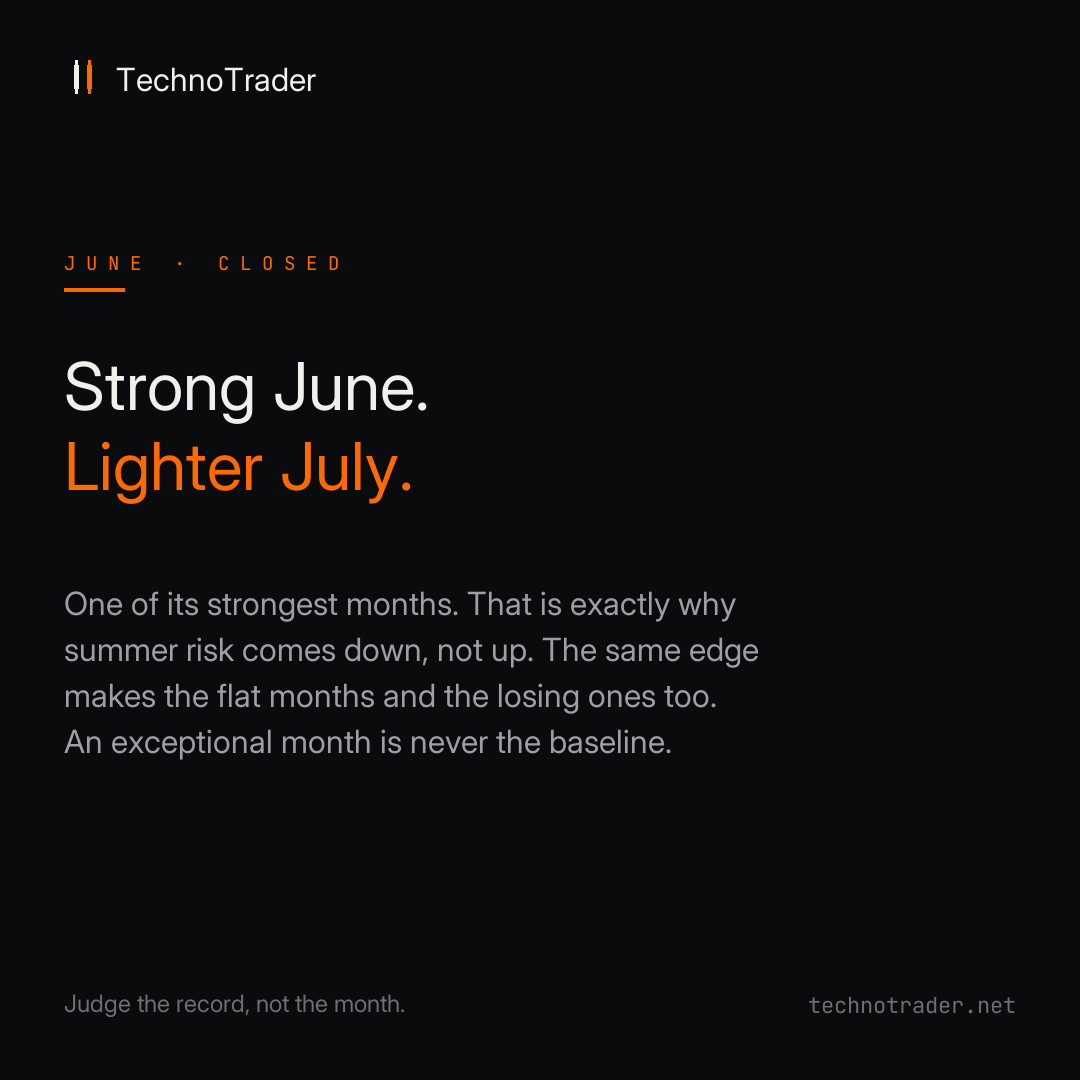
June is closed. It was one of the strongest months this signal has had, and I want to frame that honestly rather than wave it around.
A month like this is not the baseline. It is the top of the range, not the middle of it. The edge that produced it is the same modest, durable one that also produces the flat months and the losing ones. Reading an exceptional month as the new normal is how people end up over-committing right before things return to average.
So here is the plan, stated before July rather than after. Through the quieter summer weeks, when a large share of the market is away and liquidity thins out, we reduce risk. Exposure comes down, the rules stay exactly the same. A slower July is deliberate, not the system breaking.
The full June numbers, every trade, are on the page. Judge the record across months and years, not the height of any single one.
https://www.mql5.com/en/signals/2307342
A month like this is not the baseline. It is the top of the range, not the middle of it. The edge that produced it is the same modest, durable one that also produces the flat months and the losing ones. Reading an exceptional month as the new normal is how people end up over-committing right before things return to average.
So here is the plan, stated before July rather than after. Through the quieter summer weeks, when a large share of the market is away and liquidity thins out, we reduce risk. Exposure comes down, the rules stay exactly the same. A slower July is deliberate, not the system breaking.
The full June numbers, every trade, are on the page. Judge the record across months and years, not the height of any single one.
https://www.mql5.com/en/signals/2307342
Aller Uja
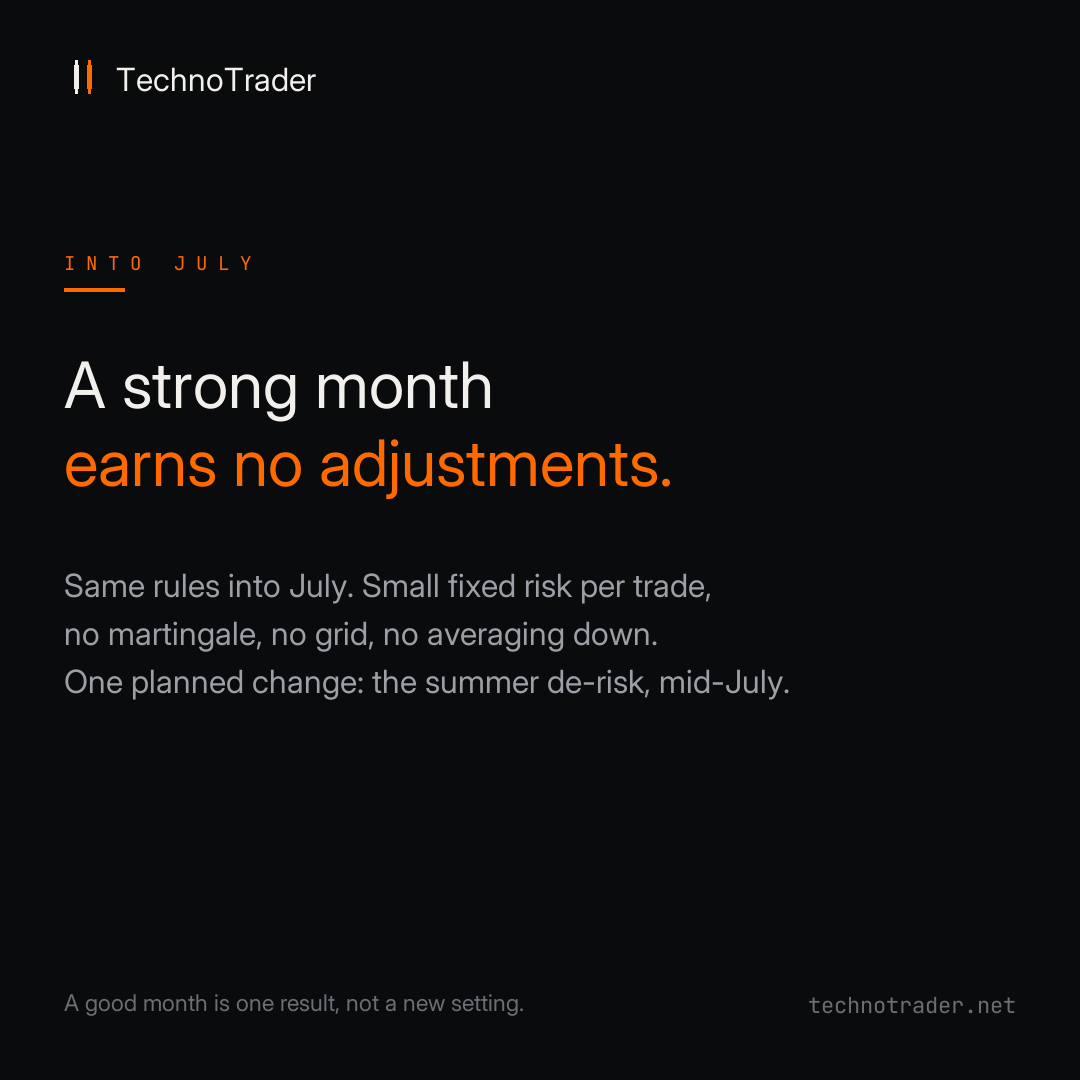
June closes today. Here is what changes on this signal going into July: nothing.
It was a strong month, stronger than usual. That earns the system no adjustment, the same way a weak month would not. The rules going into July are the rules that ran in June: small fixed risk per trade, no martingale, no grid, no averaging into losers. A good month is one result from a long run, not a new setting.
One item is on the calendar. In the second half of July into early August I will deliberately reduce risk on this signal, as I flagged on the 17th. It is a known low-liquidity window when a large share of participants are away. The rules stay the same, the exposure comes down. If activity looks quieter then, that is the plan, not the system failing.
Everything else holds. Full live record on the page: https://www.mql5.com/en/signals/2307342
It was a strong month, stronger than usual. That earns the system no adjustment, the same way a weak month would not. The rules going into July are the rules that ran in June: small fixed risk per trade, no martingale, no grid, no averaging into losers. A good month is one result from a long run, not a new setting.
One item is on the calendar. In the second half of July into early August I will deliberately reduce risk on this signal, as I flagged on the 17th. It is a known low-liquidity window when a large share of participants are away. The rules stay the same, the exposure comes down. If activity looks quieter then, that is the plan, not the system failing.
Everything else holds. Full live record on the page: https://www.mql5.com/en/signals/2307342
Aller Uja
A question I get is what happens when a market goes quiet. Gold can chop sideways for weeks. An index can grind in a range. If a signal lived on one market, those stretches would be dead time, or worse, forced trades in bad conditions.
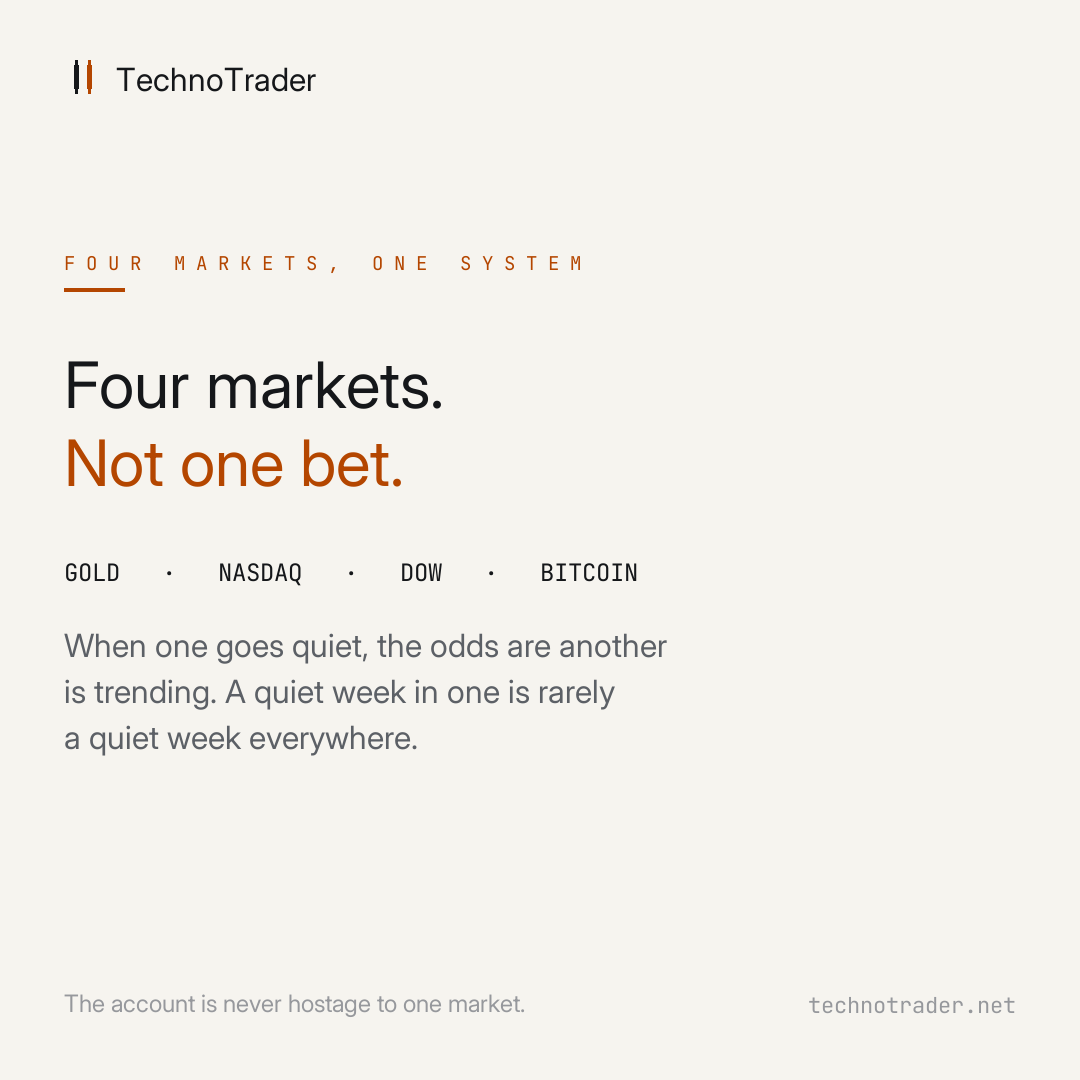
This one does not live on one market. It runs the same rules across four that do not move in lockstep: gold, two stock indices, and bitcoin. When one is flat and producing nothing, the odds are decent that another is trending and the rules are finding their trades there.
It is not about predicting which market will move. We never try. It is about always having exposure to more than one, so a quiet week in one place is rarely a quiet week everywhere, and the account is not hostage to a single market's mood.
That spread is also why the ride is a little smoother than any one of those markets alone would give you. Four streams that do not rise and fall together wobble less added up than any single one.
https://www.mql5.com/en/signals/2307342
This one does not live on one market. It runs the same rules across four that do not move in lockstep: gold, two stock indices, and bitcoin. When one is flat and producing nothing, the odds are decent that another is trending and the rules are finding their trades there.
It is not about predicting which market will move. We never try. It is about always having exposure to more than one, so a quiet week in one place is rarely a quiet week everywhere, and the account is not hostage to a single market's mood.
That spread is also why the ride is a little smoother than any one of those markets alone would give you. Four streams that do not rise and fall together wobble less added up than any single one.
https://www.mql5.com/en/signals/2307342
Aller Uja
For the past week I have been telling people to ask any signal three questions before subscribing. It is only fair I answer them for my own.
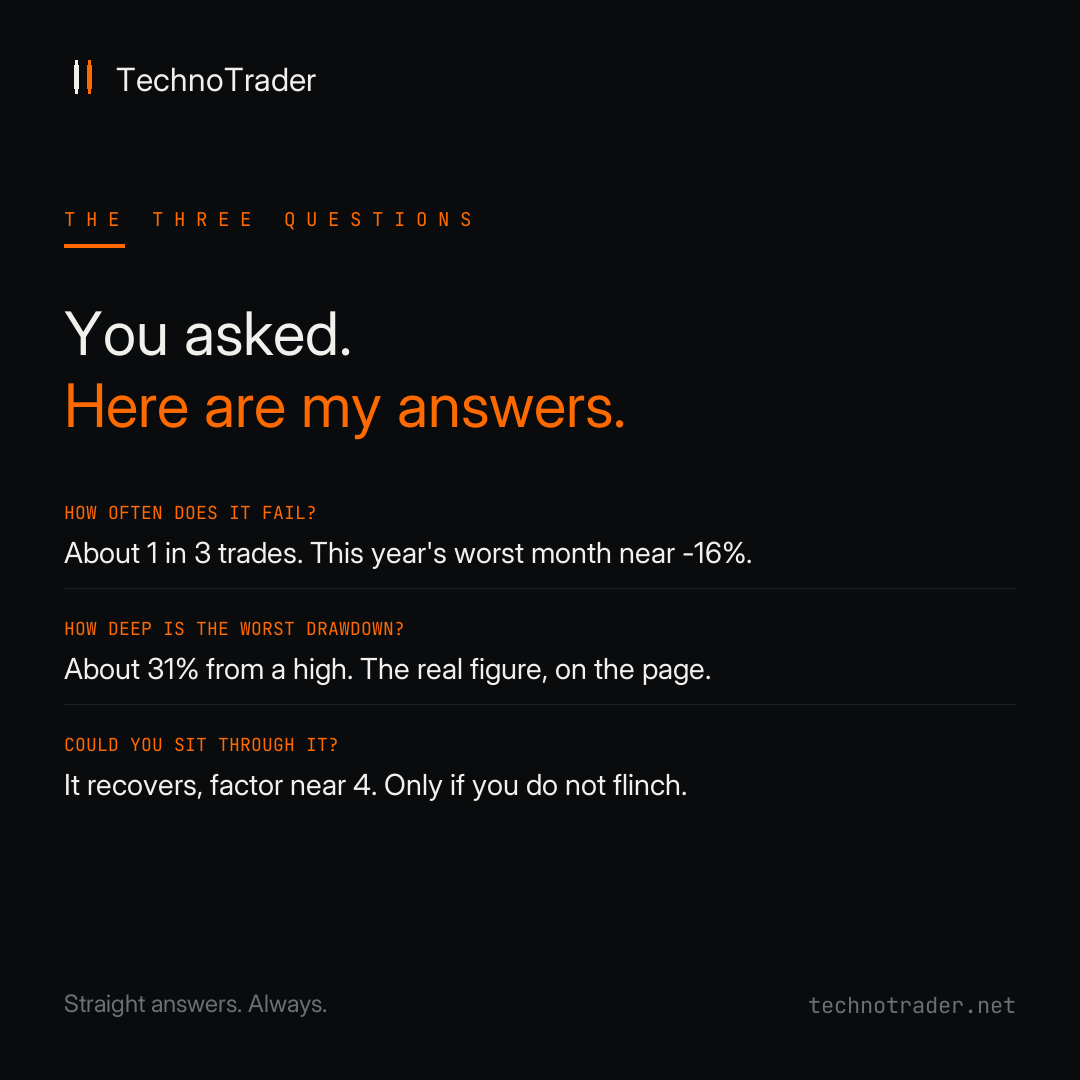
How often does it fail? About one trade in three closes at a loss. Losing months happen too. This year's worst was around 16% down, in April. That is on the page, not hidden.
How deep is the worst drawdown? About 31% from a high, the deepest the account has fallen before recovering. If a third of your balance disappearing on paper would break you, this is not the right signal for you, and that is fine.
Could you sit through it? The recovery factor sits near 4, which means it has always climbed back so far. But "so far" is doing real work in that sentence. The number only helps you if you can watch the drawdown happen and not close everything at the bottom.
The point is not that my answers are flawless. It is that I will give them to you straight, with the real figures, and so should anyone you hand your capital to.
https://www.mql5.com/en/signals/2307342
How often does it fail? About one trade in three closes at a loss. Losing months happen too. This year's worst was around 16% down, in April. That is on the page, not hidden.
How deep is the worst drawdown? About 31% from a high, the deepest the account has fallen before recovering. If a third of your balance disappearing on paper would break you, this is not the right signal for you, and that is fine.
Could you sit through it? The recovery factor sits near 4, which means it has always climbed back so far. But "so far" is doing real work in that sentence. The number only helps you if you can watch the drawdown happen and not close everything at the bottom.
The point is not that my answers are flawless. It is that I will give them to you straight, with the real figures, and so should anyone you hand your capital to.
https://www.mql5.com/en/signals/2307342
Aller Uja
This has been a strong month on the signal. Stronger than usual. So here is the same note I would give you after a bad one, just pointed the other way.
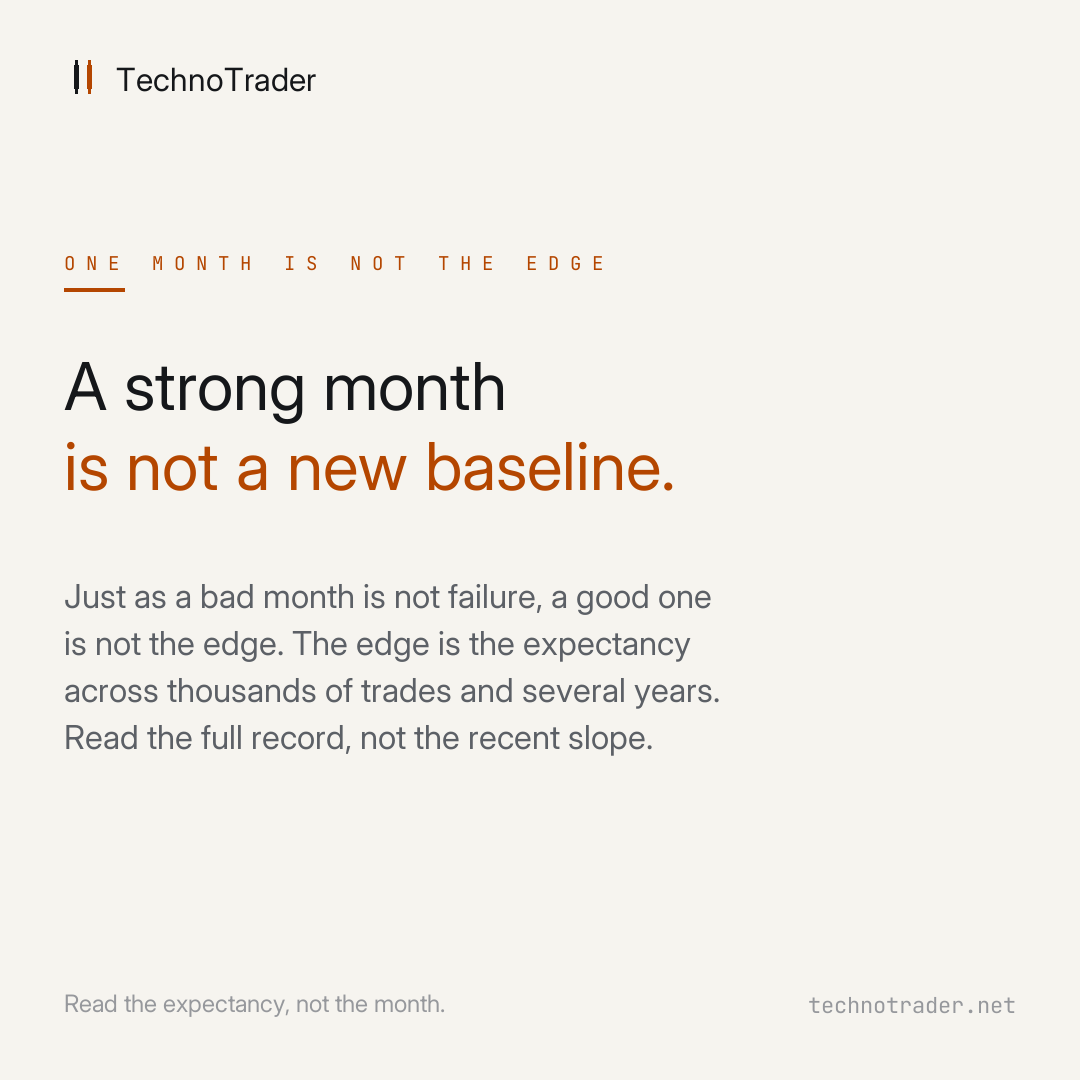
One month is not the edge. A good one is not a new baseline any more than a bad one is a verdict. Both are single results pulled from a long run. The number that actually describes this system is its expectancy, the average it earns from its edge repeated across thousands of trades and several years. That is the figure to anchor on.
If you size your account to a month like this and expect it to continue, the first ordinary stretch will feel like something broke. Nothing will have broken. The strong weeks and the flat weeks are both part of the same expectancy. Read the full record, not the recent slope.
I would rather you stay calibrated in a good month than get excited and over-commit right before the average pulls things back toward normal. The edge is real. It just does not arrive in a straight line.
https://www.mql5.com/en/signals/2307342
One month is not the edge. A good one is not a new baseline any more than a bad one is a verdict. Both are single results pulled from a long run. The number that actually describes this system is its expectancy, the average it earns from its edge repeated across thousands of trades and several years. That is the figure to anchor on.
If you size your account to a month like this and expect it to continue, the first ordinary stretch will feel like something broke. Nothing will have broken. The strong weeks and the flat weeks are both part of the same expectancy. Read the full record, not the recent slope.
I would rather you stay calibrated in a good month than get excited and over-commit right before the average pulls things back toward normal. The edge is real. It just does not arrive in a straight line.
https://www.mql5.com/en/signals/2307342
Aller Uja
📢 New signal: Techno Composite is live
A new signal went public today, and you are seeing it from its very first trade.
Techno Composite is a multi-strategy portfolio that trades gold, forex and the NAS100 index from one account. It is fully automated, runs on a real account, and places a stop loss on every position. No martingale, no grid, no averaging down. The same rules as everything else I run, in one combined portfolio.
Here is the part that matters. Most signals appear only after a quiet private period, once the early curve already looks good. This one is public from trade number one. You will see the first drawdown as it happens, not a clean history that skips over it. There is no track record to show yet, and that is deliberate.
So judge it the way I ask you to judge any system. Not by the first green week, but over a real sample, by how often it fails and how deep the drawdown runs. Today there is nothing to show. Ask me again in a few hundred trades.
It opens deliberately cautious. Small position sizes and a pre-set drawdown limit that pulls risk back if the early going is rough. Risk scales up only as the live combination proves itself. Early caution over early returns.
Operational notes for anyone considering it:
- Platform: MetaTrader 5, real account
- Starting balance: 1,000 EUR
- Leverage: 1:500
- Minimum to copy: around 600 EUR, with 1,000 EUR or more recommended so the index and gold positions size correctly
- Subscription: 30 USD per month
I would rather you start watching it now, with nothing to show, than meet it later as a finished curve. Follow it from the bottom up.
https://www.mql5.com/en/signals/2379456
A new signal went public today, and you are seeing it from its very first trade.
Techno Composite is a multi-strategy portfolio that trades gold, forex and the NAS100 index from one account. It is fully automated, runs on a real account, and places a stop loss on every position. No martingale, no grid, no averaging down. The same rules as everything else I run, in one combined portfolio.
Here is the part that matters. Most signals appear only after a quiet private period, once the early curve already looks good. This one is public from trade number one. You will see the first drawdown as it happens, not a clean history that skips over it. There is no track record to show yet, and that is deliberate.
So judge it the way I ask you to judge any system. Not by the first green week, but over a real sample, by how often it fails and how deep the drawdown runs. Today there is nothing to show. Ask me again in a few hundred trades.
It opens deliberately cautious. Small position sizes and a pre-set drawdown limit that pulls risk back if the early going is rough. Risk scales up only as the live combination proves itself. Early caution over early returns.
Operational notes for anyone considering it:
- Platform: MetaTrader 5, real account
- Starting balance: 1,000 EUR
- Leverage: 1:500
- Minimum to copy: around 600 EUR, with 1,000 EUR or more recommended so the index and gold positions size correctly
- Subscription: 30 USD per month
I would rather you start watching it now, with nothing to show, than meet it later as a finished curve. Follow it from the bottom up.
https://www.mql5.com/en/signals/2379456
Aller Uja
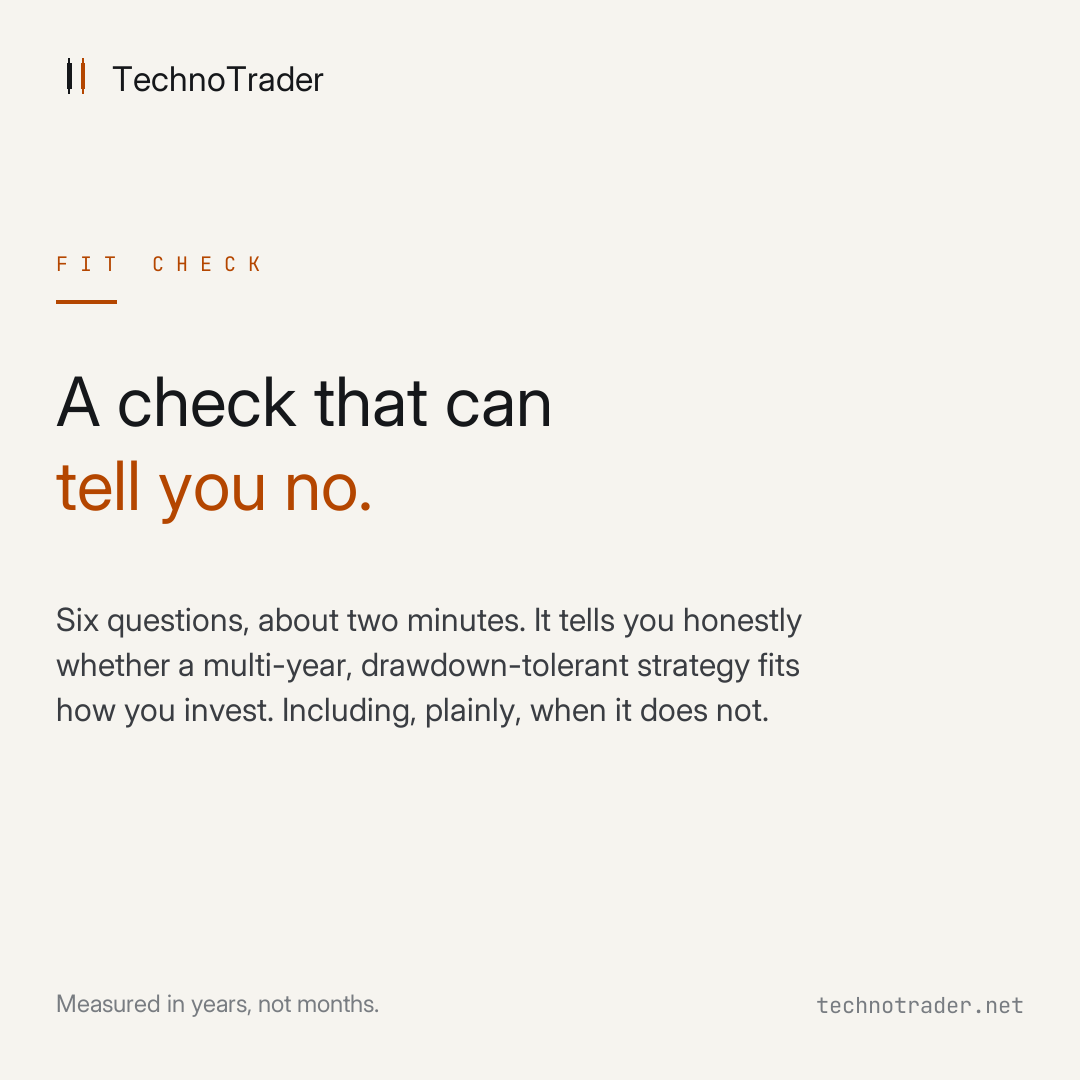
Before you subscribe, there is now a way to find out if this is not for you.
Most people who leave a systematic signal during a drawdown were not the wrong kind of investor. They were the right kind, given the wrong expectation before they started. A normal losing month felt like a broken system, because nobody had shown them what a normal losing month looks like here.
So before the subscribe button, there is now a short fit check. Six questions, about two minutes. It asks how you actually behave when an account you copy has its worst month on record and you are sitting below where you started, what time horizon you measure in, and whether this is money you can leave untouched for years.
It returns one of four honest answers: this fits how you invest, you are close but read this first, the timing is wrong for your capital right now, or plainly, this is probably not for you. That last answer is not a flaw in the tool. It is the point. I would rather you spend two minutes and decide this is not for you than subscribe and leave in the first drawdown.
The worst month and the full drawdown are stated up front, before any decision, and no signup is required to see your result.
Take the fit check: https://technotrader.net/insights/fit-check/
The signal: https://www.mql5.com/en/signals/2307342
Most people who leave a systematic signal during a drawdown were not the wrong kind of investor. They were the right kind, given the wrong expectation before they started. A normal losing month felt like a broken system, because nobody had shown them what a normal losing month looks like here.
So before the subscribe button, there is now a short fit check. Six questions, about two minutes. It asks how you actually behave when an account you copy has its worst month on record and you are sitting below where you started, what time horizon you measure in, and whether this is money you can leave untouched for years.
It returns one of four honest answers: this fits how you invest, you are close but read this first, the timing is wrong for your capital right now, or plainly, this is probably not for you. That last answer is not a flaw in the tool. It is the point. I would rather you spend two minutes and decide this is not for you than subscribe and leave in the first drawdown.
The worst month and the full drawdown are stated up front, before any decision, and no signup is required to see your result.
Take the fit check: https://technotrader.net/insights/fit-check/
The signal: https://www.mql5.com/en/signals/2307342
Aller Uja
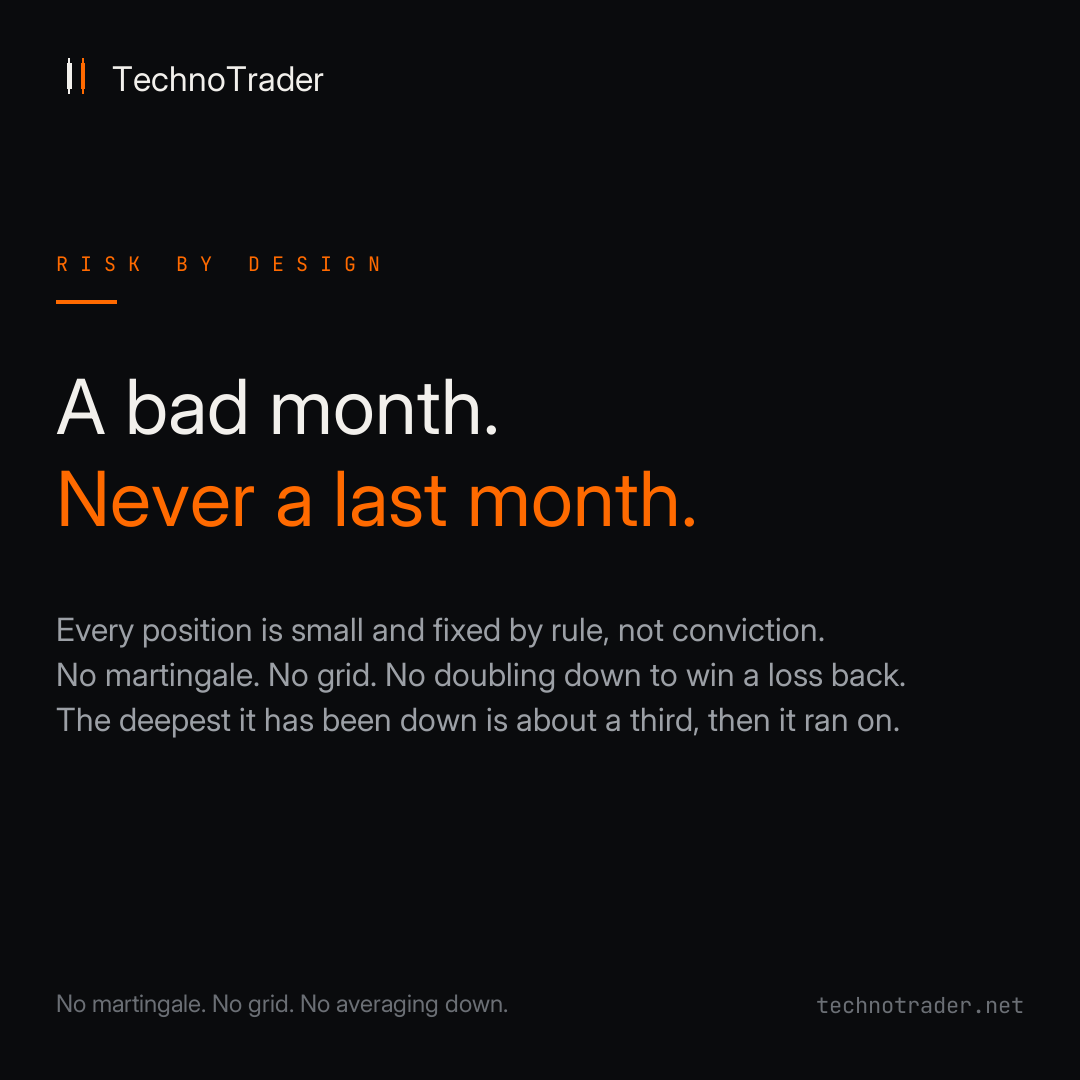
There is no single trade on this signal that can do real damage. Every position is small relative to the account, and its size is set by rule, not by conviction.
The system never doubles down to win a loss back. No martingale, no grid, no averaging into a loser. That one discipline is what separates a system that can have a bad month from one that can have a last month.
So when a hard stretch comes, it shows up as a drawdown you could have measured in advance, not as the account going to zero overnight. The deepest this signal has been down is about a third, and it kept running the same rules the next day.
That is the trade-off, stated plainly. You accept a drawdown you can see coming. In return, you remove the one risk that ends accounts for good.
https://www.mql5.com/en/signals/2307342
The system never doubles down to win a loss back. No martingale, no grid, no averaging into a loser. That one discipline is what separates a system that can have a bad month from one that can have a last month.
So when a hard stretch comes, it shows up as a drawdown you could have measured in advance, not as the account going to zero overnight. The deepest this signal has been down is about a third, and it kept running the same rules the next day.
That is the trade-off, stated plainly. You accept a drawdown you can see coming. In return, you remove the one risk that ends accounts for good.
https://www.mql5.com/en/signals/2307342
Aller Uja
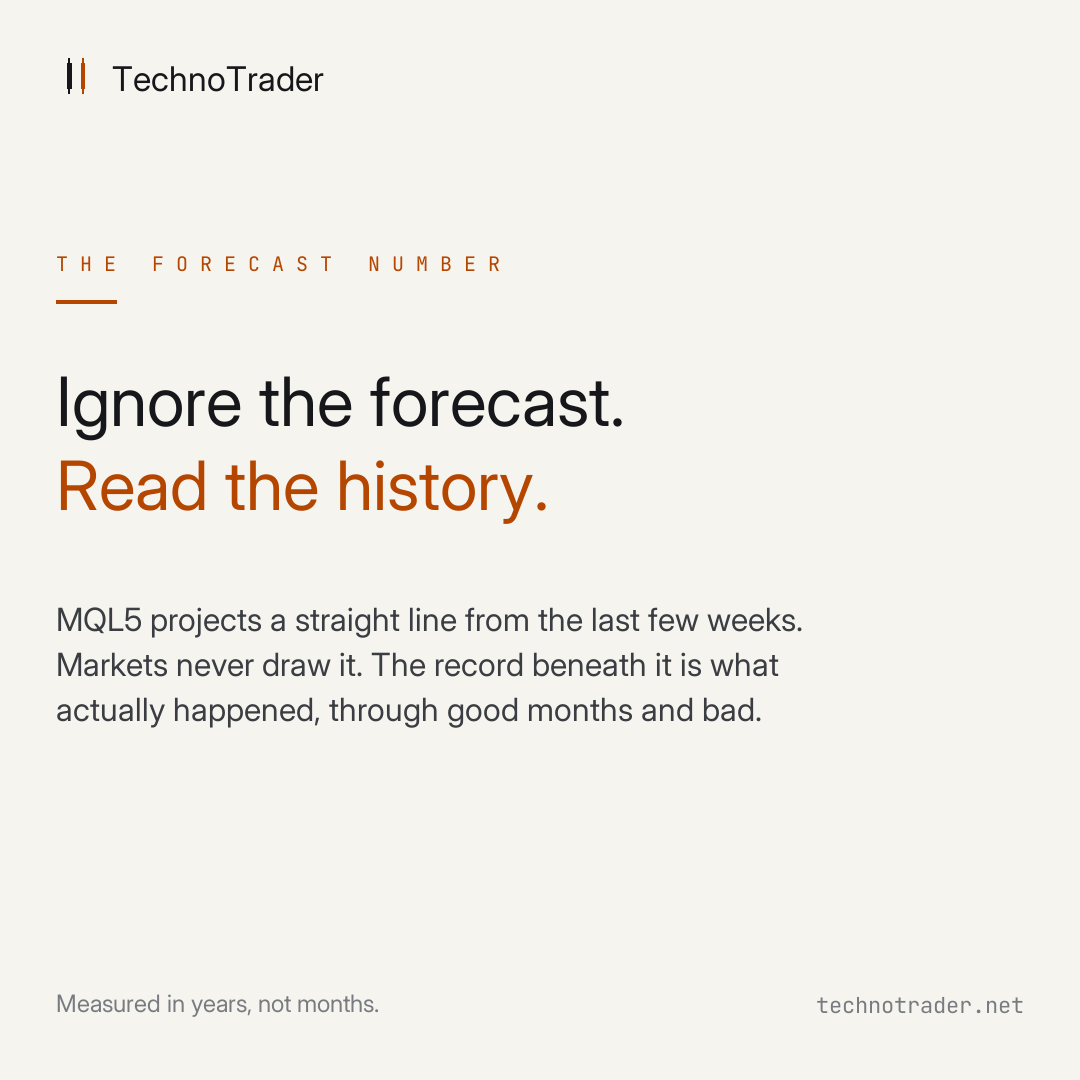
Your signal page shows a forecast: a projected annual return. The most useful thing I can tell you about that number is to ignore it.
MQL5 generates it automatically by extrapolating recent performance forward. It is not my target, not a promise, and not something the system aims at. A strong month pushes it up, a weak month drags it down, and neither tells you anything about the next twelve.
We do not forecast. The system follows its rules and takes what the market gives. A projection drawn from the last few weeks is exactly the kind of headline number that sets the wrong expectation, which is what this month's primer is about.
What is worth reading sits lower on the page: how long the record is, the worst drawdown, the recovery factor, the profit factor. Those describe what the system has actually done, through good months and bad. The forecast describes a straight line that markets never draw.
Read the history. Ignore the projection.
https://www.mql5.com/en/signals/2307342
MQL5 generates it automatically by extrapolating recent performance forward. It is not my target, not a promise, and not something the system aims at. A strong month pushes it up, a weak month drags it down, and neither tells you anything about the next twelve.
We do not forecast. The system follows its rules and takes what the market gives. A projection drawn from the last few weeks is exactly the kind of headline number that sets the wrong expectation, which is what this month's primer is about.
What is worth reading sits lower on the page: how long the record is, the worst drawdown, the recovery factor, the profit factor. Those describe what the system has actually done, through good months and bad. The forecast describes a straight line that markets never draw.
Read the history. Ignore the projection.
https://www.mql5.com/en/signals/2307342
Aller Uja
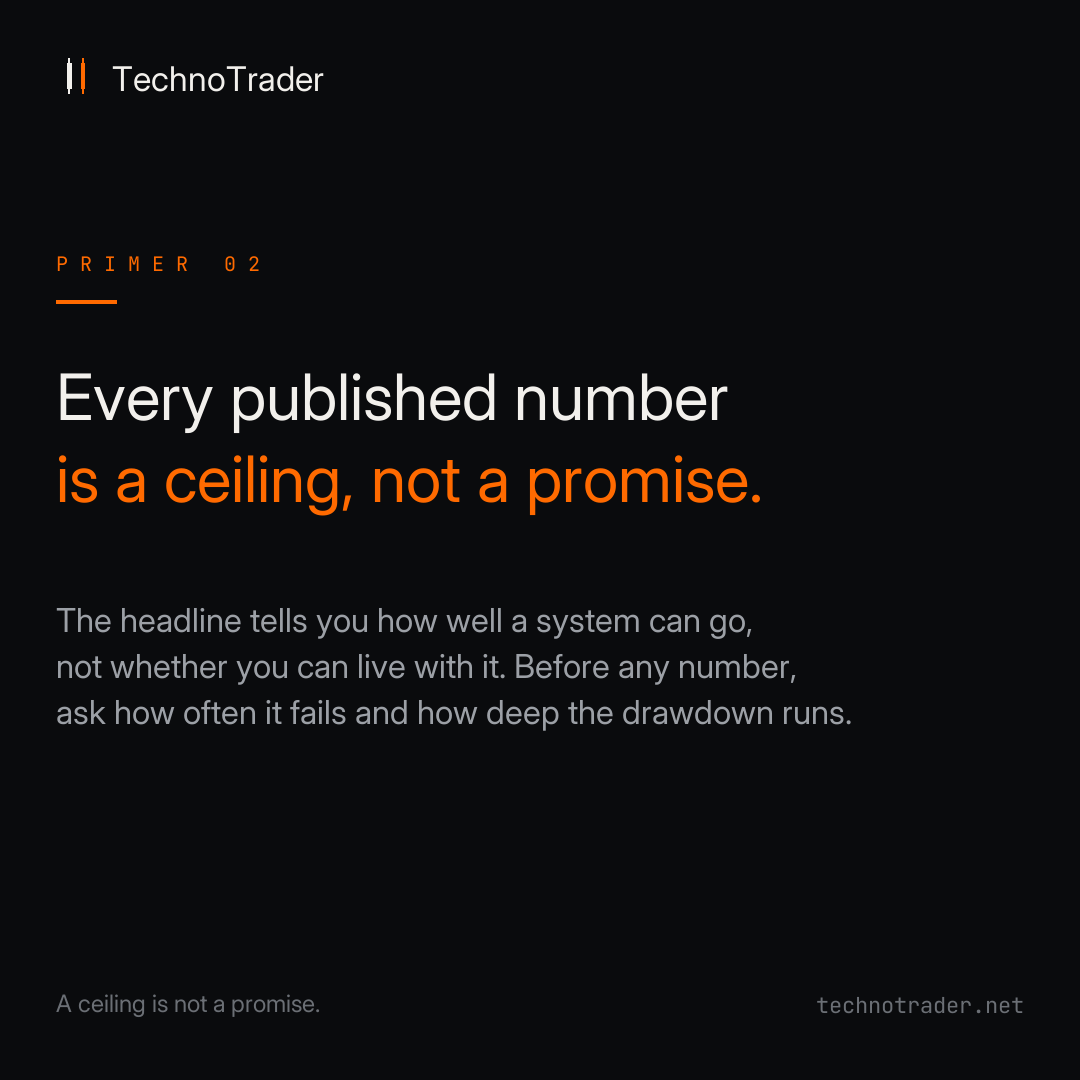
Our second investor-education primer went live today. It is the one I would read before judging any signal page, including this one.
It starts with a number from a well-known trading reference: a chart pattern that returns, on average, +69%. A real, carefully measured figure. The primer shows what it actually is. The average of 253 perfect trades, bought at the exact breakout and sold at the exact top, with no costs. A number that looks like a promise and is really a ceiling. No one earns it in practice.
The same holds for every published result, including the ones on this page. A headline figure tells you how well a system can go. It does not tell you whether you can live with it.
So before subscribing to any signal, ask three questions instead of one:
1. How often does it fail?
2. How deep is the worst drawdown you would have to sit through?
3. Could you stay calm the whole way through it?
On an honest signal page the numbers that answer those are right there. On this one they are live and third-party verified, drawdown included. Read them before the growth figure, not after.
Full primer, free (about 6 minutes): https://technotradernet.substack.com/p/primer-02-the-number-youll-never
The 4-minute video version: https://youtu.be/Nj6NX1C3Ie0
It starts with a number from a well-known trading reference: a chart pattern that returns, on average, +69%. A real, carefully measured figure. The primer shows what it actually is. The average of 253 perfect trades, bought at the exact breakout and sold at the exact top, with no costs. A number that looks like a promise and is really a ceiling. No one earns it in practice.
The same holds for every published result, including the ones on this page. A headline figure tells you how well a system can go. It does not tell you whether you can live with it.
So before subscribing to any signal, ask three questions instead of one:
1. How often does it fail?
2. How deep is the worst drawdown you would have to sit through?
3. Could you stay calm the whole way through it?
On an honest signal page the numbers that answer those are right there. On this one they are live and third-party verified, drawdown included. Read them before the growth figure, not after.
Full primer, free (about 6 minutes): https://technotradernet.substack.com/p/primer-02-the-number-youll-never
The 4-minute video version: https://youtu.be/Nj6NX1C3Ie0
Aller Uja
About two out of every three trades on this signal close in profit. A win rate near 68 percent. It is the number people find most reassuring, and the one we pay the least attention to.
Here is the uncomfortable part. A win rate is easy to inflate. You can push it higher by holding losing trades and hoping they come back, and by closing winners early to lock the green in. Both make the percentage look better and the account worse.
We run the system the other way. Losers are cut while they are small. Winners are given room. That choice costs us some win rate on paper, and it is the entire reason the profit factor holds.
So a high win rate is nice to see, but it is not the goal. A win rate you did not have to protect by hiding losses is worth far more than a prettier one that was.
The full statistics, win rate included: https://www.mql5.com/en/signals/2307342
Here is the uncomfortable part. A win rate is easy to inflate. You can push it higher by holding losing trades and hoping they come back, and by closing winners early to lock the green in. Both make the percentage look better and the account worse.
We run the system the other way. Losers are cut while they are small. Winners are given room. That choice costs us some win rate on paper, and it is the entire reason the profit factor holds.
So a high win rate is nice to see, but it is not the goal. A win rate you did not have to protect by hiding losses is worth far more than a prettier one that was.
The full statistics, win rate included: https://www.mql5.com/en/signals/2307342
Aller Uja
Profit factor is the least flashy number on a signal page, and one of the most honest.
It is a single ratio. Everything the system has ever made, divided by everything it has ever lost. On this signal it sits at about 1.27. For every euro the system has lost, it has taken about 1.27 out of the market.
That is a thin margin, and it is supposed to be. A real edge in deep, competitive markets is thin. The gap between winners and losers stays small no matter how good a system is.
What a steady 1.27 actually means: the wins outweigh the losses, modestly and reliably, with no single result carrying the whole.
It will never be the number that makes someone screenshot a signal page. A quiet, unremarkable ratio that holds across years is the more durable kind of evidence.
Profit factor and the full statistics: https://www.mql5.com/en/signals/2307342
It is a single ratio. Everything the system has ever made, divided by everything it has ever lost. On this signal it sits at about 1.27. For every euro the system has lost, it has taken about 1.27 out of the market.
That is a thin margin, and it is supposed to be. A real edge in deep, competitive markets is thin. The gap between winners and losers stays small no matter how good a system is.
What a steady 1.27 actually means: the wins outweigh the losses, modestly and reliably, with no single result carrying the whole.
It will never be the number that makes someone screenshot a signal page. A quiet, unremarkable ratio that holds across years is the more durable kind of evidence.
Profit factor and the full statistics: https://www.mql5.com/en/signals/2307342
Aller Uja
If you copy this signal, your account will not match the page exactly. That is normal, and here is why.
The numbers on the page come from one account, the master. When you copy, your trades are placed on your own broker, at your own moment, at your own spread. So your fills differ from the master's by small amounts, a few points here and there on entries and exits.
On a single trade that difference is tiny. Across a long record those small differences accumulate into a steady gap between your account and the master. Usually a little behind, occasionally ahead.
This is true of every copy-trading signal, whether the provider mentions it or not. Better to say it plainly. Your account will track the system closely. It will not be identical to the page.
What widens that gap is mostly in your hands. A tighter broker, lower spreads, a stable connection. The rules are identical for every subscriber. The fills are yours.
Full record and broker notes: https://www.mql5.com/en/signals/2307342
The numbers on the page come from one account, the master. When you copy, your trades are placed on your own broker, at your own moment, at your own spread. So your fills differ from the master's by small amounts, a few points here and there on entries and exits.
On a single trade that difference is tiny. Across a long record those small differences accumulate into a steady gap between your account and the master. Usually a little behind, occasionally ahead.
This is true of every copy-trading signal, whether the provider mentions it or not. Better to say it plainly. Your account will track the system closely. It will not be identical to the page.
What widens that gap is mostly in your hands. A tighter broker, lower spreads, a stable connection. The rules are identical for every subscriber. The fills are yours.
Full record and broker notes: https://www.mql5.com/en/signals/2307342
Aller Uja
A quick operational note for anyone about to copy this signal.
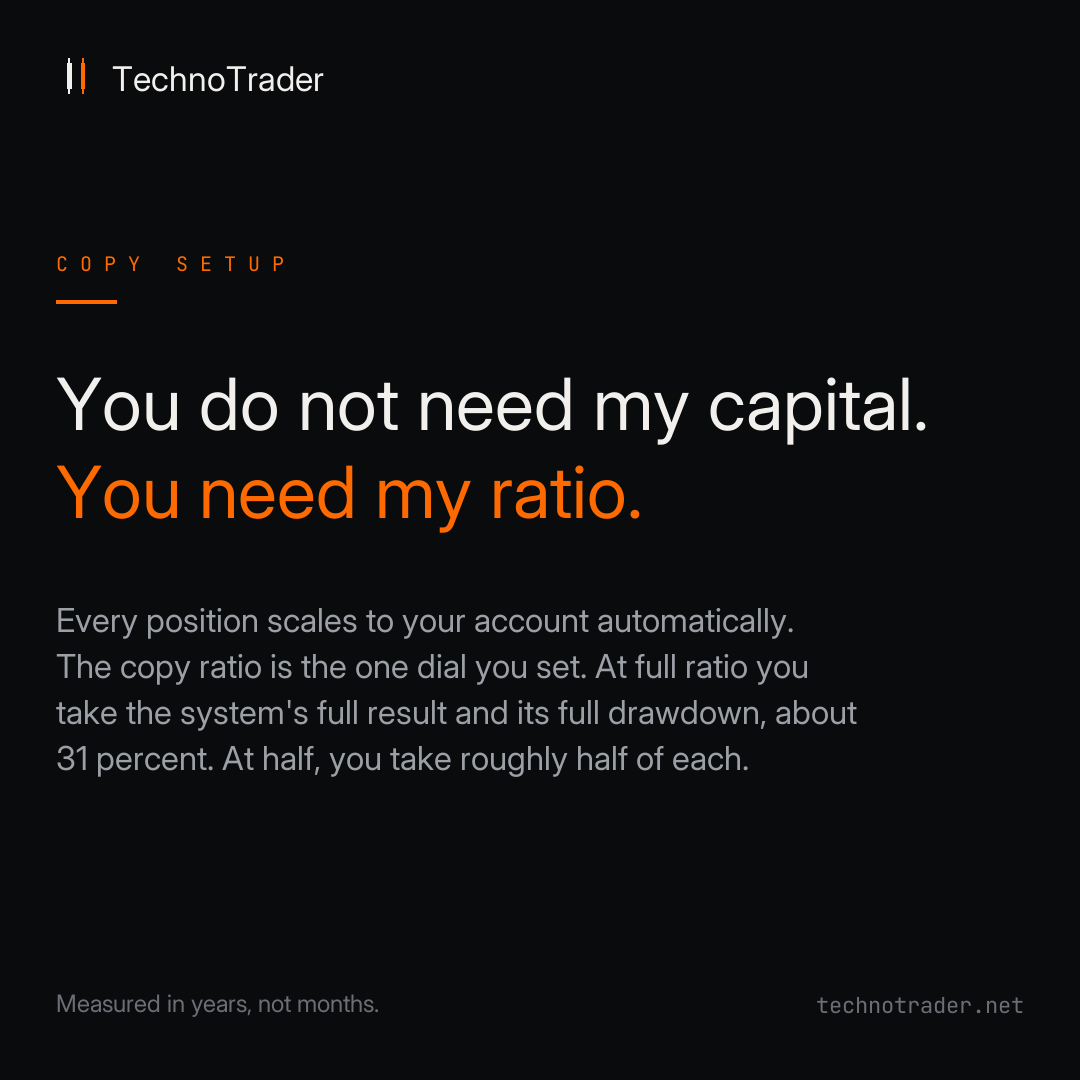
You do not need the same capital I run. When you copy, the platform scales every position to your account. If your balance is a tenth of the master account, each trade is sized to a tenth. The master account trades the same way. Your account just follows in proportion.
That removes the usual worry, account size. It leaves you with the one control that actually matters. The copy ratio.
The ratio is the dial. At full ratio you take the system's full result, including its full drawdown. The deepest so far has been about 31 percent. At half ratio you take roughly half of it. You are not changing the system. You are choosing how much of it lands on your account.
Set the dial once, with the drawdown in mind, and then leave it there.
Setup and the full record: https://www.mql5.com/en/signals/2307342
You do not need the same capital I run. When you copy, the platform scales every position to your account. If your balance is a tenth of the master account, each trade is sized to a tenth. The master account trades the same way. Your account just follows in proportion.
That removes the usual worry, account size. It leaves you with the one control that actually matters. The copy ratio.
The ratio is the dial. At full ratio you take the system's full result, including its full drawdown. The deepest so far has been about 31 percent. At half ratio you take roughly half of it. You are not changing the system. You are choosing how much of it lands on your account.
Set the dial once, with the drawdown in mind, and then leave it there.
Setup and the full record: https://www.mql5.com/en/signals/2307342
Aller Uja
A note before it happens, not after. From the second half of July into early August, we will deliberately reduce risk on this signal.
This is planned, and it is the same step we take in every low-liquidity window.
In those weeks a large share of market participants are away from their desks. Liquidity thins across the major markets and spreads widen, for reasons that have nothing to do with the system's edge. Holding full size into a thinner market means carrying more risk for the same opportunity. So we carry less.
The rules do not change. We simply run lighter for about four weeks. You may see fewer trades and smaller positions on your copied account. That is the plan running on schedule.
We are telling you now, in mid-June, so there is no surprise when activity quiets down. We will note again when the window begins and when normal risk resumes. The same applies around the year-end holidays.
Risk discipline is not something we switch on after a bad month. It is on the calendar.
Signal page: https://www.mql5.com/en/signals/2307342
This is planned, and it is the same step we take in every low-liquidity window.
In those weeks a large share of market participants are away from their desks. Liquidity thins across the major markets and spreads widen, for reasons that have nothing to do with the system's edge. Holding full size into a thinner market means carrying more risk for the same opportunity. So we carry less.
The rules do not change. We simply run lighter for about four weeks. You may see fewer trades and smaller positions on your copied account. That is the plan running on schedule.
We are telling you now, in mid-June, so there is no surprise when activity quiets down. We will note again when the window begins and when normal risk resumes. The same applies around the year-end holidays.
Risk discipline is not something we switch on after a bad month. It is on the calendar.
Signal page: https://www.mql5.com/en/signals/2307342
: