Sweet VWAP MT5
- Indikatoren
- Francisco Gomes Da Silva
- Version: 1.23
- Aktualisiert: 8 März 2024
Erfahren Sie, wo große Institutionen handeln und optimieren Sie Ihre Investitionen mit dem kostenlosen VWAP Anchor Indicator
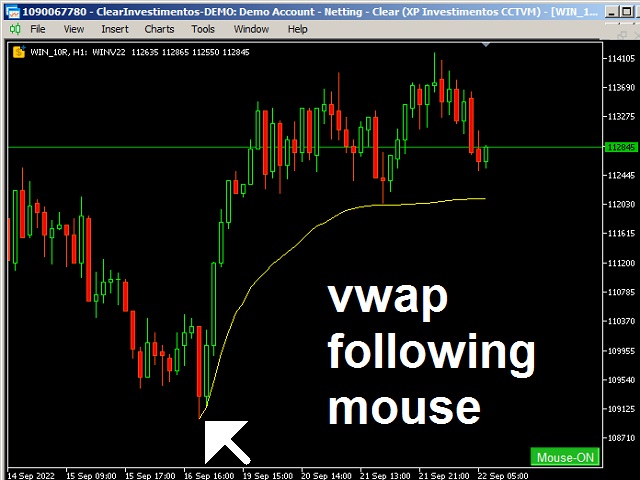
Dieser Indikator wurde für erfahrene Trader entwickelt, die sich mit VWAP-Anchor-Strategien beschäftigen. Er bietet die nötige Geschwindigkeit, um das Verhalten des VWAP von bestimmten Ankerpunkten aus mit nur dem Mauszeiger zu analysieren.
Hauptfunktionen:
-
VWAP-Ankerpunkt:
Die Hauptfunktion dieses Indikators besteht darin, zu zeigen, wie sich der VWAP verhalten würde, wenn er an einem vom Trader ausgewählten Punkt verankert wäre. Dies ermöglicht eine genauere Analyse der Marktkonditionen aus verschiedenen zeitlichen Perspektiven.
-
Kostenlose Installation:
Nach Auswahl des gewünschten Ankerpunkts können Sie den VWAP-Indikator Ihrer Wahl herunterladen und den VWAP manuell am von Ihnen gewählten Ankerpunkt mit diesem Indikator konfigurieren.
-
Bezahlte Version:
Wenn Ihnen dieser Indikator gefällt, haben Sie die Möglichkeit, meine Arbeit zu unterstützen, indem Sie die kostenpflichtige Version dieses Indikators erwerben. Die kostenpflichtige Version ermöglicht das Anheften beliebig vieler VWAPs mit nur einem Klick, wodurch Ihnen wertvolle Zeit bei der Konfiguration Ihrer Anker-VWAPs gespart wird.
Klicken Sie hier, um die kostenpflichtige Version des klickbaren VWAP Anchor Indicators herunterzuladen.
Auswahl der besten Ankerpunkte:
-
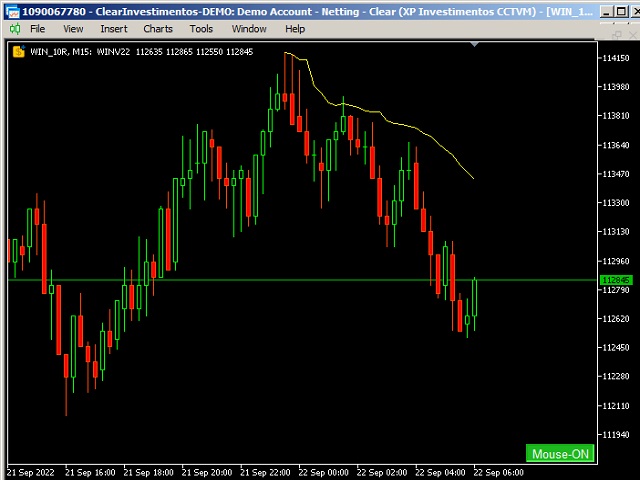
Normalerweise sind die besten Ankerpunkte die Hochs und Tiefs des Charts, da sie wichtige Widerstands- und Unterstützungsniveaus darstellen. Um diesen Ansatz zu erleichtern, bietet VWAP Anchor Funktionen namens "Magnetic: High or Low".
-
Wenn Sie sich einem Hoch oder Tief mit dem Mauszeiger nähern, basiert die Berechnung automatisch auf dem höchsten (high) oder niedrigsten (low) Preis, abhängig davon, was näher liegt. Dies hilft den Tradern, effektive Ankerpunkte auszuwählen, bereits mit der richtigen Preisberechnung.
Anwendung in allen Märkten:
-
Dieser Indikator kann auf allen Finanzmärkten angewendet werden und bietet Händlern, die mit Aktien, Währungen, Rohstoffen oder anderen Vermögenswerten handeln, Flexibilität. Seine Vielseitigkeit macht ihn zu einem wertvollen Werkzeug in verschiedenen Handelsszenarien.
-
Die Berechnung des Anker-VWAP basiert hauptsächlich auf dem realen Volumen und bietet somit eine genauere Darstellung des Marktverhaltens im Vergleich zum Standard-VWAP.
Zusammenfassend ist der VWAP Anchor Indicator ein leistungsstarkes Werkzeug für Trader, die verschiedene Ankerpunkte für den VWAP erkunden und fundierte Kauf- und Verkaufsentscheidungen auf Grundlage dieser Analysen treffen möchten. Sowohl die kostenlose als auch die kostenpflichtige Version bieten erhebliche Vorteile, abhängig von den individuellen Anforderungen jedes Traders.
Folgen Sie mir, um meine anderen kostenlosen Indikatoren kennenzulernen und über meine Veröffentlichungen auf dem Laufenden zu bleiben.
- Version für MT4: VWAP Anchor für MT4
- Meine anderen kostenlosen Indikatoren: Alle Indikatoren herunterladen


Good