BarEndTime by MMD MT5
- Indikatoren
- Mariusz Maciej Drozdowski
- Version: 1.0
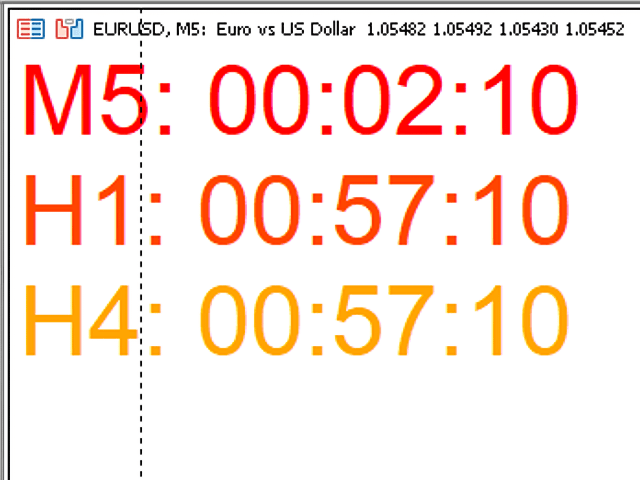
Der Zeit-Ende-Balken von MMD ist ein einfacher Indikator, der die verbleibenden Sekunden in den drei ausgewählten Intervallen anzeigt.
Gemäß der MMD-Methodik ist der Moment wichtig, in dem eine direktionale Preisbewegung auftritt. Dieser Indikator ermöglicht es Ihnen, diese Beziehung beim Forex- und Futures-Handel effektiver zu nutzen.
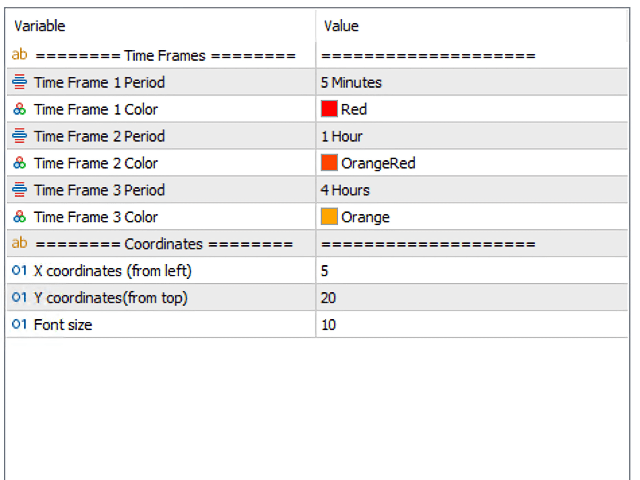
Beschreibung der Funktionalität:
Zeitrahmen 1 Periode - Definieren des ersten Zeitintervalls
Zeitrahmen 1 Farbe – Angabe der Farbe für das erste Zeitintervall
Time Frame 1 Period – definiert das zweite Zeitintervall
Zeitrahmen 1 Farbe – Angabe der Farbe für das zweite Zeitintervall
Time Frame 1 Period – definiert das dritte Zeitintervall
Zeitrahmen 1 Farbe – Angabe der Farbe für das dritte Zeitintervall
Position der angezeigten Daten auf dem Diagramm:
X-Koordinaten - die Anzahl der Punkte von der linken Seite des Diagramms
Y-Koordinaten – die Anzahl der Punkte vom oberen Rand des Diagramms
Schriftgröße - Schriftgröße