BarEndTime by MMD MT5
- Indicatori
- Mariusz Maciej Drozdowski
- Versione: 1.0
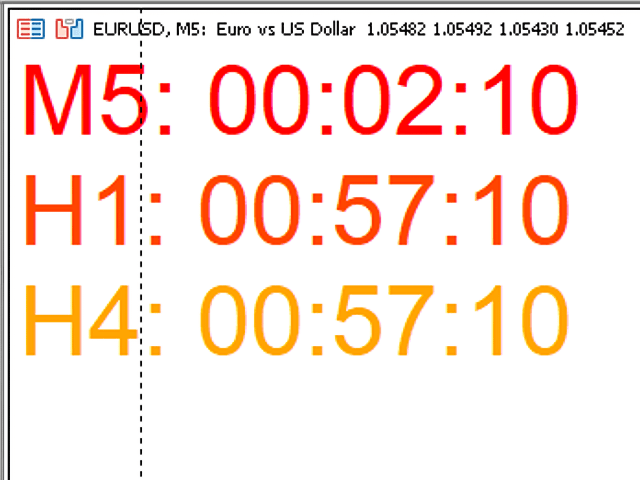
La barra Time End di MMD è un semplice indicatore che mostra il numero di secondi rimanenti nei tre intervalli selezionati.
Secondo la metodologia MMD, il momento in cui si verifica un movimento di prezzo direzionale è importante. Questo indicatore ti consente di utilizzare questa relazione in modo più efficace nel trading Forex e Futures.
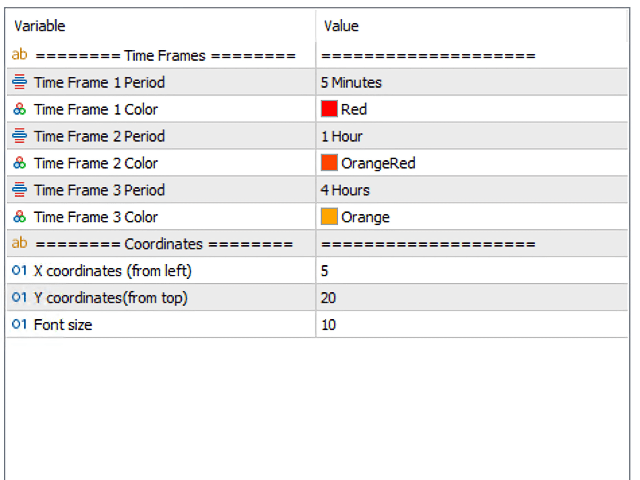
Descrizione della funzionalità:
Time Frame 1 Period - definizione del primo intervallo di tempo
Time Frame 1 Color - specificare il colore per il primo intervallo di tempo
Time Frame 1 Period - definisce il secondo intervallo di tempo
Time Frame 1 Color - specificare il colore per il secondo intervallo di tempo
Time Frame 1 Period - definisce il terzo intervallo di tempo
Time Frame 1 Color - specificare il colore per il terzo intervallo di tempo
Posizione dei dati visualizzati sul grafico:
Coordinate X: il numero di punti dal lato sinistro del grafico
Coordinate Y: il numero di punti dalla parte superiore del grafico
Dimensione del carattere - dimensione del carattere