Supports And Resistances Lines
- Indikatoren
- Francisco Gomes Da Silva
- Version: 1.27
- Aktualisiert: 22 Juni 2024
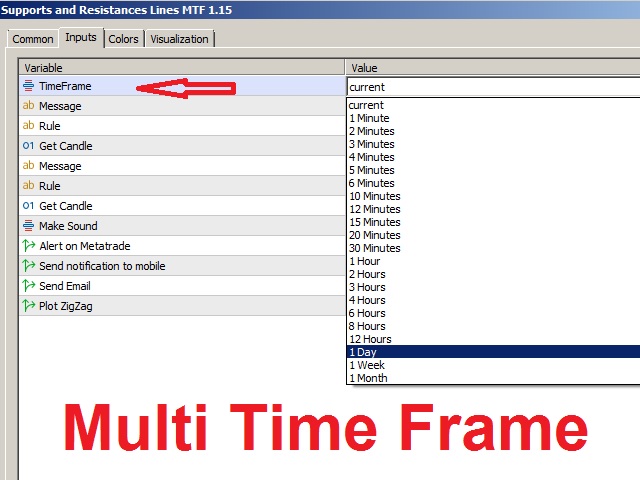
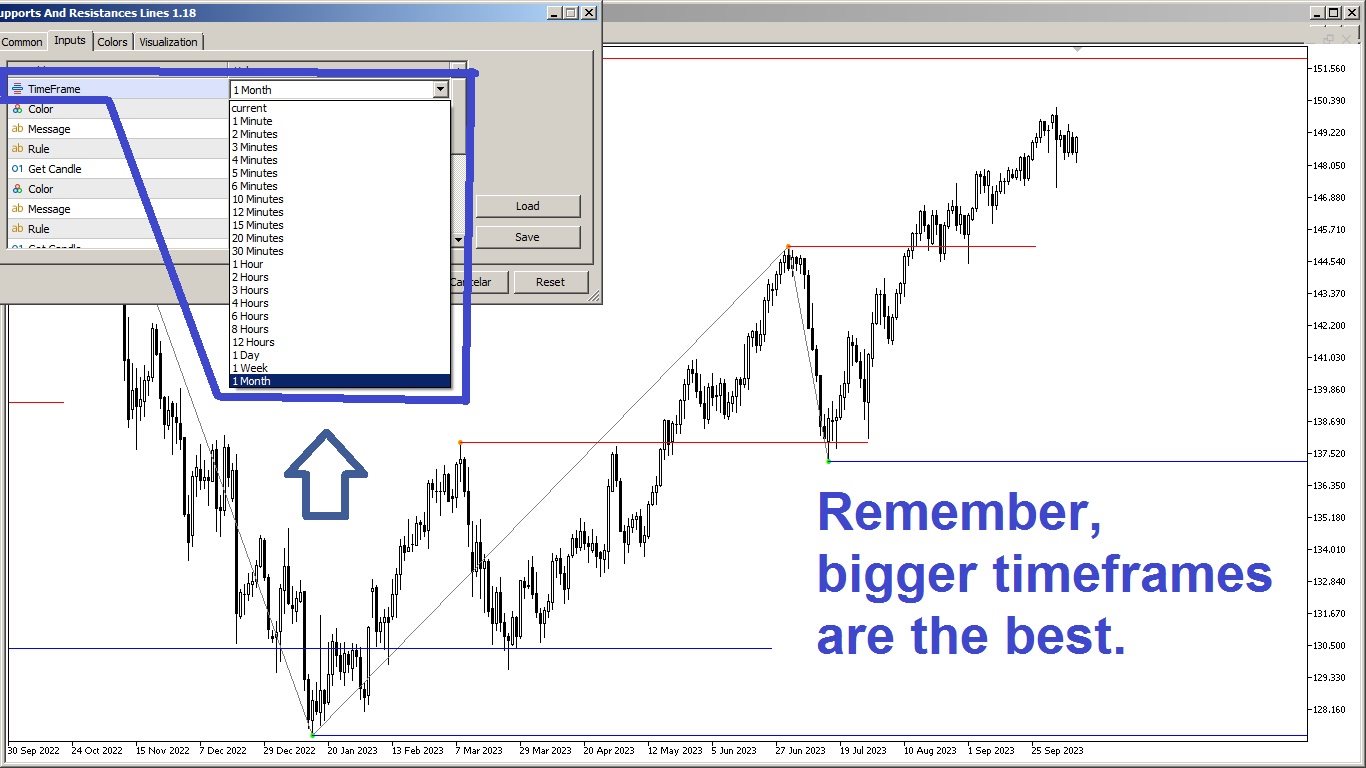
Indikator für Unterstützungs- und Widerstandszonen MT5
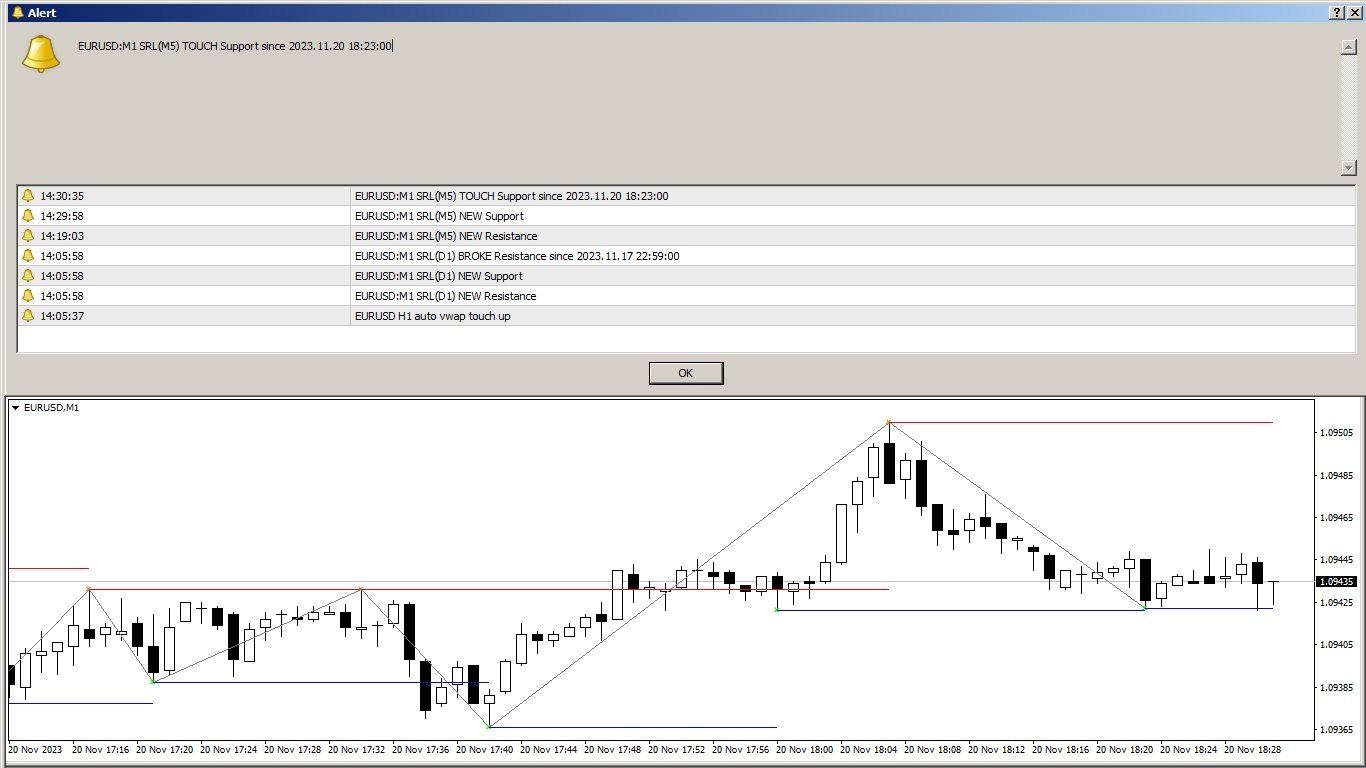
Dieser Indikator kann Hochs und Tiefs automatisch erkennen.
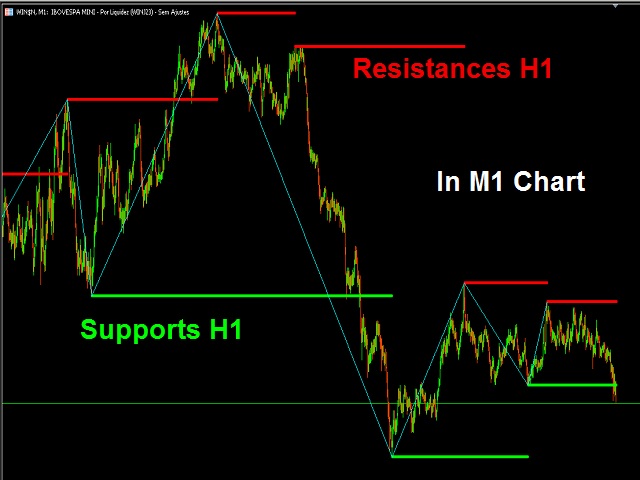
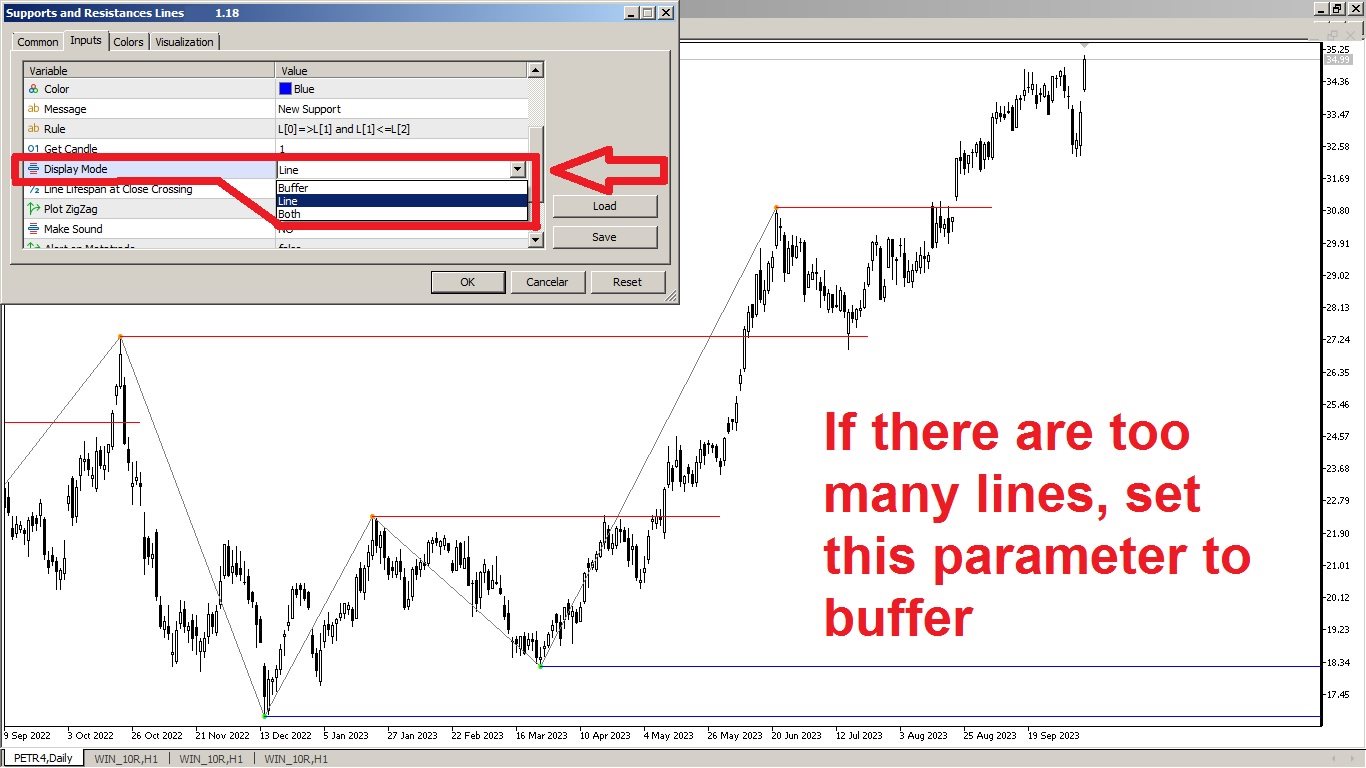
Dieser Unterstützungs- und Widerstandsindikator erstellt Unterstützungslinien und Widerstandslinien basierend auf Hochs und Tiefs.
wie man Unterstützungs- und Widerstandslinien erstellt.
Dies ist ein Indikator, um automatische Unterstützungs- und Widerstandslinien zu erstellen.
wie man das Unterstützungsniveau mit dem Indikator findet.
Dieser Indikator findet automatisch Hochs und Tiefs.
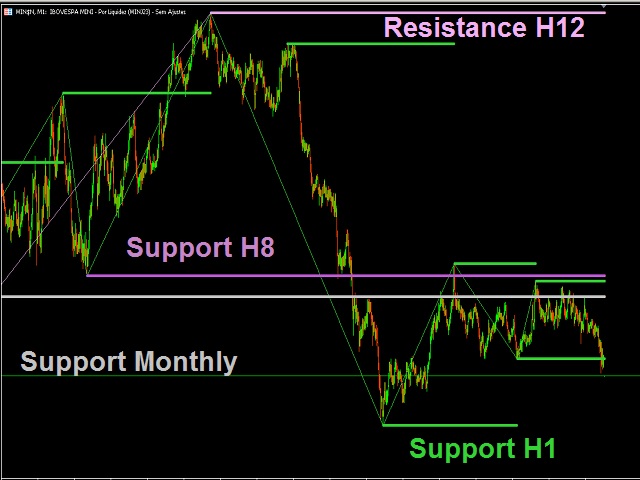
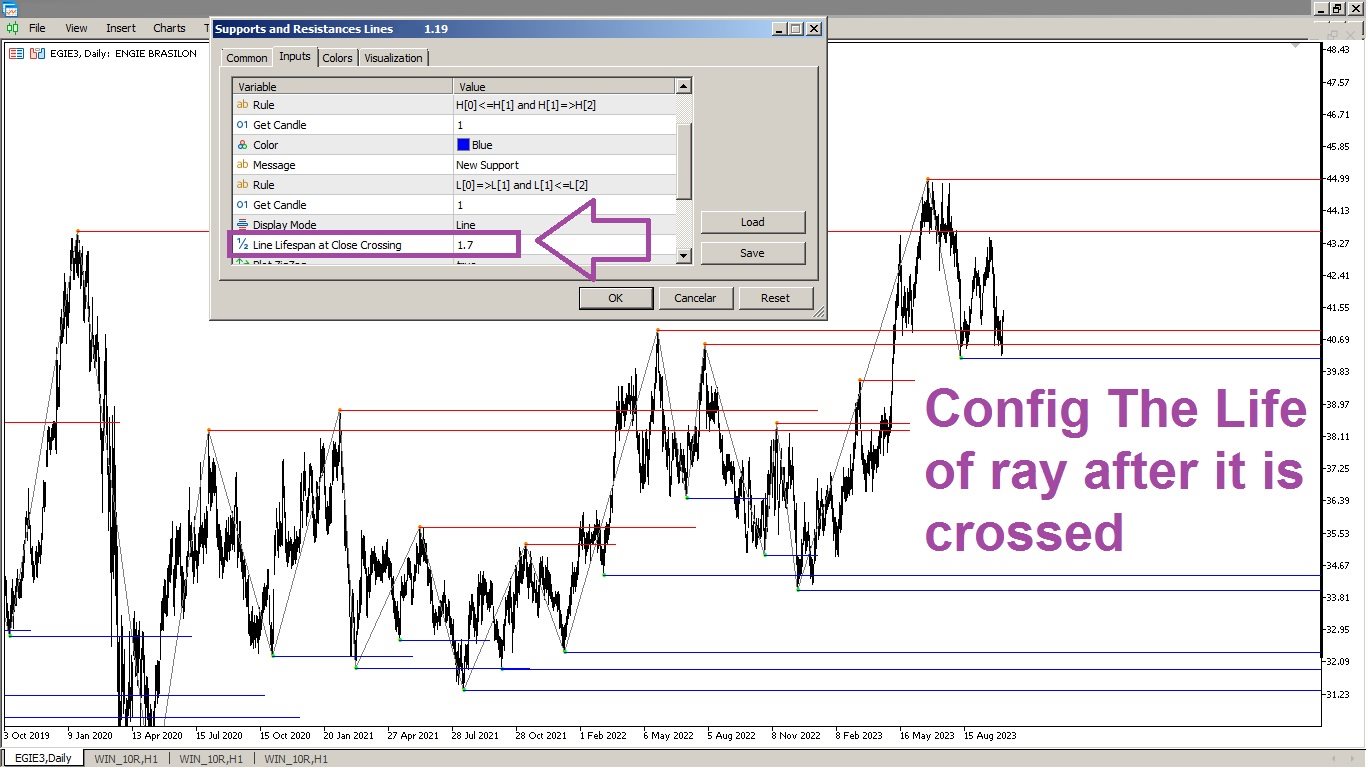
Der Indikator erstellt jedes Mal automatisch Unterstützungslinien, wenn „ZigZag“ automatisch einen Boden erstellt oder einen neuen Boden tiefer als den vorherigen Boden macht, sodass der Indikator automatisch eine automatische Unterstützungslinie auf dem Bildschirm zeichnet.
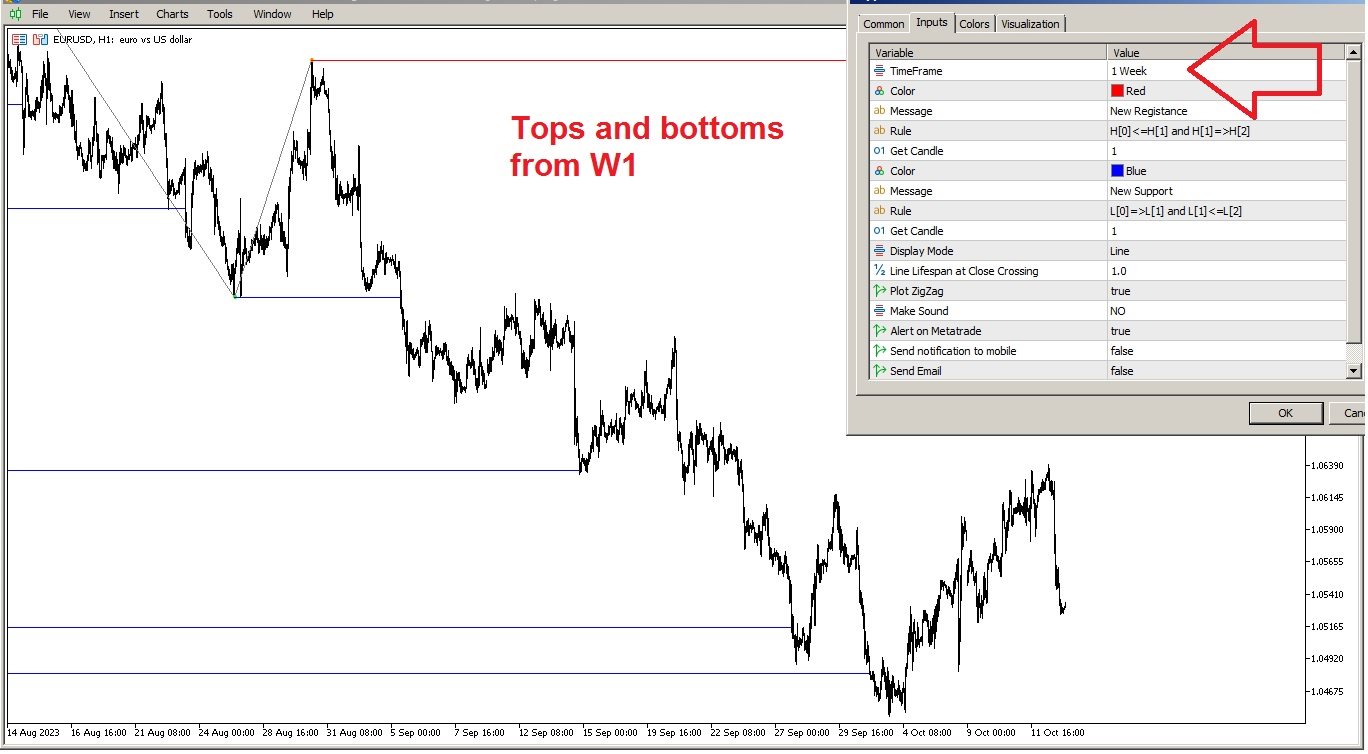
Wie man Widerstandslinien erstellt.
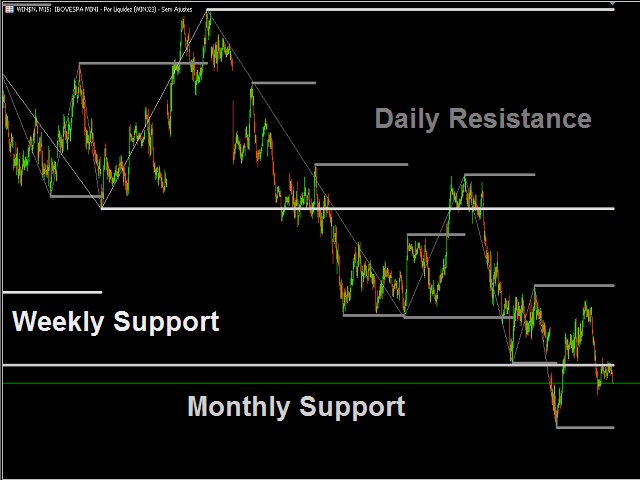
Der Indikator erstellt automatisch Widerstandslinien auf die gleiche Weise wie er Unterstützungsniveaus erstellt, wenn „ZigZag“ ein neues Hoch oder ein Hoch höher als das vorherige Hoch macht, sodass der Indikator automatisch einen neuen Widerstand erstellt, also nicht Sie müssen sich darum kümmern, wo die oberen und unteren Ebenen sind.
Dieser Indikator ist eine einfache Möglichkeit für Trader, ihre Charts mit Unterstützung und Widerstand zu markieren.
Wie man einen Kreisel markiert.
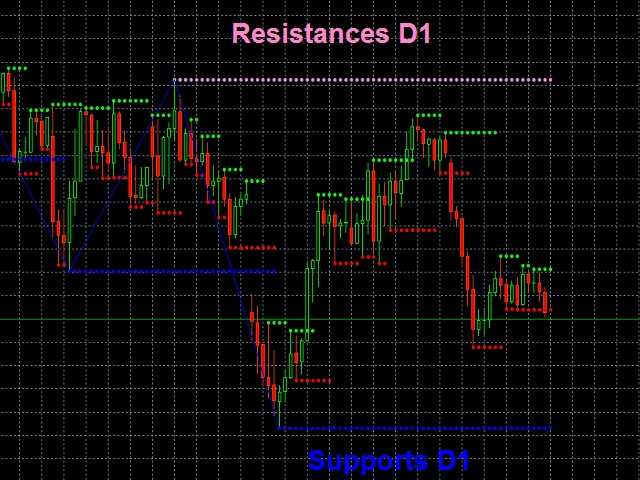
Tops werden automatisch durch „ZigZag“ gesetzt und dann wird eine Widerstandslinie auf dieser Ebene gezeichnet, um dieses Top zu markieren.
So markieren Sie einen Boden
Tiefs werden auch automatisch durch „ZigZag“ gesetzt und dann wird eine Unterstützungslinie erstellt, um dieses Tief zu markieren.
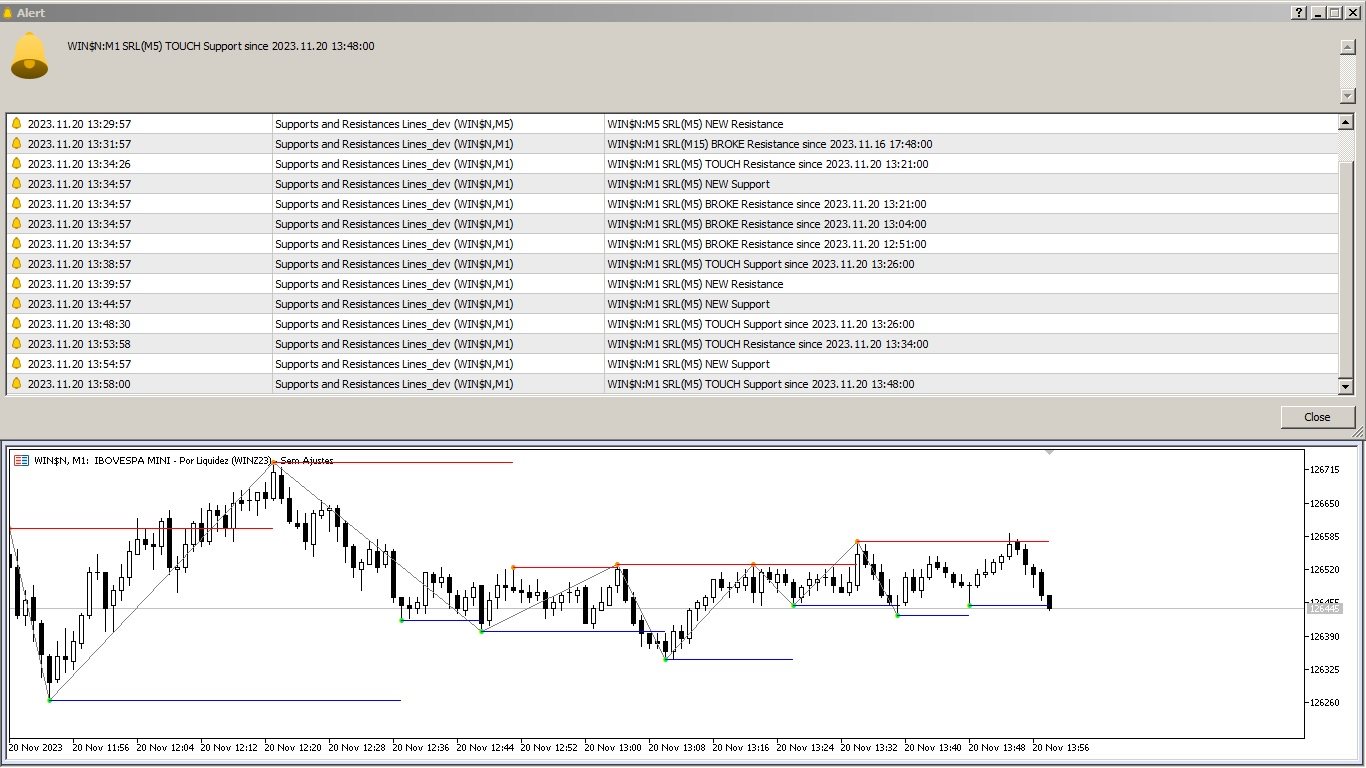
Unterstützungs- und Widerstandszonen
Ober- und Untergrenzen MT5
Bodenzonen
Sie können die Tick-Breite der Unterstützungszone so einstellen, dass sie eine ganze Unterstützungsregion einnimmt, anstatt nur eine Linie am unteren Rand zu zeichnen
Top-Zonen
Auf die gleiche Weise definieren Sie eine Widerstandszone, indem Sie Häkchen verwenden, um die Breite der Linie im oberen Bereich zu erhöhen
Auswahl an Ober- und Unterteilen
Die Hauptfunktion dieses Indikators besteht darin, leere Löcher im Chart leicht zu identifizieren, wo es weder Hochs noch Tiefs gibt, einen Raum ohne Widerstand und ohne Unterstützung, wo der Markt normalerweise schneller von einem solchen Punkt zum anderen läuft.
p>Tops-and-Bottoms-Strategie
Die Strategie, mit diesem Indikator zu arbeiten, besteht darin, ein besseres Risikomanagement zu haben, denn wenn der Markt einen Widerstand durchbricht, wird er wahrscheinlich nach dem nächsten suchen, und da es bis zum nächsten ein großes Loch geben kann, das Risiko Rendite günstig ist oder nicht, je nachdem, von wo aus Sie Ihren Stopp setzen, normalerweise wird der Stopp auf der letzten Unterstützung oder unterhalb des gerade durchbrochenen Widerstands platziert.
Kommentar
Sie können Vorschläge, Kommentare, Bewertungen oder Beschwerden zu meinen Produkten einreichen. Vielen Dank für jede Interaktion, sie wird sehr nützlich sein.
support and resistance or supports and resistances zones with tops and bottoms or peaks and bottom points


nice