• Genel bakış
  • İncelemeler (39)
  • Yorumlar (36)
  • Yenilikler

Supports And Resistances Lines

4.76

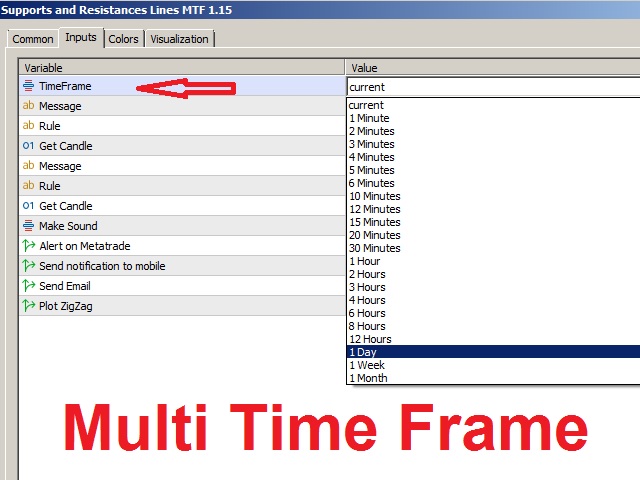
Destek ve Direnç bölgeleri Göstergesi MT5

bu gösterge, tepeleri ve dipleri otomatik olarak nasıl belirleyeceğini bilir.

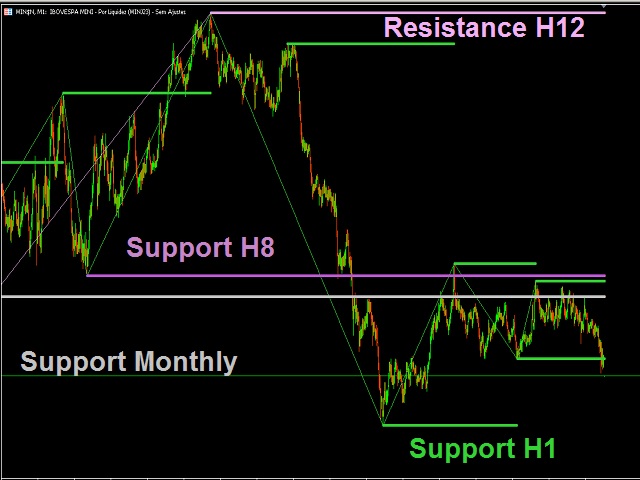
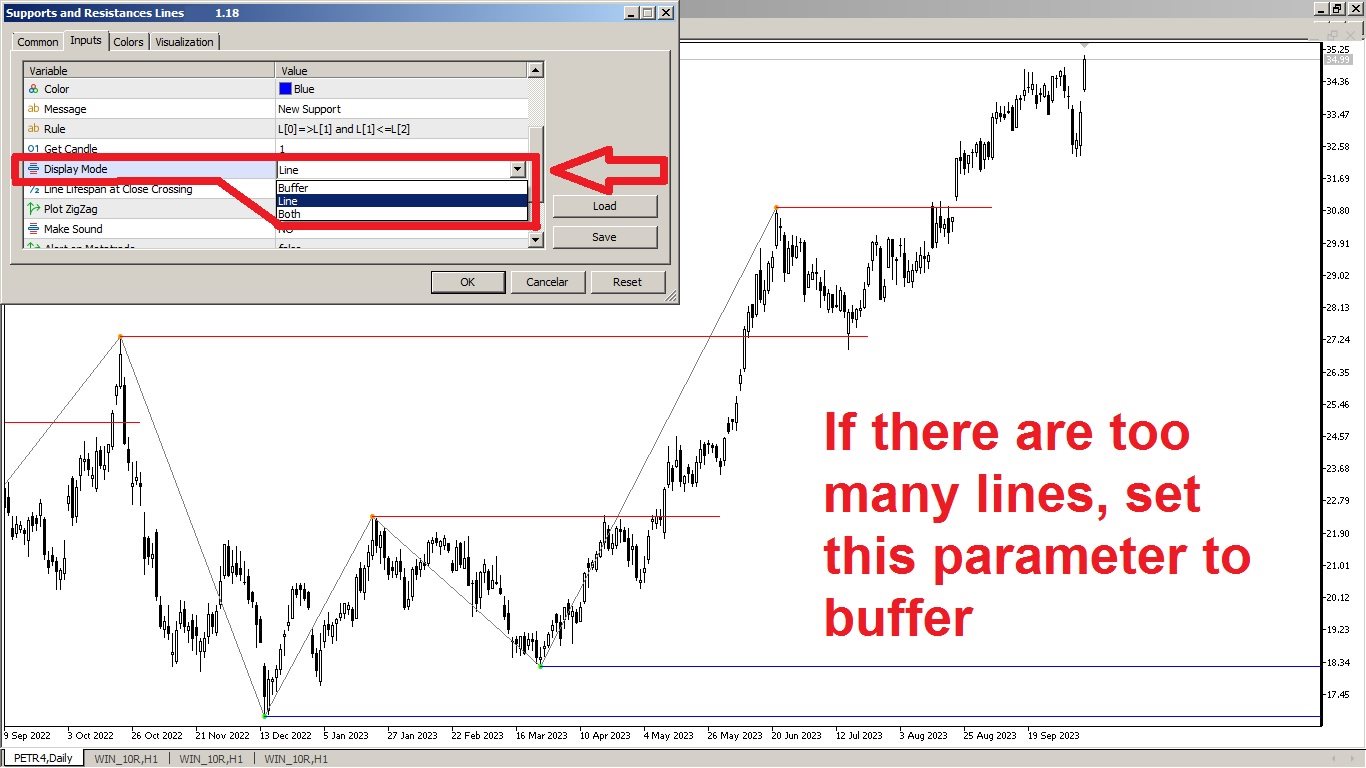
Bu destek ve direnç göstergesi, üst ve alt noktalara göre destek çizgileri ve direnç çizgileri oluşturur.

destek ve direnç çizgileri nasıl yapılır?

Bu, otomatik destek ve direnç çizgileri oluşturmanın bir göstergesidir.

gösterge ile destek seviyesi nasıl bulunur?

bu gösterge, tepeleri ve dipleri otomatik olarak bulur.

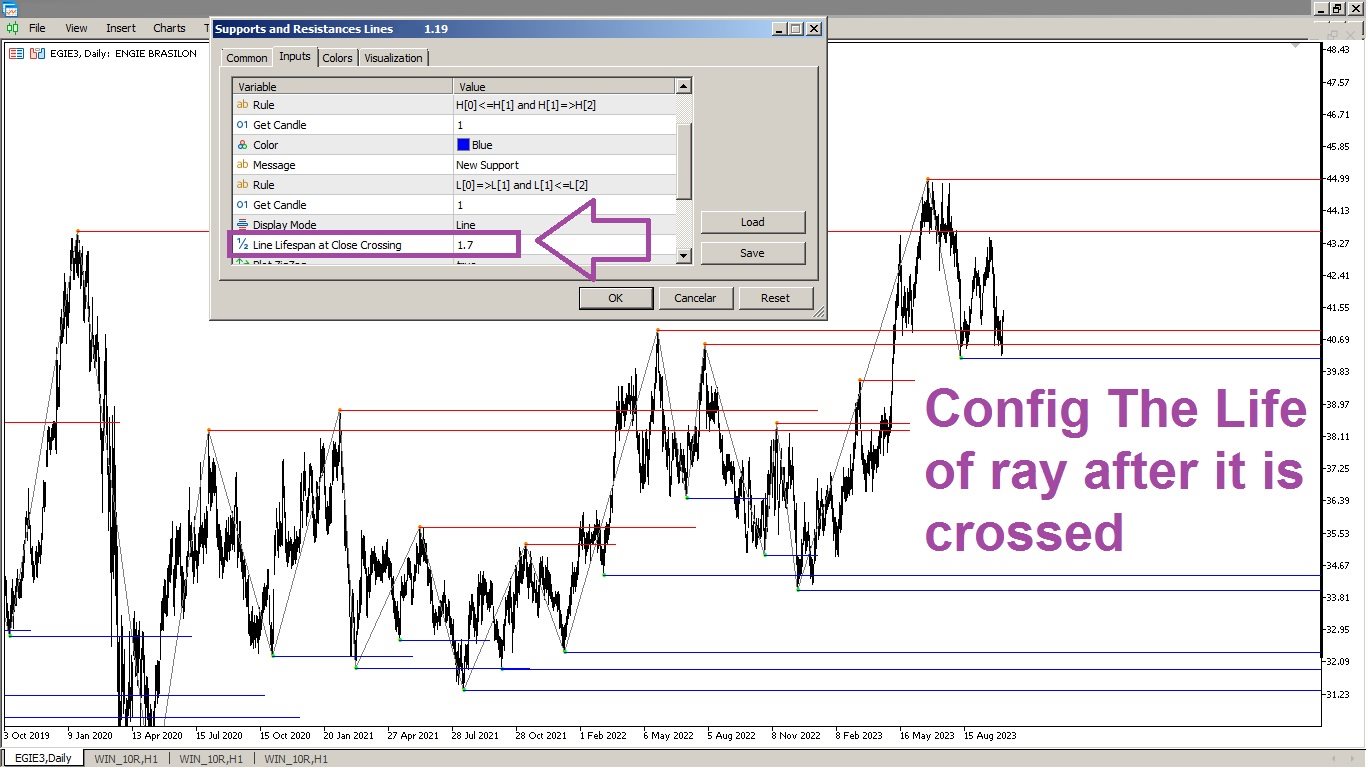
Gösterge, "ZigZag" otomatik olarak bir dip oluşturduğunda veya önceki dipten daha aşağıda yeni bir dip oluşturduğunda, otomatik olarak destek çizgileri oluşturur, böylece gösterge otomatik olarak ekranda otomatik bir destek çizgisi çizer.

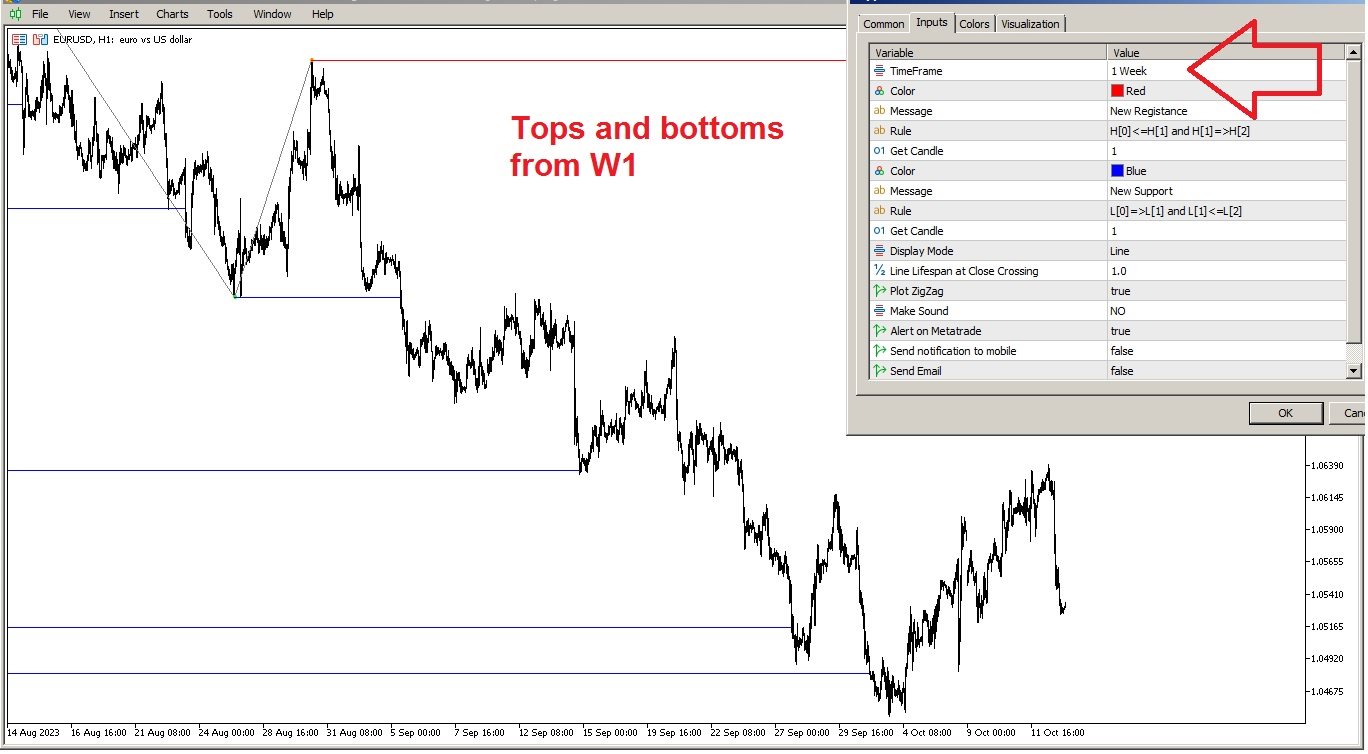
Direnç hatları nasıl oluşturulur?

Gösterge, "ZigZag" yeni bir tepe veya bir önceki tepeden daha yüksek bir tepe oluşturduğunda, destek seviyeleri oluşturduğu gibi otomatik olarak direnç çizgileri oluşturur, bu nedenle gösterge otomatik olarak yeni bir direnç oluşturur; üst ve alt seviyelerin nerede olduğu konusunda endişelenmeniz gerekiyor.

Bu gösterge, yatırımcıların grafiklerini destek ve dirençle işaretlemeleri için kolay bir yoldur.

Bir üst nasıl işaretlenir?

Üstler otomatik olarak "ZigZag" ile belirlenir ve ardından bu zirveyi işaretlemek için o seviyede bir direnç çizgisi çizilir.

Bir dip nasıl işaretlenir

dipler de otomatik olarak "ZigZag" ile ayarlanır ve ardından o dibi işaretlemek için bir destek hattı oluşturulur.

Destek ve direnç bölgeleri

üst ve alt bölgeler MT5

Alt bölgeler

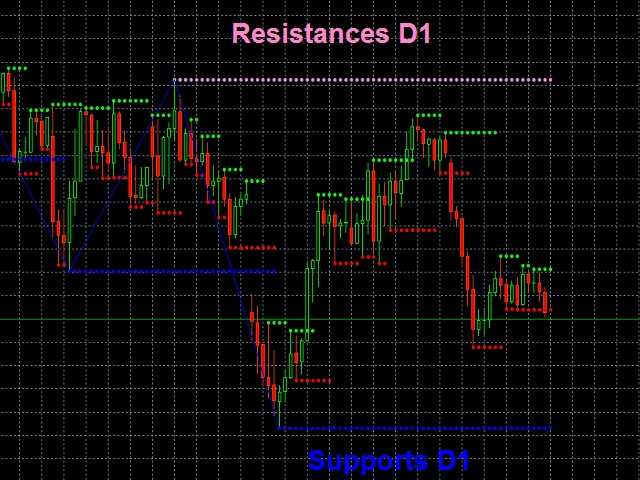
Destek bölgesinin işaret genişliğini, yalnızca altta bir çizgi çizmek yerine tüm destek bölgesini alacak şekilde ayarlayabilirsiniz

üst bölgeler

Aynı şekilde, üst bölgede çizginin genişliğini artırmak için keneler kullanarak bir direnç bölgesi tanımlarsınız

Üstler ve dipler aralığı

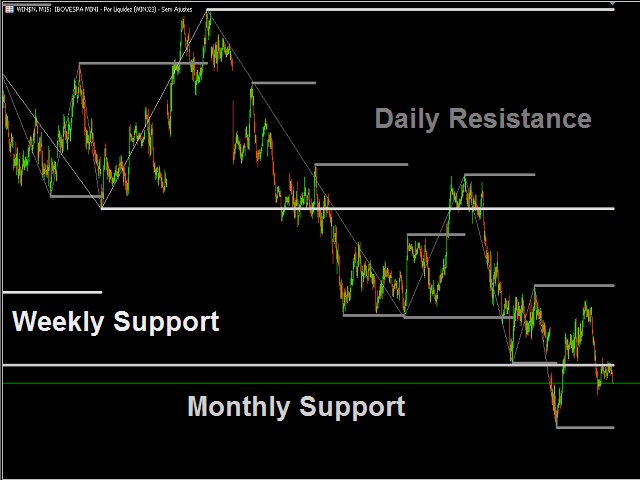
Bu göstergenin ana işlevi, grafikte ne tepe ne de dip olan, dirençsiz ve desteksiz bir boşluk olan ve normalde piyasanın bir noktadan diğerine daha hızlı ilerlediği boş delikleri kolayca belirlemektir.

Üstler ve dipler stratejisi

Bu göstergeyle çalışma stratejisi, daha iyi bir risk yönetimine sahip olmaktır, çünkü piyasa bir direnci kırarsa, muhtemelen bir sonrakini arayacaktır ve bir sonrakine kadar büyük bir boşluk olabileceğinden, risk geri dönüş olumludur ya da değildir, durağınızı nereye yerleştirdiğinize bağlı olarak, normalde durdurma son desteğe veya henüz kırılmış olan direncin altına yerleştirilir.
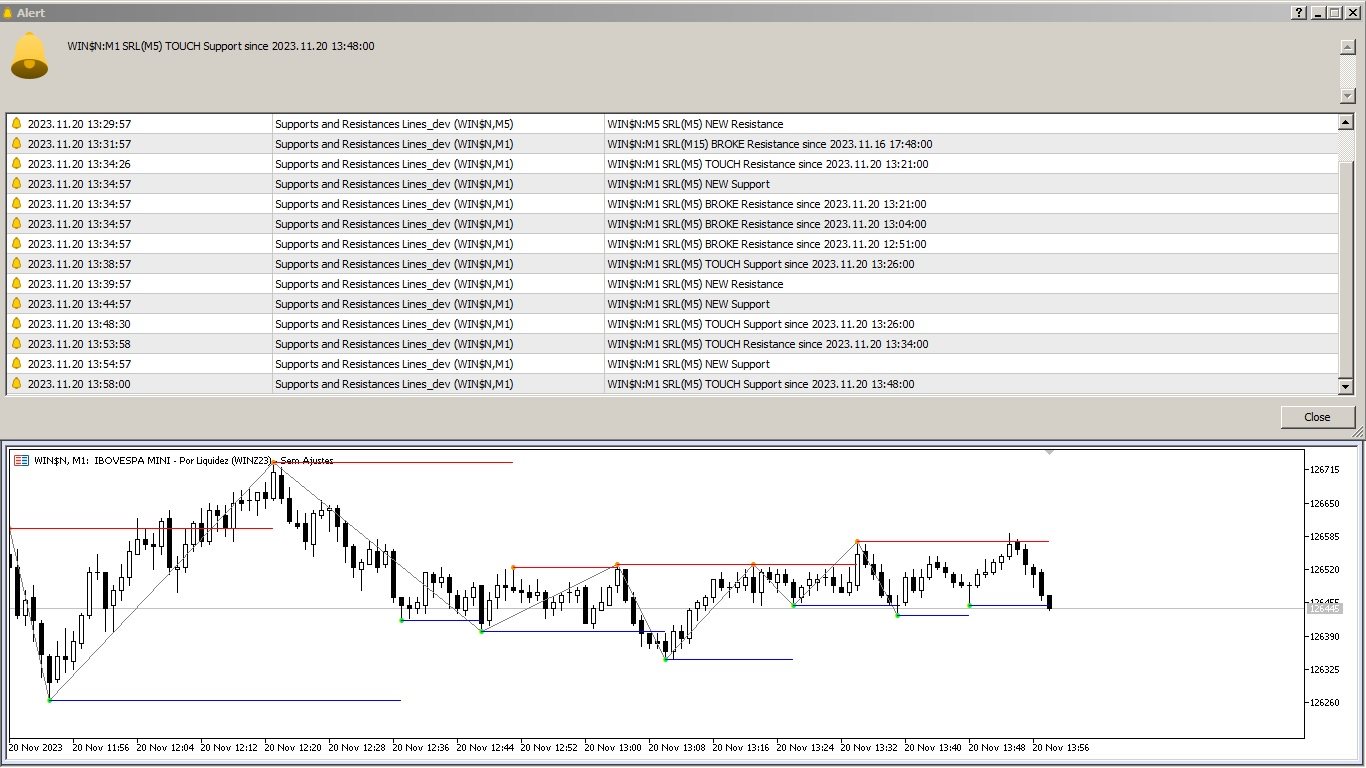
Yorum

Ürünlerim hakkında öneri, yorum, puan veya şikayet gönderebilirsiniz. Her etkileşim için teşekkürler, çok faydalı olacak.

support and resistance or supports and resistances zones with tops and bottoms or peaks and bottom points
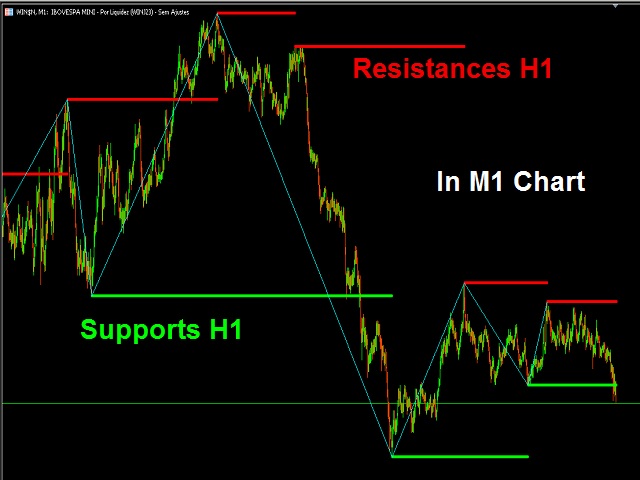
İncelemeler 20
gnanos123
535
gnanos123 2024.02.07 17:25 
 

It Works

danieltickmaill
24
danieltickmaill 2024.01.01 21:38 
 

I love this indicator and a very good one. Thanks to this developer.👌

Marco Engstermann
855
Marco Engstermann 2023.12.19 06:43 
 

Very nice , Thank you

Önerilen ürünler
Follow The Line MT5
Oliver Gideon Amofa Appiah
4.4 (30)
This indicator obeys the popular maxim that: "THE TREND IS YOUR FRIEND" It paints a GREEN line for BUY and also paints a RED line for SELL. (you can change the colors). It gives alarms and alerts of all kinds. IT DOES NOT REPAINT and can be used for all currency pairs and timeframes. Yes, as easy and simple as that. Even a newbie can use it to make great and reliable trades. NB: For best results, get my other premium indicators for more powerful and reliable signals. Get them here: https://www.m
FREE
LT Donchian Channel
Thiago Duarte
4.75 (4)
Donchian Channel is an indicator created by Richard Donchian. It is formed by taking the highest high and the lowest low of the last specified period in candles. The area between high and low is the channel for the chosen period. Its configuration is simple. It is possible to have the average between the upper and lower lines, plus you have alerts when price hits one side. If you have any questions or find any bugs, please contact me. Enjoy!
FREE
Weis Waves
Flavio Javier Jarabeck
3.15 (26)
The original author is David Weis, an expert in the Wyckoff Method. The Weis Wave is a modern adaptation of the 1930's Wyckoff Method, another expert in Tape Reading techniques and Chart Analysis. Weis Waves takes market volume and stacks it into waves according to price conditions giving the trader valuable insights about the market conditions. If you want to learn more about this subject you can find tons of videos in YouTube. Just look for "The Wickoff Method", "Weis Wave" and "Volume Spread
FREE
Mitimom
Danil Poletavkin
The indicator is based on Robert Miner's methodology described in his book "High probability trading strategies" and displays signals along with momentum of 2 timeframes. A Stochastic oscillator is used as a momentum indicator. The settings speak for themselves period_1 is the current timeframe, 'current' period_2 is indicated - the senior timeframe is 4 or 5 times larger than the current one. For example, if the current one is 5 minutes, then the older one will be 20 minutes The rest of the
FREE
Tabajara V5
Flavio Javier Jarabeck
4.87 (38)
Metatrader 5 version of the famous Andre Machado's Tabajara indicator. If you don't know Andre Machado's Technical Analysis work you don't need this indicator... For those who need it and for those several friend traders who asked this porting from other platforms, here it is... FEATURES 8-period Moving Average 20-period Moving Average 50-period Moving Average 200-period Moving Average Colored candles according to the inflexion of the 20-period MA SETTINGS You can change the Period of all M
FREE
Free automatic Fibonacci is an indicator that automatically plots a Fibonacci retracement based on the number of bars you select on the BarsToScan setting in the indicator. The Fibonacci is automatically updated in real time as new highest and lowest values appears amongst the selected bars. You can select which level values to be displayed in the indicator settings. You can also select the color of the levels thus enabling the trader to be able to attach the indicator several times with differe
FREE
Are you tired of drawing trendlines every time you're analyzing charts? Or perhaps you would like more consistency in your technical analysis. Then this is for you. This indicator will draw trend lines automatically when dropped on a chart. How it works Works similar to standard deviation channel found on mt4 and mt5. It has 2 parameters: 1. Starting Bar 2. Number of bars for calculation The   starting bar   is the bar which drawing of the trend lines will begin, while the   number of bars for c
FREE
Donchian Pro
Paulo Henrique Faquineli Garcia
5 (2)
The Donchian Channel Channels are among the most popular tools of technical analysis, as they visually convey to the analyst the limits within which most price movement tends to occur. Channel users know that valuable information can be obtained at any time, whether prices are in the central region of a band or close to one of the border lines. One of the best known techniques to explore these concepts is Bollinger Bands. However, John Bollinger was not the only one to research the applicatio
FREE
Bollinger Bands B
Flavio Javier Jarabeck
5 (3)
John Bollinger created this indicator in 2010 as a way to read the original indicator (Bollinger Bands) in a more "technical" way, shown as an oscillator. The typical range of the Bollinger Bands %B is 0 - 0.5 - 1.0, where "0" represents the lower band, the "0.5" the middle band, and "1" the upper band. The line on the indicator represents the Closing prices. As simple as that. SETTINGS Bollinger Bands period of analysis Standard Deviation multiplier Shift Price type to be analyzed If you
FREE
MIDAS Super VWAP
Flavio Javier Jarabeck
4.29 (14)
Imagine VWAP, MVWAP and MIDAS in one place... Well, you found it! Now you can track the movement of Big Players in various ways, as they in general pursue the benchmarks related to this measuring, gauging if they had good execution or poor execution on their orders. Traders and analysts use the VWAP to eliminate the noise that occurs throughout the day, so they can measure what prices buyers and sellers are really trading. VWAP gives traders insight into how a stock trades for that day and deter
FREE
Cybertrade Keltner Channels - MT5 Created by Chester Keltner, this is a volatility indicator used by technical analysis. It is possible to follow the trend of financial asset prices and generate support and resistance patterns. In addition, envelopes are a way of tracking volatility in order to identify opportunities to buy and sell these assets. It works on periods longer than the period visible on the chart. All values ​​are available in the form of buffers to simplify possible automations.
FREE
Value Chart Candlesticks
Flavio Javier Jarabeck
4.75 (8)
The idea of a Value Chart indicator was presented in the very good book I read back in 2020 , " Dynamic Trading Indicators: Winning with Value Charts and Price Action Profile ", from the authors Mark Helweg and David Stendahl. The idea is simple and the result is pure genius: Present candlestick Price analysis in a detrended way! HOW TO READ THIS INDICATOR Look for Overbought and Oversold levels. Of course, you will need to test the settings a lot to find the "correct" one for your approach.
FREE
What is this indicator? This indicator is the MACD (Moving Average Convergence/Divergence) supporting Virtual Trading mode of  Knots Compositor . When the mode is turned on, the indicator will be recalculated based on the displayed candlesticks. When the mode is turned off, the indicator will be recalculated based on the original chart candlesticks. Types of the applied price - Close - Open - High - Low - Median Price (HL/2) - Typical Price (HLC/3) - Weighted Price (HLCC/4) KC-Indicators
FREE
Super Trend eu
Emin Ulucanli
5 (3)
SUPER TREND; Olivier Seban tarafından oluşturulan Supertrend ATR ‘ye dayanan ve trendi takip eden bir göstergedir. Trend yönündeki değişiklikleri tespit etmek ve durakları konumlandırmak için kullanılabilir. Fiyat gösterge eğrisinin altına düştüğünde kırmızıya döner ve bir düşüş trendine işaret eder. Tersine, fiyat eğrinin üzerine çıktığında, gösterge yeşile döner ve bir yükseliş trendine işaret eder. Diğer göstergeler gibi, Supertrend ’de, MACD, parabolik SAR, Bollinger Band veya RSI gibi diğer
FREE
PZ Penta O MT5
PZ TRADING SLU
4 (6)
The Penta-O is a 6-point retracement harmonacci pattern which usually precedes big market movements. Penta-O patterns can expand and repaint quite a bit. To make things easier this indicator implements a twist: it waits for a donchian breakout in the right direction before signaling the trade. The end result is an otherwise repainting indicator with a very reliable trading signal. The donchian breakout period is entered as an input. [ Installation Guide | Update Guide | Troubleshooting | FAQ | A
FREE
Spike Catch Pro 22:03 release updates Advanced engine for searching trade entries in all Boom and Crash pairs (300,500 and 1000) Programmed strategies improvements Mx_Spikes (to combine Mxd,Mxc and Mxe), Tx_Spikes,   RegularSpikes,   Litho_System,   Dx_System,   Md_System,   MaCross,   Omx_Entry(OP),  Atx1_Spikes(OP),   Oxc_Retracement (AT),M_PullBack(AT) we have added an arrow on strategy identification, this will help also in the visual manual backtesting of the included strategies and see h
FREE
Bar Color Trend
Germano Chagas
4.5 (10)
Combining the best of Price Action , Directional Movement , and Divergence/Convergence analysis, Candle Color Trend is a easy and reliable way to identify trend direction. The indicator automatically paints the candles according to the assumption that an uptrend is defined by prices that form a series of higher highs and higher lows. In contrast, a downtrend is defined by prices that form a series of lower highs and lower lows. Additionally, ADX Wilder indicator is used to measure trend weakness
FREE
The idea of the system is to indentify the reversal patterns using the calculation of the composite candle. The reversal patterns is similar to the "Hammer" and "Hanging Man" patterns in Japanese candlestick analysis. But it uses the composite candle instead the single candle and doesn't need the small body of the composite candle to confirm the reversal. Input parameters: Range - maximal number of bars, used in the calculation of the composite candle. Minimum - minimal size of the composite can
FREE
Dual RSI
Paul Conrad Carlson
Indicator alerts for Dual Relative strength index rsi. Large rsi preset at 14 is below 30 small rsi preset at 4 is below 10 for buy bullish signals . Large rsi preset are 14 is above 70 small rsi preset at 4 is above 90 for sell bearish signals . Includes mobile and terminal alerts. draws lines when alerts. This indicator can help identify extremes and then the tops or bottoms of those extremes .
FREE
This indicator sums up the difference between the sells aggression and the buys aggression that occurred in each Candle, graphically plotting the waves of accumulation of the aggression volumes.   Through these waves an exponential average is calculated that indicates the direction of the business flow. Note: This indicator DOES NOT WORK for Brokers and/or Markets WITHOUT the type of aggression (BUY or SELL).   Be sure to try our Professional version with configurable features and alerts:  Agr
FREE
Aggression Volume
Flavio Javier Jarabeck
3.8 (20)
Aggression Volume Indicator is the kind of indicator that is rarely found in the MQL5 community because it is not based on the standard Volume data provided by the Metatrader 5 platform. It requires the scrutiny of all traffic Ticks requested on the platform... That said, Aggression Volume indicator requests all Tick Data from your Broker and processes it to build a very special version of a Volume Indicator, where Buyers and Sellers aggressions are plotted in a form of Histogram. Additionally,
FREE
A professional tool for trading - the divergence indicator between the  Stochastic and the price, which allows you to receive a signal about a trend reversal in a timely manner or catch price pullback movements (depending on the settings). The indicator settings allow you to adjust the strength of the divergence due to the angle of the  Stochastic peaks and the percentage change in price, which makes it possible to fine-tune the signal strength. The indicator code is optimized and is tested ver
FREE
Cybertrade Double Bollinger Bands - MT5  The Bollinger Bands indicator shows the levels of different highs and lows that a security price has reached in a given duration and also their relative strength, where the highs are close to the upper line and the lows are close to the lower line. Our differential is to present this indicator in a double form, with the availability of its values ​​to simplify automation. It works on periods longer than the period visible on the chart. All values ​​are
FREE
PZ Three Drives MT5
PZ TRADING SLU
3.11 (9)
This indicator finds Three Drives patterns. The Three Drives pattern is a 6-point reversal pattern characterised by a series of higher highs or lower lows that complete at a 127% or 161.8% Fibonacci extension. It signals that the market is exhausted and a reversal can happen. [ Installation Guide | Update Guide | Troubleshooting | FAQ | All Products ] Customizable pattern sizes Customizable colors and sizes Customizable breakout periods Customizable 1-2-3 and 0-A-B ratios It implements visua
FREE
ADX consolidado
OTAVIO AGUIAR CAMPOS Aguiar
4.75 (4)
Mostra a média móvel quando ADX > 20 e pinta de verde ou vermelho quando os valores de ADX estão subindo indicando tendência. Quando o ADX é menor que 20 indica movimento lateral consolidado. O indicador não define pontos de entrada, somente mostra a média colorida quando a tendência está se fortalecendo. Faz parte do grupo de indicadores do Indicador Tavim.
FREE
Rainbow MT5
Jamal El Alama
4.33 (3)
Description : Rainbow MT5 is a technical indicator based on Moving Average with period 34 and very easy to use. When price crosses above MA and MA changes color to green, then this is a signal to buy. When price crosses below MA and MA changes color to red, then this is a signal to sell. The Expert advisor ( Rainbow EA MT5 ) based on Rainbow MT5 indicator is now available here . MT4 version is available here .
FREE
Fiyat Dalga Modeli   MT5 --(ABCD Modeli)--   hoş geldiniz ABCD modeli, teknik analiz dünyasında güçlü ve yaygın olarak kullanılan bir ticaret modelidir. Tüccarların piyasadaki potansiyel alım ve satım fırsatlarını belirlemek için kullandıkları uyumlu bir fiyat modelidir. ABCD modeliyle, tüccarlar potansiyel fiyat hareketlerini tahmin edebilir ve alım satımlara ne zaman girip çıkacakları konusunda bilinçli kararlar verebilir. EA Sürümü: Price Wave  EA MT5 MT4 Sürümü :   Price Wave Pattern
FREE
Money Flow Index EA Friendly
Flavio Javier Jarabeck
4.25 (4)
The traditional Money Flow Index indicator, this time, EA friendly . There are 3 buffers exposed that can be used by EAs to automatically analyze the Overbought and Oversold conditions of the quote. Just use the traditional iCustom() function to get these signals. This Money Flow Index calculation is based on the traditional Metaquote's MFI indicator. SETTINGS MFI Period Volume type to analyze (Real Volume or Ticks) Starting Overbought region Starting Oversold region USING WITH EAs Buffer
FREE
IMA Finder MT5
Mubashir Mohamed Quraish Albarakat
1 (1)
This indicator is designed based on the Moving Origin indicator When the moving origin indicator breaks the price, this indicator gives a signal It is useful for better viewing of signals and analysis on them Attributes: Can be used in all symbols Can be used in all time frames Too many signals Simple and quick settings Easy way to work Settings: period: like moving average settings alarmShow: If you want to receive an alert in Metatrader after receiving the signal, enable this setting a
FREE
Important Lines
Terence Gronowski
4.88 (26)
This indicator displays Pivot-Lines, preday high and low, preday close and the minimum and maximum of the previous hour. You just have to put this single indicator to the chart to have all these important lines, no need to setup many single indicators. Why certain lines are important Preday high and low : These are watched by traders who trade in a daily chart. Very often, if price climbs over or falls under a preday low/high there is an acceleration in buying/selling. It is a breakout out of
FREE
Bu ürünün alıcıları ayrıca şunları da satın alıyor
Atomic Analyst MT5
Issam Kassas
4.22 (9)
Öncelikle belirtmek gerekir ki bu Ticaret Göstergesi Yeniden Çizim Yapmaz, Gecikmez ve Gecikme Göstermez, bu da hem manuel hem de robot ticareti için ideal hale getirir. Atom Analisti, Piyasada Daha İyi Bir Avantaj Bulmak İçin Fiyatın Gücünü ve Momentumunu Kullanan PA Fiyat Hareketi Göstergesidir. Gürültüleri ve Yanlış Sinyalleri Kaldırmaya ve Ticaret Potansiyelini Artırmaya Yardımcı Olan Gelişmiş Filtrelerle Donatılmıştır. Birden fazla katmanlı karmaşık göstergeler kullanarak, Atom Analisti
Öncelikle, bu Ticaret Sistemi'nin Non-Repainting, Non-Redrawing ve Non-Lagging Göstergesi olduğunu vurgulamak önemlidir, bu da hem manuel hem de robot ticareti için ideal hale getirir. "Smart Trend Trading System MT5", yeni ve deneyimli tüccarlar için özelleştirilmiş kapsamlı bir ticaret çözümüdür. 10'dan fazla premium göstergeyi birleştiriyor ve 7'den fazla sağlam ticaret stratejisi sunuyor, bu da çeşitli piyasa koşulları için esnek bir seçim yapar. Trend Takip Stratejisi: Trendleri etkili bir
Quantum Trend Sniper
Bogdan Ion Puscasu
5 (36)
Tanıtım       Kuantum Trend Keskin Nişancı Göstergesi   , trend tersine dönmeleri belirleme ve ticaret yapma şeklinizi değiştiren çığır açan MQL5 Göstergesi! 13 yılı aşkın ticaret tecrübesine sahip deneyimli tüccarlardan oluşan bir ekip tarafından geliştirilmiştir.       Kuantum Trend Keskin Nişancı Göstergesi       trend dönüşlerini son derece yüksek doğrulukla belirlemenin yenilikçi yolu ile ticaret yolculuğunuzu yeni zirvelere taşımak için tasarlanmıştır. ***Kuantum Trend Keskin Nişancı Gö
Gold Stuff mt5
Vasiliy Strukov
4.88 (162)
Gold Stuff mt5, özellikle altın için tasarlanmış bir trend göstergesidir ve herhangi bir finansal enstrümanda da kullanılabilir. Gösterge yeniden çizilmez ve gecikmez. Önerilen zaman dilimi H1. Ayarları ve kişisel bir bonusu almak için satın alma işleminden hemen sonra benimle iletişime geçin!   AYARLAR Ok Çiz - açık kapalı. grafik üzerinde oklar çizmek. Uyarılar - sesli uyarılar kapalı. E-posta bildirimi - açık kapalı. E-posta Bildirimleri. Puch bildirimi - açık kapalı. Push bildirimleri
Trend Screener Pro MT5
STE S.S.COMPANY
4.89 (61)
Trend Göstergesi, Trend Alım Satım ve Filtreleme için Çığır Açan Benzersiz Çözüm, Tüm Önemli Trend Özellikleriyle Tek Bir Araç İçinde Yerleştirildi! Forex, emtialar, kripto para birimleri, endeksler ve hisse senetleri gibi tüm sembollerde/araçlarda kullanılabilen %100 yeniden boyamayan çoklu zaman çerçevesi ve Çoklu para birimi göstergesidir. Trend Screener, grafikte noktalarla ok trend sinyalleri sağlayan etkili bir trend trend göstergesidir. Trend analizörü göstergesinde bulunan özellikler: 1.
Advanced Supply Demand MT5
Bernhard Schweigert
4.53 (15)
Herhangi bir Acemi veya Uzman Tüccar için En İyi Çözüm! Bu gösterge benzersiz, yüksek kaliteli ve uygun fiyatlı bir ticaret aracıdır çünkü bir dizi tescilli özelliği ve yeni bir formülü bir araya getirdik. Bu güncelleme ile çift zaman dilimi dilimlerini gösterebileceksiniz. Yalnızca daha yüksek bir TF gösteremeyeceksiniz, aynı zamanda TF grafiğini ve ARTIK daha yüksek TF'yi de gösterebileceksiniz: YUVARLAK BÖLGELERİ GÖSTERMEK. Tüm Arz Talebi tüccarları buna bayılacak. :) Önemli Bilgiler Açıkland
RelicusRoad Pro MT5
Relicus LLC
4.81 (21)
Şimdi 147 $ (birkaç güncellemeden sonra 499 $ 'a yükseliyor) - Sınırsız Hesaplar (PC'ler veya Mac'ler) RelicusRoad Kullanım Kılavuzu + Eğitim Videoları + Özel Discord Grubuna Erişim + VIP Durumu PİYASAYA BAKMAK İÇİN YENİ BİR YOL RelicusRoad, forex, vadeli işlemler, kripto para birimleri, hisse senetleri ve endeksler için dünyanın en güçlü ticaret göstergesidir ve yatırımcılara kârlı kalmaları için ihtiyaç duydukları tüm bilgileri ve araçları sağlar. Başlangıç ​​seviyesinden ileri seviyey
Öncelikle, bu Ticaret Aracının Non-Repainting, Non-Redrawing ve Non-Lagging Gösterge olduğunu vurgulamakta fayda var, bu da onu profesyonel ticaret için ideal hale getiriyor. Akıllı Fiyat Hareketi Kavramları Göstergesi, hem yeni hem de deneyimli tüccarlar için çok güçlü bir araçtır. İleri ticaret fikirlerini, Inner Circle Trader Analizi ve Smart Money Concepts Ticaret Stratejileri gibi 20'den fazla kullanışlı göstergeyi bir araya getirerek bir araya getirir. Bu gösterge, büyük kurumların tica
Tanıtım       Quantum Breakout PRO   , Breakout Bölgeleri ile ticaret yapma şeklinizi değiştiren çığır açan MQL5 Göstergesi! 13 yılı aşkın ticaret tecrübesine sahip deneyimli tüccarlardan oluşan bir ekip tarafından geliştirilmiştir.       Kuantum Breakout PRO       yenilikçi ve dinamik koparma bölgesi stratejisiyle ticaret yolculuğunuzu yeni zirvelere taşımak için tasarlanmıştır. Kuantum Breakout Göstergesi, size 5 kar hedefi bölgesi ile kırılma bölgelerinde sinyal okları ve kırılma kutusuna
FX Power MT5 NG
Daniel Stein
5 (4)
Sabah Brifingimiz burada mql5 ve on Telegram! FX Power MT5 NG , uzun zamandır çok popüler olan döviz gücü ölçerimiz FX Power'ın yeni neslidir. Peki bu yeni nesil güç ölçer ne sunuyor? Orijinal FX Power hakkında sevdiğiniz her şey PLUS GOLD/XAU güç analizi Daha da hassas hesaplama sonuçları Ayrı ayrı yapılandırılabilir analiz dönemleri Daha da iyi performans için özelleştirilebilir hesaplama limiti Özel çokluDaha fazlasını görmek isteyenler için örnek ayarlar Her grafikte en sevdiğiniz renkler i
AW Trend Predictor MT5
AW Trading Software Limited
4.76 (54)
Tek bir sistemde trend ve kırılma seviyelerinin kombinasyonu. Gelişmiş bir gösterge algoritması piyasa gürültüsünü filtreler, trendi, giriş noktalarını ve olası çıkış seviyelerini belirler. Gösterge sinyalleri, sinyal geçmişinin etkinliğini gösteren en uygun enstrümanların seçilmesine izin veren bir istatistiksel modüle kaydedilir. Gösterge Kâr Al ve Zararı Durdur işaretlerini hesaplar. Kılavuz ve talimatlar ->   BURAYA   / MT4 versiyonu ->   BURAYA Gösterge ile nasıl ticaret yapılır: Trend Pre
FX Volume MT5
Daniel Stein
4.94 (17)
Sabah Brifingimiz aracılığıyla ayrıntılar ve ekran görüntüleri ile günlük piyasa güncellemenizi alın burada mql5 ve on Telegram ! FX Volume, bir brokerin bakış açısından piyasa duyarlılığı hakkında GERÇEK bir fikir veren İLK ve TEK hacim göstergesidir. COT raporlarından çok daha hızlı bir şekilde, brokerlar gibi kurumsal piyasa katılımcılarının Forex piyasasında nasıl konumlandıklarına dair harika bilgiler sağlar. Bu bilgileri doğrudan grafiğinizde görmek, ticaretiniz için gerçek oyun değiştir
Top indicator for MT5   providing accurate signals to enter a trade without repainting! It can be applied to any financial assets:   forex, cryptocurrencies, metals, stocks, indices .  Watch  the video  (6:22) with an example of processing only one signal that paid off the indicator! MT4 version is here It will provide pretty accurate trading signals and tell you when it's best to open a trade and close it. Most traders improve their trading results during the first trading week with the help of
TPSpro TRENDPRO  - is a trend indicator that automatically analyzes the market and provides information about the trend and each of its changes, as well as giving signals for entering trades without redrawing! The indicator uses each candle, analyzing them separately. referring to different impulses - up or down impulse. Exact entry points into transactions for currencies, crypto, metals, stocks, indices!  -  Version MT4                  DETAILED DESCRIPTION        /       TRADING SETUPS       
Bill Williams Advanced
Siarhei Vashchylka
5 (3)
Bill Williams Advanced is designed for automatic chart analysis using Bill Williams' "Profitunity" system. The indicator analyzes four timeframes at once. Manual (Be sure to read before purchasing) Advantages 1. Automatically analyzes the chart using the "Profitunity" system of Bill Williams. The found signals are placed in a table in the corner of the screen. 2. Equipped with a trend filter based on the Alligator indicator. Most of the system signals are recommended to be used only accordi
ICT, SMC, SMART MONEY CONCEPTS, SMART MONEY, Smart Money Concept, Support and Resistance, Trend Analysis, Price Action, Market Structure, Order Blocks, BOS/CHoCH,   Breaker Blocks ,  Momentum Shift,   Supply&Demand Zone/Order Blocks , Strong Imbalance,   HH/LL/HL/LH,    Fair Value Gap, FVG,  Premium  &   Discount   Zones, Fibonacci Retracement, OTE, Buy Side Liquidity, Sell Side Liquidity, BSL/SSL Taken, Equal Highs & Lows, MTF Dashboard, Multiple Time Frame, BigBar, HTF OB, HTF Market Structure
TrendMaestro5
Stefano Frisetti
note: this indicator is for METATRADER4, if you want the version for METATRADER5 this is the link:  https://www.mql5.com/it/market/product/108106 TRENDMAESTRO recognizes a new TREND in the bud, he never makes mistakes. The certainty of identifying a new TREND is priceless. DESCRIPTION TRENDMAESTRO identifies a new TREND in the bud, this indicator examines the volatility, volumes and momentum to identify the moment in which there is an explosion of one or more of these data and therefore the mome
Auto Order Block with break of structure based on ICT and Smart Money Concepts Futures Break of Structure ( BoS )             Order block ( OB )            Higher time frame Order block / Point of Interest ( POI )    shown on current chart           Fair value Gap ( FVG ) / Imbalance   ,  MTF      ( Multi Time Frame )    Volume Imbalance     ,  MTF          vIMB Gap’s Equal High / Low’s     ,  MTF             EQH / EQL Liquidity               Current Day High / Low           HOD /
TrendDecoder Premium MT5
Christophe, Pa Trouillas
5 (1)
Aralıkları ve bir sonraki olası hamleleri belirleyin     |    Trendlerin en erken sinyallerini ve gücünü alın     |    Geri dönüşten önce net çıkışlar alın     |    Fiyatın test edeceği Fibo seviyelerini tespit edin   |  Gecikmesiz, takip edilmeyen gösterge - manuel ve otomatik ticaret için ideal - tüm varlıklar ve tüm zaman birimleri için uygun 50 İNDİRİM   - lansman için sonra tekrar   >>   149 $ Satın aldıktan sonra, kişiselleştirilmiş ayarlar için   bu kanaldan benimle iletişime geçin . MT4
XQ Indicator MetaTrader 5
Marzena Maria Szmit
5 (1)
Step into the realm of Forex trading with confidence and precision using XQ, a cutting-edge Forex indicator designed to elevate your trading game to unprecedented heights. Whether you're a seasoned trader or just stepping into the world of currency exchange, XQ Forex Indicator empowers you with the insights and signals needed to make informed trading decisions. The signal conditions are a combination of three indicators, and XQ Forex Indicator only display  medium and long-term trends . The ind
Fiyat tersine döndükçe ve geri çekildikçe piyasa yapısından elde edilen kâr değişir. Piyasa yapısını tersine çevirme uyarısı göstergesi, bir trendin veya fiyat hareketinin ne zaman tükenmeye yaklaştığını ve tersine dönmeye hazır olduğunu tanımlar. Genellikle bir geri dönüş veya büyük bir geri çekilme meydana gelmek üzereyken meydana gelen piyasa yapısındaki değişiklikler konusunda sizi uyarır. Gösterge, olası bir tükenme noktasının yakınında her yeni yüksek veya düşük oluştuğunda, başlangıçta
TrendLine PRO MT5
Evgenii Aksenov
4.78 (49)
The Trend Line PRO indicator is an independent trading strategy. It shows the trend change, the entry point to the transaction, as well as automatically calculates three levels of Take Profit and Stop Loss protection Trend Line PRO is perfect for all Meta Trader symbols: currencies, metals, cryptocurrencies, stocks and indices Advantages of Trend Line PRO Never redraws its signals The possibility of using it as an independent strategy It has three automatic levels Take Profit and Stop Loss lev
IX Power MT5
Daniel Stein
5 (1)
IX Power   nihayet FX Power'ın rakipsiz hassasiyetini Forex dışı sembollere getiriyor. En sevdiğiniz endeksler, hisse senetleri, emtialar, ETF'ler ve hatta kripto para birimlerindeki kısa, orta ve uzun vadeli eğilimlerin yoğunluğunu doğru bir şekilde belirler. Terminalinizin sunduğu   her şeyi analiz   edebilirsiniz. Deneyin ve işlem yaparken   zamanlamanızın   nasıl   önemli ölçüde iyileştiğini   deneyimleyin. IX Power Temel Özellikler 100 hassas, yeniden boyanmayan hesaplama sonuçları -
The Volume by Price Indicator for MetaTrader 5 features Volume Profile and Market Profile TPO (Time Price Opportunity). Get valuable insights out of currencies, equities and commodities data. Gain an edge trading financial markets. Volume and TPO histogram bar and line charts. Volume Footprint charts. TPO letter and block marker charts including split structures. Versatile segmentation and compositing methods. Static, dynamic and flexible ranges with relative and/or absolute visualizations. Lay
Quantum Heiken Ashi PRO MT5
Bogdan Ion Puscasu
4.5 (8)
Quantum Heiken Ashi PRO ile   tanışın Pazar eğilimleri hakkında net bilgiler sağlamak üzere tasarlanan Heiken Ashi mumları, gürültüyü filtreleme ve yanlış sinyalleri ortadan kaldırma yetenekleriyle ünlüdür. Kafa karıştırıcı fiyat dalgalanmalarına veda edin ve daha sorunsuz, daha güvenilir bir grafik sunumuna merhaba deyin. Quantum Heiken Ashi PRO'yu gerçekten benzersiz kılan şey, geleneksel şamdan verilerini okunması kolay renkli çubuklara dönüştüren yenilikçi formülüdür. Kırmızı ve yeşil çubukl
A key element in trading is zones or levels from which decisions to buy or sell a trading instrument are made. Despite attempts by major players to conceal their presence in the market, they inevitably leave traces. Our task was to learn how to identify these traces and interpret them correctly. Reversal First Impulse levels (RFI)   -  Version MT4                  INSTRUCTIONS                 RUS                 ENG                         R ecommended to use with an indicator   -  TREND PRO  
Was: $249  Now: $99   Market Profile defines a number of day types that can help the trader to determine market behaviour. A key feature is the Value Area, representing the range of price action where 70% of trading took place. Understanding the Value Area can give traders valuable insight into market direction and establish the higher odds trade. It is an excellent addition to any system you may be using. Inspired by Jim Dalton’s book “Mind Over Markets”, this indicator is designed to suit the
Dark Power MT5
Marco Solito
4.84 (56)
Dark Power  is an Indicator for intraday trading. This Indicator is based on   Trend Following  strategy, also adopting the use of an histogram to determine the right power . We can enter in good price with this Indicator, in order to follow the   strong trend   on the current instrument. The histogram is calculated based on the size of the bars and two moving averages calculated on the histogram determine the direction of the signal Key benefits Easily visible take profit/stop loss lines Int
Golden Gate Algo MT5
James David Lane
4 (6)
CHRISTMAS İÇİN %40 İNDİRİM! 1 OCAK'TA FİYATI $250'YE YÜKSELECEK! GoldenGate Entries Tanıtımı: Keskin Kenarlı Bir Ticaret Çözümü! GoldenGate Entries (GGE) ile ticarette devrim niteliğinde bir yaklaşım keşfedin. GGE, ticaret deneyiminizi yükseltmek amacıyla tasarlanmış gelişmiş bir gösterge olup kullanıcılara ticaret kararlarında hassasiyet ve güven sağlamak için kapsamlı bir özellik seti sunar. Çiftler: Herhangi biri (FX - Emtia - Hisse Senetleri - Hisse Senetleri - Kripto) Zaman Çerçeve
Gartley Hunter Multi
Siarhei Vashchylka
5 (5)
Gartley Hunter Multi - An indicator for searching for harmonic patterns simultaneously on dozens of trading instruments and on all classic timeframes: (m1, m5, m15, m30, H1, H4, D1, Wk, Mn). Manual (Be sure to read before purchasing) | Version for MT4 Advantages 1. Patterns: Gartley, Butterfly, Shark, Crab. Bat, Alternate Bat, Deep Crab, Cypher 2. Simultaneous search for patterns on dozens of trading instruments and on all classic timeframes 3. Search for patterns of all possible sizes. Fr
Yazarın diğer ürünleri
Sweet VWAP Anchored MT5
Francisco Gomes Da Silva
5 (3)
Tasaruf edin ve VWAP'lerle daha doğru kararlar verin Bu aracın gücünü test etmek istiyorsanız, ücretsiz MetaTrader 5 için bağlı VWAP göstergisini indirebilirsiniz. Bu gösterge bağımsız olarak çalışmanın yanı sıra aynı zamanda ücretsiz Sweet VWAP'in bir uzantısıdır. Çünkü ücretsiz sürüme tıkladığınızda, fare imlecinde gördüğünüz VWAP, bu gösterge olarak sabitlenecektir. Ve daha iyi anlamak için, sabitlenen şey bu göstergedir ve sahip olduğu tüm özelliklere sahiptir. Bu gösterge, MetaTrader 5 için
Sweet VWAP MT5
Francisco Gomes Da Silva
4.31 (13)
Büyük kurumların işlem yaptığı yerleri keşfedin ve VWAP Anchor Göstergesi ile yatırımlarınızı optimize edin Bu gösterge, VWAP Anchor stratejilerine uzmanlaşmış traderlar için tasarlanmış olup, fare imlecinizi kullanarak belirli çapa noktalarından VWAP'ın davranışını analiz etmek için hızlı bir şekilde işlem yapma olanağı sunar. Temel Özellikler: VWAP Anchorlama: Bu göstergenin temel işlevi, traderın seçtiği bir noktaya bağlanmış gibi VWAP'ın nasıl davranacağını göstermektir. Bu, farklı zaman per
FREE
Sweet VWAP Aux
Francisco Gomes Da Silva
4.25 (4)
Sweet VWAP Aux ile Zaman Kazanın ve Daha İsabetli Kararlar Verin Hala MetaTrader 4 için ücretsiz VWAP göstergemizi indirmediyseniz şimdi indirin ve sabit VWAP görselleştirme yeteneklerini deneyin. Daha sonra buraya dönün ve Sweet VWAP Aux'u keşfedin - Sweet VWAP göstergeniz için mükemmel bir eklenti. Tek bir tıklama ile, Sweet VWAP, VWAP göstergenizi seçtiğiniz noktada sabitlemenize olanak tanır, zamanınızı kurtarır ve manuel olarak yapılandırmaya gerek kalmadan işlem yapmanıza olanak sağlar. Ay
Supports And Resistances Lines MTF MT4
Francisco Gomes Da Silva
4.89 (9)
Destekler ve Dirençler, birkaç farklı zaman diliminde tepe ve dipleri otomatik olarak belirlemenize ve böylece mevcut tablo üzerinde bu tepe ve dipleri çizmenize yardımcı olmak için oluşturulmuştur. Dirençlerin oluşturulmasının açıklamasına geçelim. Üst ve alt kuralın ne olduğunu tanımlayabileceğiniz bir kural alanı vardır, üst kural varsayılan olarak şu şekilde ayarlanır: H[ 0 ]<=H[1] and H[ 1 ]=>H[ 2 ] Nerede: eleman Tanım H Yüksek    anlamına gelir [0] mevcut   mum  anlamına gelir [1] ö
FREE
VWAP With Alerts
Francisco Gomes Da Silva
5 (2)
Bu VWAP, basit bir VWAP'tir, ancak fiyatın basit VWAP'a dokunduğunda veya fiyatın VWAP'ı geçtiğinde bildirimler almanız için bu VWAP'a uyarılar ekledik. Bu gösterge, MetaTrader 5 (MT5) için geleneksel bir VWAP göstergesidir. Varsayılan parametreler normal VWAP'inki gibidir, ancak yeni hesaplamaları ve daha iyisini kullanma yeteneğiniz vardır: Fiyat VWAP'a dokunduğunda veya VWAP'ı geçtiğinde, bildirimler, cep telefonu bildirimleri, e-posta veya ses olayları aracılığıyla bilgilendirileceksiniz. Me
FREE
Paula Bollinger Bands
Francisco Gomes Da Silva
5 (1)
MetaTrader yatırımcı robotu için Uzman Danışman ile yatırım stratejinizi dönüştürün. Joe Ross tarafından oluşturulan ve ünlü Brezilyalı tüccar Rodrigo Cohen tarafından Paula olarak adlandırılan güçlü Bollinger Bantları stratejisine dayalı olarak, karınızı en üst düzeye çıkaracak ve risklerinizi en aza indirecek ileri teknolojiye erişebileceksiniz. Eski ve verimsiz stratejilerle daha fazla zaman kaybetmeyin. Yatırımcı robotumuzla, piyasa trendlerinin teknik analizini Joe Ross ve Rodrigo Cohen'
FREE
Bar Number
Francisco Gomes Da Silva
5 (2)
Mum sayacı Bu gösterge mumları sayar ve sayılarını daha uzun bir süreye göre gösterir daha büyük zaman çerçevesi Günlük zaman aralığını " Bigger Timeframe " olarak seçebilir ve en küçük zaman aralığına sahip olan grafikte çalıştırabilirsiniz. sayacın çubukları günlük çizelgeye göre sayacağını. Parametre olarak " H1 " zaman dilimini geçerseniz, gösterge H1 grafiğindeki çubukları nasıl sayacağını bilecektir, yalnızca daha küçük zaman dilimlerine sahip grafiklerde çalıştırması gerekir. Ana parametr
FREE
Sweet VWAP
Francisco Gomes Da Silva
3.67 (3)
Büyük kurumların işlem yaptığı yerleri keşfedin ve MetaTrader 4 için Ücretsiz Bağlı VWAP Göstergesi ile yatırımlarınızı optimize edin. Büyük kurumların işlem yaptığı fiyatı keşfedin - MetaTrader 4 için Ücretsiz Bağlı VWAP Göstergemizle! Şimdi, VWAP'lerinizi piyasanın tepelerine ve diplerine bağlı hale getirerek zamanınızı otomatik hale getirerek tasarruf edebilirsiniz. Ücretsiz sürümümüz, fare imlecinin grafikteki hareketini takip ederek VWAP'ı anında görüntülemenizi sağlar. Böylece, fiyatın VWA
FREE
VWAP With Alerts MT4
Francisco Gomes Da Silva
Bu VWAP basit bir VWAP'tir, ancak fiyatın VWAP çizgisine ulaştığında veya geçtiğinde bilgi veren bildirimler ekledik. Bu gösterge, MetaTrader 4 (MT4) için geleneksel bir VWAP göstergesidir. Varsayılan parametreler normal VWAP'inkilerdir, ancak VWAP hesaplamasını ve en iyisini değiştirme yeteneğine sahipsiniz: Fiyat VWAP'a dokunduğunda veya geçtiğinde, sizi uyarılar, cep telefonu bildirimleri, e-posta veya ses olayları aracılığıyla bilgilendirir. MetaTrader 4 için VWAP göstergesi . Parametreler:
FREE
OHLC Shifted
Francisco Gomes Da Silva
5 (3)
Önceki Günün Kapanışı ve MetaTrader için Bar Kaydırma! Önceki Günün Kapanışı ve Bar Kaydırma Göstergesi, teknik analizi ve işlem yapma kararlarınızı geliştirmek için tasarlanmış bir araçtır. Bu gösterge ile herhangi bir çubuğun açılış, maksimum, minimum ve kapanış seviyeleri hakkında ayrıntılı bilgilere erişebilir ve piyasa hareketlerinin doğru ve kapsamlı bir şekilde analizini yapabilirsiniz. Bir zaman aralığını diğerinin içine yerleştirebilme hayalini kurun, böylece mevcut zaman aralığınızda f
FREE
Rule Plotter
Francisco Gomes Da Silva
5 (4)
Kendi Stratejinizi Kendiniz Oluşturun Bu araç, MetaTrader'da doğal olarak kullanılabilen tüm göstergeleri ve internetten indirilen göstergeleri kullanarak stratejilerinizi geliştirmenizi sağlar. Bu göstergeler, verileri ekranda göstermek için bufferları kullanan göstergeleri içerir. Bu araç, ticaret stratejilerinizi otomatikleştirmek için MetaTrader'ı düşünmeniz için başka bir neden sunar. Bu araç sayesinde, herhangi bir MetaTrader göstergesini kullanarak strateji sinyallerinizi basit ve sezgise
FREE
Bu araç, konumlarınıza duraklar yerleştirir Metatrade Strateji Test Cihazı ile hızlıca test edin. Uzun bir pozisyon durumunda stopunuz son dipte olacaktır. Ya da kısa pozisyon durumunda stopunuz son zirvede olacaktır. Ayrıca, bu araç açık pozisyonlarınızın takibini yönetir. Durağınızı daima en son oluşan yüksek veya en son oluşan dibe yerleştirin üstleri ve dipleri oluşturmak için şu bağlantıdan indirilebilen ücretsiz "Destekler ve Dirençler Çizgileri" göstergesini kullanıyorum: metatrade
Stop Loss Pozisyonlama İçin Price Action'un Risk Yönetimi Gücünü Keşfedin! Giriş noktasını tam olarak bildiğiniz ancak çıkış için doğru zamanı seçmekte kararsız kaldığınız durumu yaşadınız mı? Endişelenmeyin, yalnız değilsiniz! Birçok trader günlük olarak bu zorluğa katlanıyor. İyi haber şu ki, price action temelli risk yönetimi aracımız bu sorunu çözmek için burada. Siz ideal giriş noktalarını belirlemeye odaklanırken, aracımız sizin için çıkışı kontrol altına alıyor. Price action temelli risk
Auto Anchored VWAPs
Francisco Gomes Da Silva
Otomatik Bağlı VWAP'lar ile Ticaretteki İçgörüleri Keşfedin: Otomatik Bağlı VWAP'lar , ticaret dünyasında rehberiniz olarak hizmet eder. Bu göstergeler, kritik piyasa dönüm noktalarını belirler ve VWAP çizgilerini kullanarak grafiğinizde gösterir. Bu, bağlı VWAP stratejilerini kullanan tüccarlar için bir oyun değiştiricidir. Nasıl Çalışır? Yüksek Noktaları Tanımlama: Eğer mevcut mumun en yüksek fiyatı önceki mumun en yüksek fiyatından düşükse, Ve önceki yüksek, ondan öncekinden daha yüksekse, Bi
FREE
Auto Anchored VWAPs MT4
Francisco Gomes Da Silva
5 (1)
Otomatik Bağlı VWAP'lar ile Ticaretteki İçgörüleri Keşfedin: Otomatik Bağlı VWAP'lar , ticaret dünyasında rehberiniz olarak hizmet eder. Bu göstergeler, kritik piyasa dönüm noktalarını belirler ve VWAP çizgilerini kullanarak grafiğinizde gösterir. Bu, bağlı VWAP stratejilerini kullanan tüccarlar için bir oyun değiştiricidir. Nasıl Çalışır? Yüksek Noktaları Tanımlama: Eğer mevcut mumun en yüksek fiyatı önceki mumun en yüksek fiyatından düşükse, Ve önceki yüksek, ondan öncekinden daha yüksekse, Bi
FREE
Bar Counter MT4
Francisco Gomes Da Silva
5 (6)
şamdan sayaç göstergesi bu gösterge, herhangi bir zaman diliminde yer alan mumları sayar mt4'te indirebileceğiniz ücretsiz bir bar sayacı şamdan sayacı, daha büyük bir grafiğin içinde kaç mum olduğunu sayar Bu mum sayacıyla otomatik mum sayımı yapabilirsiniz Çubukları otomatik olarak indirip saymanız için ücretsiz şamdan sayım göstergesi bar counter to count the bars count candle counter indicator mt4 count candle MT5 için mum sayacı Bu göstergeyle ilgileniyorsanız, onu geliştirmeye devam edebil
FREE
Rule Plotter MT4
Francisco Gomes Da Silva
5 (1)
Rule Plotter ile Otomatik Ticaret Robotu Nasıl Oluşturulur Sadece birkaç fare tıklaması ile ticaret stratejilerinizi otomatikleştirebilmenin ne kadar güçlü olabileceğini hiç düşündünüz mü? Karmaşık kodlara dalmadan farklı ticaret stratejilerini oluşturup test etmenin özgürlüğünü hayal edin. Rule Plotter ile bu vizyon gerçek oluyor. Burada kendi özel ticaret robotunuzu nasıl oluşturabileceğinizi ve Rule Plotter'ı kullanarak ticaret sistemi oluşturmayı keşfedeceğiz, tüm süreci basitleştiren bir ti
FREE
Rule Plotter Scanner
Francisco Gomes Da Silva
Hiç düşündün mü, tüm stratejileri tarayan ve bu varlığın tüm zaman dilimlerinde alım ve satım noktalarını gösteren bir tarayıcıya sahip olmayı? İşte tam olarak bu tarayıcı bunu yapar. Bu tarayıcı, Rule Plotter: programlama olmadan strateji oluşturucu 'da oluşturduğunuz alım ve satım sinyallerini göstermek ve bunları farklı varlıklarda ve zaman dilimlerinde çalıştırmak için tasarlanmıştır. Rule Plotter'ın varsayılan stratejisi yalnızca yükselen ve düşen mumlardır; yani Rule Plotter içinde herhang
FREE
Paula Bollinger Bands Strategy
Francisco Gomes Da Silva
4 (2)
Bollinger bands out/in strategy A strategy created by Joe Ross, and very useful for finding trades when the market is overloaded. Indicator You don't need to find where there are entries on the chart, this indicator shows them for you. The entrance The trade is confirmed when the price closes outside the bollinger bands on a candle and the candle after the price closes inside the bands. comment I want to improve this indicator, so you can help me sending me your reviews and comments, thanks :).
FREE
My Candle Patterns
Francisco Gomes Da Silva
5 (1)
Bu gösterge, buradan indirilebilen My Candle Complete'in bir demo sürümüdür: Candle Patterns Creator Tam sürümü ile kendi candle kurallarınızı oluşturabilir ve stratejinize göre geleneksel candle desenlerini daha doğru hale getirebilirsiniz. Gösterge, birkaç örnek candle kuralı içerir, ancak burada sadece bazılarını göstereceğim: Pattern Rule Candle Green C > O Candle Red C < O Doji C = O Hammer (C > O and (C-O) *2 < O-L and (C-O) *0.5 > H-C) or (C < O and (O-C) *2 < C-L and (O-C) *0.5 > H-O) Ha
FREE
Fibonacci on ZigZag
Francisco Gomes Da Silva
4.93 (15)
Mouse You can draw fibonaccis moving the mouse over the zigzag indicator Pin them You can click on fibonacci with this option and it will no longer be deleted unless you click on it again :) Precision The tuned fibonacci gets the precise point in lower timeframes Enjoy it You can ask me for add more features, so please comment and leave your ranting for me to be happy, thank you :)
FREE
First Bar
Francisco Gomes Da Silva
Ticaret Sistemi İşlem yapacağınız gün bir çubuk seçerseniz, bu çubuk kapandığında robot en yüksekte ve mumun en altında iki emir gönderir, bu da tekrar alırsa diğeri iptal edilir Kayıp Durdur durdurma, satın alma durumunda en düşük seviyenin bir tık altında veya satış durumunda en yüksek seviyenin bir tık üstünde olacaktır Kâr Al StopLoss aralığından ne kadar almak istediğinizi ayarlayabilir, strateji optimizasyonunda özelleştirebilirsiniz Otimizasyon Bu robot, risk getirisi elde etmek için gird
FREE
Rule Plotter Expert
Francisco Gomes Da Silva
5 (1)
Bu Uzman Danışman, Rule Plotter göstergesi içinde oluşturduğunuz stratejilerinizi test etmek ve çalıştırmak için tasarlanmıştır. Nasıl Kullanılır: Rule Plotter - Programlama bilgisi olmadan ticaret sistemi oluşturmak için araç göstergisini ücretsiz indirin. Ardından, Rule Plotter göstergisinin içindeki stratejilerinizi geliştirin. Son olarak, bu Uzman Danışmanı kullanarak oluşturduğunuz stratejileri çalıştırın. Parametreler: Strateji: Rule Plotter göstergisi içinde oluşturduğunuz ticaret sistemi
OHLC Shifted MT4
Francisco Gomes Da Silva
5 (2)
Önceki Günün Kapanışı ve MetaTrader için Bar Kaydırma! Önceki Günün Kapanışı ve Bar Kaydırma Göstergesi, teknik analizi ve işlem yapma kararlarınızı geliştirmek için tasarlanmış bir araçtır. Bu gösterge ile herhangi bir çubuğun açılış, maksimum, minimum ve kapanış seviyeleri hakkında ayrıntılı bilgilere erişebilir ve piyasa hareketlerinin doğru ve kapsamlı bir şekilde analizini yapabilirsiniz. Bir zaman aralığını diğerinin içine yerleştirebilme hayalini kurun, böylece mevcut zaman aralığınızda f
FREE
Rule Plotter Expert MT4
Francisco Gomes Da Silva
5 (1)
Rule Plotter Göstergesi ile Oluşturduğunuz Stratejileri Rule Plotter Uzmanı ile Uygulayın: Artık Rule Plotter Göstergesi'ni kullanarak özelleştirilmiş stratejilerinizi oluşturdunuz ve grafikte giriş ve çıkış noktalarını gösteren okları gördünüz, şimdi bu stratejileri finansal piyasalarda hayata geçirmenin zamanı geldi. Rule Plotter Uzmanı ile bu oklar temel alınarak otomatik ve kesin bir şekilde işlem yapabilir, stratejilerinizin potansiyelini en üst düzeye çıkarabilirsiniz. Okları Eyleme Dönüşt
Hide Scale
Francisco Gomes Da Silva
5 (1)
Ekranınızda Daha Fazla Alan İsteyen Traderlar İçin Gizle Ölçek Aracı Talimatlar Zaman ölçeğini gizlemek için "T" tuşuna, fiyat ölçeğini gizlemek için "P" tuşuna basın. Bu tuşları özelleştirebilirsiniz, ilgili düğmeye tıklayarak ve klavyedeki yeni bir tuş girerek. Her iki seçeneğe de aynı tuşu atayarak her iki ölçeği aynı anda gizleyebilirsiniz. Ölçekleri yeniden göstermek için sadece ilgili tuşa tekrar basın. Neden Bu Aracı Oluşturduk Biz, Tatlı VWAP göstergemizi kullanan traderlara daha fazla e
FREE
Pattern Wizard
Francisco Gomes Da Silva
Patterns Wizard, candlestick desenleri oluşturmak için bir araçtır. Bu araçla çeşitli farklı desenler oluşturabilir ve grafiğinizde istediğiniz kadar bu göstergeye ait örneği ekleyebilirsiniz, her biri farklı bir desenle. Oluşturma formüllerinin nasıl çalıştığını daha iyi anlamak için   70'ten fazla candlestick deseni örneği içeren My Candle göstergesinden örnekleri alabilirsiniz. Bu göstergenin temel farkı 30 kural parametresine sahip olmasıdır, bu da her biri önceki 30 mum için farklı bir kura
FREE
Hide Scale MT4
Francisco Gomes Da Silva
5 (2)
Grafik Alanını Maksimize Etmek İsteyen Tüccarlar İçin İdeal Aracı - Hide Scale Hide Scale Nasıl Kullanılır Zaman ölçeğini gizlemek için "T" tuşuna basın ve fiyat ölçeğini gizlemek için "P" tuşuna basın. Her iki seçeneği aynı anda gizlemek isterseniz, her iki seçenek için aynı tuşu atayabilirsiniz. Ölçekleri yeniden görüntülemek için ilgili tuşa tekrar basmanız yeterlidir. Bu Aracın Oluşturulmasının Nedeni Sweet VWAP göstergemizi kullanan tüccarlara, ticaret ekranlarında kullanılabilir alanı maks
FREE
TrendPlator
Francisco Gomes Da Silva
TrendLines Plator: Gelişmiş Eğilim Projeksiyon Göstergesiyle Ticaret Stratejilerinizi Güçlendirin Yenilikçi göstergemizin potansiyelini keşfedin! Daha geniş zaman aralıklarındaki eğilim çizgilerini doğrudan mevcut zaman aralığınıza analiz edebilme ve projekte edebilme yeteneği, genel olarak tüccarların dikkatini çeken stratejik bir destek sunar. Bu noktalar, işlemleriniz için stratejik destek veya direnç seviyelerine dönüşür ve ticaret stratejinizi güçlendirir. Price action göstergeleri koleksiy
Patterns Wizard, candlestick desenleri oluşturmak için bir araçtır. Bu araçla çeşitli farklı desenler oluşturabilir ve grafiğinizde istediğiniz kadar bu göstergeye ait örneği ekleyebilirsiniz, her biri farklı bir desenle. Oluşturma formüllerinin nasıl çalıştığını daha iyi anlamak için   70'ten fazla candlestick deseni örneği içeren My Candle göstergesinden örnekleri alabilirsiniz. Bu göstergenin temel farkı 30 kural parametresine sahip olmasıdır, bu da her biri önceki 30 mum için farklı bir kura
Filtrele:
clive dawson
57
clive dawson 2024.04.17 17:07 
 

good

Frederic Jacques Collomb
1002
Frederic Jacques Collomb 2024.04.11 11:11 
 

Good indicator, many settings. Thanks

gnanos123
535
gnanos123 2024.02.07 17:25 
 

It Works

Francisco Gomes Da Silva
71508
Geliştiriciden yanıt Francisco Gomes Da Silva 2024.02.07 17:32
Thanks for your review :)
danieltickmaill
24
danieltickmaill 2024.01.01 21:38 
 

I love this indicator and a very good one. Thanks to this developer.👌

Francisco Gomes Da Silva
71508
Geliştiriciden yanıt Francisco Gomes Da Silva 2024.01.01 23:25
thank you very munch for your review Daniel, it is great to hear this indicator can be useful
Marco Engstermann
855
Marco Engstermann 2023.12.19 06:43 
 

Very nice , Thank you

Francisco Gomes Da Silva
71508
Geliştiriciden yanıt Francisco Gomes Da Silva 2023.12.20 01:06
Thank you very munch for take a time to give me your review Marco, it is very important to me
Quoc Trieu Le
121
Quoc Trieu Le 2023.12.05 13:06 
 

Very useful, thank you very much!

Francisco Gomes Da Silva
71508
Geliştiriciden yanıt Francisco Gomes Da Silva 2023.12.06 04:00
thank you very much Quoc, it is very good receive your great review
tz.traderfx
54
tz.traderfx 2023.12.05 09:12 
 

Excellent!!!

Francisco Gomes Da Silva
71508
Geliştiriciden yanıt Francisco Gomes Da Silva 2023.12.06 03:59
thanks :)
zatami
22
zatami 2023.11.24 13:12 
 

Thank you for developing this great tool. I love it. I wish it had full line that is not a dotted line for the SnR. That would make it greater. Well-done all the same, and cheers.

Additional Review and Comment: 8th December 2023: Yes, Francisco. Man, your reply opened my eyes on how to get it to display SnR Lines instead of the Dots. Waow. You continue to amaze me on this tool. It has shortened my time on drawing the SnR manually, and upon that it's an MTF which makes it much easier for one to read the MTF waves.

Man, if there's a way of giving more than 5 Stars, I'll do so. Well done. Great.

Francisco Gomes Da Silva
71508
Geliştiriciden yanıt Francisco Gomes Da Silva 2023.11.24 18:03
Thanks for your great review zatami, by the way it is already implemented, use the input Display Mode as "LINE"
Peter Bačinský
18
Peter Bačinský 2023.11.01 05:47 
 

Very useful, thanks.

Francisco Gomes Da Silva
71508
Geliştiriciden yanıt Francisco Gomes Da Silva 2023.11.01 08:56
Thank you for your review Perter
tundeiab Abiola
24
tundeiab Abiola 2023.10.18 14:44 
 

Beautiful indicator. Thank you

Francisco Gomes Da Silva
71508
Geliştiriciden yanıt Francisco Gomes Da Silva 2023.10.18 21:54
A big thank you for your review Tundeiab Abiola
sinh927
117
sinh927 2023.10.16 04:44 
 

When the time frame is set to 4 Hours or 1 Hour, too many lines are displayed, making it difficult to use. Many of the lines do not match what I think of as lines.

Francisco Gomes Da Silva
71508
Geliştiriciden yanıt Francisco Gomes Da Silva 2023.10.16 16:02
Hello Sinh, thank you very much for your feedback. These lines are a new feature and work exceptionally well when used with larger timeframes, such as monthly or weekly. I have made an update to version 1.21 that will set the input display mode to use buffers by default, which is recommended for smaller timeframes, such as D1.
timoor
14
timoor 2023.10.10 01:32 
 

Thank you, I am a beginner and I use it to learn on a demo account

Francisco Gomes Da Silva
71508
Geliştiriciden yanıt Francisco Gomes Da Silva 2023.10.10 02:30
It's great to know that you're starting as a trader now and have found my indicator useful. Welcome to the market! I hope this indicator can be helpful for your analyses. Happy studying, and a big thank you for your review. :)
Thaer Barakat
28
Thaer Barakat 2023.10.07 07:29 
 

great .. thank you

Francisco Gomes Da Silva
71508
Geliştiriciden yanıt Francisco Gomes Da Silva 2023.10.07 13:58
I am grateful for your review, Thank you!!!
Martin Rhyner
23
Martin Rhyner 2023.09.28 09:40 
 

Great Indicator. Thanks a lot for this!

Francisco Gomes Da Silva
71508
Geliştiriciden yanıt Francisco Gomes Da Silva 2023.09.28 14:52
You are Welcome many thanks for your review!
51323997
104
51323997 2023.09.07 15:19 
 

It is very helpful

Francisco Gomes Da Silva
71508
Geliştiriciden yanıt Francisco Gomes Da Silva 2023.09.07 16:42
Many thanks :) Combine this indicator with 'sweet vwap' is a tip ;)
xlxAxlx
712
xlxAxlx 2023.08.23 13:15 
 

Thank you ...

Francisco Gomes Da Silva
71508
Geliştiriciden yanıt Francisco Gomes Da Silva 2023.08.23 13:54
Thank you for your review ... :)
Jerry Slagger
65
Jerry Slagger 2023.08.22 19:48 
 

One of the best Support and Resistance indicators I have ever used. You can add it to the chart as many times as you need, thus showing different timeframe s/r levels. Thank you for this awesome free indicator!!!

Francisco Gomes Da Silva
71508
Geliştiriciden yanıt Francisco Gomes Da Silva 2023.08.22 22:41
Jerry, your review means a lot! Your shared experience is incredibly valuable for others considering this indicator. I'm truly thrilled that you've found it useful. Your feedback brings me a lot of happiness. Thank you!
Agus Putu Gede Wira Adnyana
296
Agus Putu Gede Wira Adnyana 2023.07.18 16:47 
 

best after all bro..

Francisco Gomes Da Silva
71508
Geliştiriciden yanıt Francisco Gomes Da Silva 2023.07.19 16:10
Thank you so much for taking the time to provide me with your incredibly gratifying review, Bro. This indicator utilizes price action and reflects some of what I've learned about market waves. Thank you again for your gratifying review.
joseverasay
284
joseverasay 2023.06.29 03:14 
 

Muy útil gracias

Francisco Gomes Da Silva
71508
Geliştiriciden yanıt Francisco Gomes Da Silva 2023.06.29 13:57
Hola Joseverasay, te agradezco por dedicar tiempo a evaluar mi indicador y compartir tu opinión. Me alegra saber que el indicador te ha sido útil para identificar niveles de soporte y resistencia en tus análisis de mercado. Espero que el indicador siga aportando valor a tu estrategia de negociación y que puedas utilizarlo para tomar decisiones informadas en tus operaciones. Los niveles de soporte y resistencia tienen una base sólida en el análisis técnico y son una parte importante del price action. Una vez más, gracias por tu evaluación y espero que sigas encontrando éxito en tus negocios.
Chello Trader
72
Chello Trader 2023.06.25 20:02 
 

Muito obrigado Francisco !!! Eu aplico o conceito de Máx, Mín e 50% com renovações e esse seu indicador veio do céu para minha vida !!! Meu gráfico é completamente limpo e uso uma configuração do cores no seu indicador como sombras ( discreto ). Fico imaginando como será a nova geração desse indicador que vc esteja projetando. Sua inteligencia foi Deus quem te deu. Vc é fera !!! Quem opera SMC como eu esse indicador serve como uma luva !!! Maravilha...Obrigado !!!!

Francisco Gomes Da Silva
71508
Geliştiriciden yanıt Francisco Gomes Da Silva 2023.06.26 17:06
Muito Obrigado pelas palavras e pelo tempo que você tirou pra me dar essa valiosíssima review, eu também gosto de graficos limpos e price action na veia, porém tenho que confessar que o indicador de vwaps ancoradas dar pontos quase que perfeitos se você combinar com esse daqui, e além disso você podem se aliar com seu ponto de entrada de 50% com a vwap ancorada e com isso ganhar mais confiança que é hora de entrar, pois as vwaps ancoras normalmente convergem para a entrada de 50% da onda, ela é gratuita também e você pode conhece-la aqui: https://www.mql5.com/pt/market/product/95987 e já que você gosta de price action então eu também gostaria que você conhecesse os meus outros indicadores: https://www.mql5.com/pt/users/franciscogomes5/seller espero que eles possa ser uteis para te dar mais confiança ainda sobre o ponto de entrada de suas operações, e mais uma vez muito obrigado por sua review fiquei muito contente em conhecer um pouquinho de sua estratégia e saber que esse indicador se aliou com ela, fica com Deus e bons trades!!
12
İncelemeye yanıt
Sürüm 1.26 2023.11.24
- Görünmeyen çizgilerin hatası düzeltilmiştir.
- Tüccar, parametreler aracılığıyla belirtilen zaman çerçevesinden daha büyük bir zaman çerçevesine geçtiğinde tamponlardan çöp kaldırıldı.
Sürüm 1.25 2023.11.23
+ Çizgi stili için giriş
+ Çizgi genişliği için giriş
Sürüm 1.24 2023.11.21
"buffer" tasarımı için giriş
Sürüm 1.23 2023.11.20
Bu sürümde daha fazla uyarı eklendi:
- Fiyat destek veya dirence dokunduğunda uyarı
- Mum direncin üzerinde kapandığında uyarı
- Mum destek altında kapandığında uyarı
Sürüm 1.22 2023.10.29
Daha fazla görüntüleme modu, şimdi aşağıdakiler arasında seçim yapabilirsiniz:

- Tampon
- Çizgi
- Işın (geçerli zaman aralığı içinde daha büyük zaman aralıklarından gelen çizgileri göstermek için kullanışlı)
- Tampon ve Çizgiler
- Tampon ve Işın

Varsayılan olarak tampondur, çünkü daha hızlıdır ve "Rule Plotter" Göstergesi içinde kullanmak için uygundur.
Sürüm 1.21 2023.10.16
Önceki sürümde varsayılan "çizgiler" parametresi, D1'den daha kısa zaman dilimlerinde çok fazla karmaşaya neden oluyordu. Bu nedenle, şimdi sadece tamponları varsayılan olarak ayarlıyoruz. Bu arada, daha büyük bir zaman dilimi, örneğin aylık zaman dilimini manuel olarak yapılandırabilir ve "Çizgiler" görüntüleme modunu ayarlayabilirsiniz, bu harika çalışacaktır. Bu girişleri nasıl yapılandıracağınızı görmek için açıklamadaki resimlere bakınız.
Sürüm 1.20 2023.10.11
Çok fazla satır hatasını düzelt.
Sürüm 1.19 2023.10.10
Grafik henüz tüm çubukları yüklemediğinde ve gösterge zaten verilerini hesaplamaya başladığında, birçok hatı bırakan hatayı düzeltin, ve bu sizin sürümünüzde olursa.

Mevcut zaman dilimleri girildiğinde Çizgiler özelliklerini ekleyin.
Sürüm 1.18 2023.10.07
Gerçek hatları ekleyin; önce sadece tamponlar vardı, ancak şimdi hatları, tamponları veya her ikisini de kullanarak istediğiniz görünümü seçebilirsiniz.
Sürüm 1.17 2023.04.24
- Tepeler tamponu eklendi
- Dip tamponu eklendi
Sürüm 1.16 2023.03.26
- MTF Destekleri:
- Zaman Çerçevesi M1
- Zaman Çerçevesi M2
- Zaman Çerçevesi M3
- Zaman Çerçevesi M4
- Zaman Çerçevesi M5
- Zaman Çerçevesi M6
- Zaman Çerçevesi M10
- Zaman Çerçevesi M12
- Zaman Çerçevesi M15
- Zaman Çerçevesi M20
- Zaman Çerçevesi M30
- Zaman Çerçevesi H1
- Zaman Çerçevesi H2
- Zaman Çerçevesi H3
- Zaman Çerçevesi H4
- Zaman Çerçevesi H6
- Zaman Çerçevesi H8
- Zaman Çerçevesi H12
- Zaman Dilimi 1 Gün
- Zaman Çerçevesi 1 Hafta
- Zaman Çerçevesi 1 Ay
Sürüm 1.15 2023.03.22
- Tamponların azaltılması, artık aynı göstergenin diğer örneklerini parametre aracılığıyla MTF zaman çerçevesini seçerek tabloya yerleştirebilirsiniz.
- Günlük grafiğin ilk üst veya alt kısmı mevcut grafiğin ilk çubuğunun arkasında olduğunda ortaya çıkan bir hata düzeltildi
Sürüm 1.14 2023.03.21
- Uyarı mesajlarına Zaman Çerçevesi ekleyin
Sürüm 1.13 2023.03.20
- Geçerli dönem zikzaklarını açmak/kapatmak için düğme ekle
Sürüm 1.12 2023.03.20
- Geçerli zaman dilimine zikzak ekleyin
Sürüm 1.11 2023.03.19
- Günlük zaman diliminde zig zag ekleyin
Sürüm 1.10 2023.03.18
- Günlük zaman diliminde zig zag ekleyin
Sürüm 1.9 2023.03.17
- Hata çözüldü
Sürüm 1.8 2023.03.16
- Geçerli grafik için açma ve kapama düğmesi
- Günlük grafik için açma ve kapama düğmesi
Sürüm 1.7 2023.03.13
Günlük grafik üstlerini ve altlarını aramak için MTF desteği Eklendi
Sürüm 1.6 2023.03.11
Değil operatörü için destek eklendi
!
Sürüm 1.5 2023.03.10
Eşit değil için destek eklendi
!=
Sürüm 1.3 2023.03.09
Eklemek:
-Sesli Uyarılar
-Metatrader'daki Uyarılar
-Mobil Bildirim Uyarıları
-E-posta Uyarıları
Sürüm 1.2 2023.03.08
Matematik kuralları için parantez desteği eklendi, örneğin:
(değer + operatör + değer) and (değer + operatör + değer)
Sürüm 1.1 2023.03.07
- Direnç için kural parametreleri eklendi
- Ek destek için kural parametreleri