Wick Fill Trend Screener
- Indikatoren
- Javier Morales Fernandez
- Version: 1.0
- Aktivierungen: 5
Was ist ein Docht im Handel? Wie funktioniert dieser Screener?
Ein Docht in einer Kerze spiegelt eine Ablehnung im Preis wider. Dieser Screener versucht, Dochte zu identifizieren, die ein großes Potenzial haben, gefüllt zu werden. Dieser Screener konzentriert sich auf die Dochte, die im Trendmarkt auftreten.
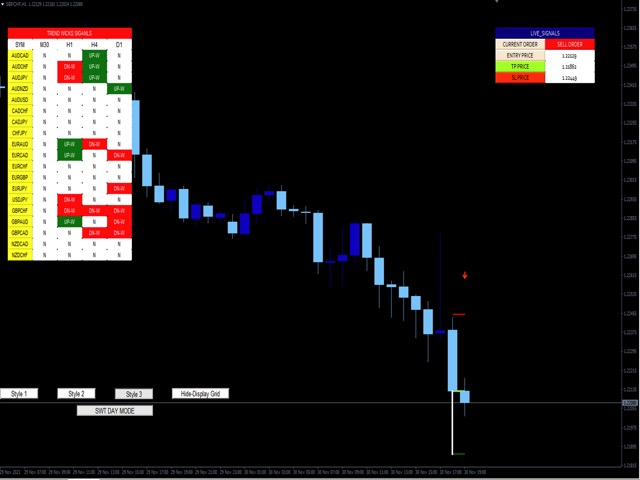
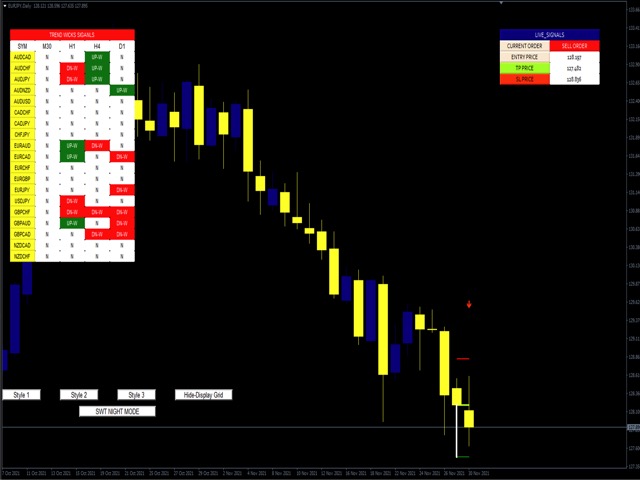
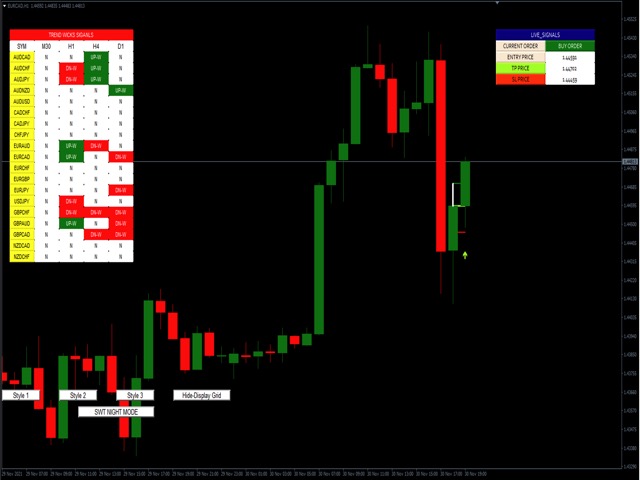
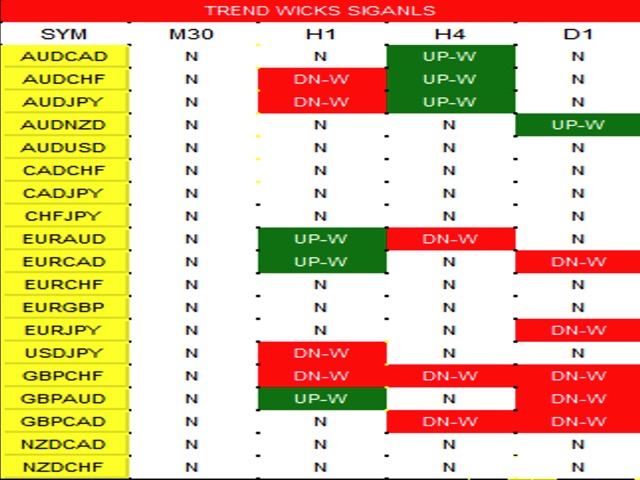
Der Screener zeigt ein Dashboard an, das einen Gesamtüberblick über die potenziellen Dochte bietet, die live gehandelt werden. Es zeigt ALLE Paare/Instrumente nach Zeitrahmen geordnet an. Kaufgelegenheiten werden als "UP-W." bezeichnet. Sie erscheinen grün auf dem Dashboard, und die Verkaufschancen heißen "DN-W" und erscheinen in Rot. Händler müssen auf dem Dashboard, das auf dem Bildschirm angezeigt wird, auf die gewünschte Docht-Opportunity klicken, und der Screener zeigt diesen spezifischen Handel an. Der Screener zeigt Gelegenheiten an, die auf den von den Händlern gewählten Eingaben basieren. Beachten Sie, dass Instrumente wie Gold oder US30 in der Regel je nach Broker unterschiedliche Kontraktgrößen haben. Bitte versuchen Sie, Paare oder Instrumente mit derselben Kontraktgröße zu verwenden. Andernfalls wird eines der Kontraktgrößenpaare/Instrumente kein Signal anzeigen.
-Eingaben
Trend-Dochte: Diese Eingabe bestimmt die Dochtgröße, die der Indikator scannen muss. Sie wird in % gemessen. Standardmäßig sind es 20 %.
-Anzahl der Signale: Hier wird die Anzahl der Signale angegeben, die für den Erfolgsratensimulator gescannt werden.
-Gleitender Durchschnitt: Dieser Filter ist eine Kombination aus dem Indikator des gleitenden Durchschnitts und dem RSI. Die Benutzer haben die Möglichkeit, RSI und gleitenden Durchschnitt nach ihren eigenen Bedürfnissen einzustellen.
-Vorherige Balkenrichtung: Mit dieser Funktion wird das Signal auf der Grundlage der vorherigen Kerze entweder vermieden oder zugelassen. Wenn es wahr ist, wird der Indikator NUR Dochte als Signale berücksichtigen, wenn die vorherige Kerze in dieselbe Richtung des Trends geht. Wenn sie falsch ist, werden alle Dochte berücksichtigt.
Letzte höhere Hochs, niedrigere Tiefs Balken: Diese Funktion ermöglicht es Händlern, nach den letzten höheren Hochs und niedrigeren Tiefs in den letzten "x" Balken zu suchen, um eine Range-Periode zu vermeiden.
-Minimale Kerzengröße: Diese Eingabe ist für die minimale Balkengröße, die der Indikator beim Scannen von Dochten berücksichtigt.
-Maximale Kerzengröße: Diese Eingabe ist die maximale Bargröße, die der Indikator bei der Suche nach Dochten berücksichtigt.
Stop-Loss-Verhältnis: Standardmäßig entspricht der Stop-Loss der HH oder LL der Kerze der Signalkerze. Mit dieser Funktion kann der Benutzer einen größeren oder kleineren Stop-Loss auf der Grundlage des Dochtsignals festlegen. Wählt der Benutzer z.B. 2, wird der Stop-Loss auf der Grundlage des Dochts der Kerze verdoppelt.
-Paarliste: Diese Einstellung legt fest, welche Paare/Instrumente auf dem Screener angezeigt werden sollen. Bitte beachten Sie das folgende Format: EURUSD, AUDCAD, GBPNZD
*Sie können Präfix oder Suffix verwenden, wenn Ihre Brokerliste diese verwendet.
Alarm-Einstellung: Dieser Indikator verfügt über Alarme, die an Ihr mobiles Gerät gesendet werden können, wodurch der Alarm und die Push-Benachrichtigungen aktiviert werden. Um das Signal von der Hand zu Ihrer App zu erhalten, müssen die Benutzer zunächst die Metaquotes-ID unter Einstellung>Chat und Nachricht> in Ihrer MetaTrader-App abrufen. Gehen Sie dann in der Desktop-Version zu Extras>Optionen>Benachrichtigungen ----- und geben Sie dort die Metaquotes-ID ein. Sie erhalten dann eine Benachrichtigung über ein Live-Signal.
Probieren Sie Wick Fill Trend aus, wenn Sie Strategien testen oder ein Symbol hier verwenden möchten: