UPD1 Murrey Math Levels
FREE
Veröffentlicht:
21 August 2020
Aktuelle Version:
1.36
Keinen passenden Roboter gefunden?
Geben Sie Ihren Eigenen in Auftrag
auf Freelance!
Gehen Sie zu Freelance
Geben Sie Ihren Eigenen in Auftrag
auf Freelance!
Wie man einen Roboter oder Indikator kaufen kann
Starte Deinen EA im
Virtual Hosting
Virtual Hosting
Teste einen Indikator/Roboter vor dem Kauf
Möchtest Du Geld im Market verdienen?
Wie man Produkte richtig präsentiert
Sie verpassen Handelsmöglichkeiten:
- Freie Handelsapplikationen
- Über 8.000 Signale zum Kopieren
- Wirtschaftsnachrichten für die Lage an den Finanzmärkte
Registrierung
Einloggen
Sie stimmen der Website-Richtlinie und den Nutzungsbedingungen zu.
Wenn Sie kein Benutzerkonto haben, registrieren Sie sich
Hi,
please please add the possibility to change the colors of the level. I mean i want to choose the colors 100% freely for every single level, like this:
Hi,
please please add the possibility to change the colors of the level. I mean i want to choose the colors 100% freely for every single level, like this:
Can you do this please? :) Thank you
Hi. This change will not be convenient for everyone. Being a developer, you often have to choose popular solutions. But I'll think about it.
Hi. This change will not be convenient for everyone. Being a developer, you often have to choose popular solutions. But I'll think about it.
I just want to be able to set this up like in Murreys book. I like to follow the master himself. I want to color the levels to represent the probability of each level. See here:
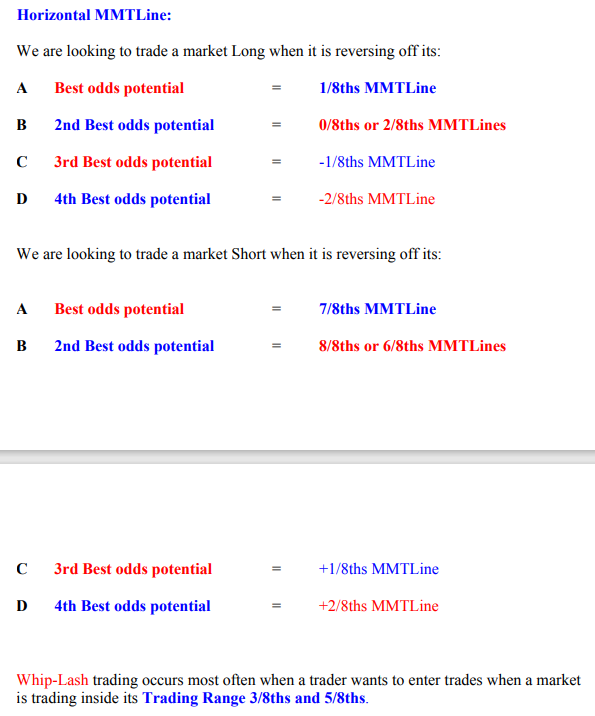
Wouldn´t it make sense to color code the levels based on the explanations above?
My videos, screenshots of the theory in the blog have the coloring that is now. I don't see the point in changing anything. Don't get me wrong. One change will entail a series of inconsistencies.
I think your book has a free publisher's coloring. The author did not have color levels. Tk the colors that I gave, from many years of experience.I think i have found a bug. Please open the indicator in AUDCAD M15 chart. You should see this:
As you see on the screenshot, the indicator draws numbers in wrong places... Thank you
Hello. I don't see a mistake. Draw on the screenshot what you think is wrong. And then show an example of how to correctly.
The indicator uses the classic Murray levels formula, which is available in the source code here on the codebase website.
Hello. I don't see a mistake. Draw on the screenshot what you think is wrong. And then show an example of how to correctly.
The indicator uses the classic Murray levels formula, which is available in the source code here on the codebase website.
You are totally right Vitaliy. I am tired today. I saw something which is not there. :) EVERYTHING is fine. You are right. Sorry for that.
HI Vitaliy
I follow your information and add Murrey combo with the 2 other tools (pixel and level)
for use mostly in M1 (sometimes in M5) what is your advice for the 2 parameters ? (period Length)
Thanks a lot
warmly
for use mostly in M1 (sometimes in M5) what is your advice for the 2 parameters ? (period Length)
The default period 128 is the best for any timeframe. The second parameter - length - is just a visual
The default period 128 is the best for any timeframe. The second parameter - length - is just a visual
Thanks so much for so quick response, warmly