• Übersicht
  • Bewertungen (2)
  • Diskussion (3)
  • Neue Funktionen

MultiCharts MT4

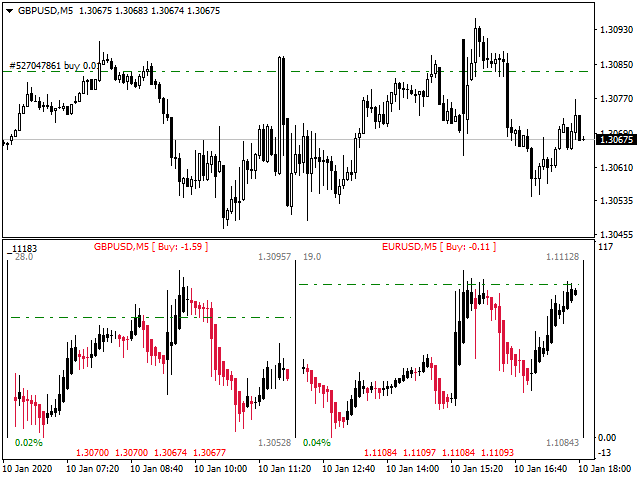
MultiCharts ist ein Mehrwährungsindikator zur visuellen Analyse mehrerer Handelsinstrumente

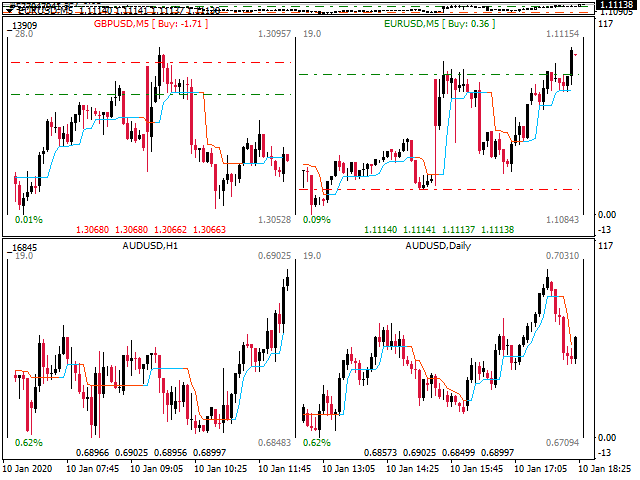
  • erstellt Diagramme der ausgewählten Instrumente in einem separaten Fenster
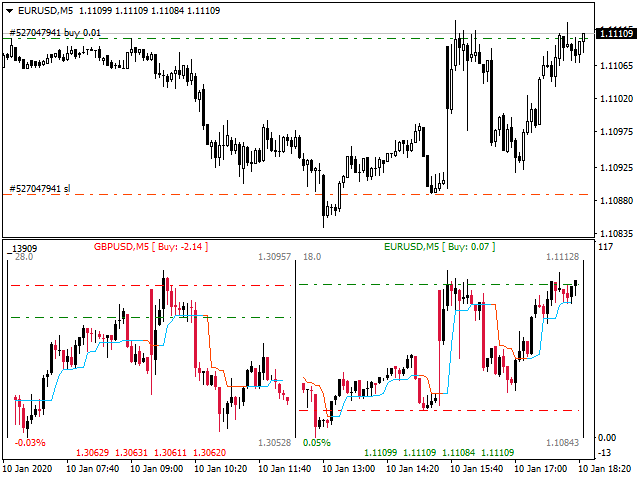
  • zeigt die Ebenen aller etablierten Orders an
  • zeigt die Ebenen aller aufgegebenen Bestellungen an
  • erstellt technische Indikatoren für gleitende Durchschnitts, Trendfilter und Heiken Ashi-Diagramme
  • zeigt den Spread, OHLC - Preise des aktuellen Balkens
  • zeigt die relative Preisänderung für den aktuellen Tag *

* - Für Zeiträume bis einschließlich Täglich wird die Preisänderung für den aktuellen Tag berechnet. Über Täglich - für den ausgewählten Zeitraum (aktuelle Woche bzw. aktueller Monat). Alle aufgelisteten Eigenschaften können vom Benutzer jederzeit einfach über die Indikatoreingabeparameter geändert werden

Farbschema des Indikators:

  • Bear candle color - Farbe für bärische Kerzen
  • Bull candle color - Farbe für bullische Kerzen
  • Labels color - Textfarbe (Instrumentenname, OHLC)
  • Labels TP color - Textfarbe, wenn sich der Preis dem Take Profit-Level nähert
  • Labels SL color - Textfarbe, wenn sich der Preis dem Stop-Loss-Level nähert
  • Profit color - die Farbe des Textes, wenn das Handelssymbol Gewinn bringt
  • Loss color - Textfarbe, wenn ein Handelssymbol verloren geht
  • Text color - Textfarbe (Spread, Preisänderung, Zellrand)
  • Orders line color - Farbe für Positionslinien und ausstehende Bestellungen
  • Stops line color - Farbe für Linien mit Stop-Loss- und Take-Profit-Levels
  • Fast MA color - Linienfarbe des gleitenden Durchschnittsindikators, Trendfilter
  • Slow MA color - Linienfarbe des gleitenden Durchschnittsindikators, Trendfilter
Einstellungen der Moving-Average-Indikatoren:
  • Fast MA period - die Periode des "schnellen" gleitenden Durchschnitts
  • Slow MA period - die Periode des "langsamen" gleitenden Durchschnitts
  • MA method - Mittelungsmethode
  • Applied price - eine Reihe von Preisen zur Berechnung des Indikators
Einstellungen der Trendfilteranzeige:
  • Trend filter period - Zeitraum des Trendfilterindikators (der empfohlene Zeitraum für die Eingabe durch den Indikator liegt zwischen 2 und 5)
  • Trend filter MA metod - Mittelungsmethode

Einstellungen der SDL-Anzeige:

  • SDL period - SDL-Indikatorzeitraum
  • SDL MA method - Mittelungsmethode
  • SDL applied price - eine Reihe von Preisen zur Berechnung des Indikators

The indicator interface:

  • Add Indicator - Technische Indikatoren anzeigen Moving Average,Trendfilter oder Heiken Ashi-Diagramme
  • Show OHLC prices - OHLC-Preise anzeigen
  • Draw orders - Bestellpositionen anzeigen
  • Monitoring positions - Zeigen Sie die Anzahl und den Gesamtgewinn / -verlust offener Positionen an
  • Show profit - Methode zur Anzeige des Gewinns / Verlusts aus offenen Positionen (in Punkten oder in der Währung der Einlage)
  • Show growth - zeigen die relative Preisänderung
  • Orders line style - Linienstil für Bestellungen
  • Allow Email notifications - E-Mail-Benachrichtigungen senden, wenn der Trendfilter, SDL-Anzeigesignale erscheinen
  • Allow Alert - Verwenden Sie eine Warnung, wenn die Signale des Trendfilters und der SDL-Anzeige erscheinen.
  • Allow Push notifications - Senden Sie Benachrichtigungen an das mobile Endgerät, wenn die Signale des Trendfilters und der SDL-Anzeige erscheinen
  • Broker company label - Firmenname zur Verwendung in Push-Benachrichtigungen, zum Beispiel: (MQ MT4) - 'EURUSD, H1: Possible change trend direction on uptrend! '. Wenn Sie das Symbol -? Setzen, wird der Standard-Firmenname verwendet
  • UID - eindeutige Indikatornummer. Befindet sich mehr als eine Kopie des Indikators in der Tabelle des Instruments, müssen Sie für jede Kopie die eindeutige Nummer festlegen
  • Open chart in the... - Öffnen Sie das Diagrammfenster, indem Sie im aktuellen oder neuen Fenster auf den Symbolnamen klicken
  • Chart 1....Chart 6 - Handelssymbolnamen (EURUSD,M5 ... USDCAD,H1)
  • Allowed pairs for Notifications - Namen von Handelspaaren, für die Benachrichtigungen zulässig sind. Geben Sie durch ein Leerzeichen getrennt die Paare an, für die Benachrichtigungen zulässig sind, z. B.: EURUSD, M5 GBPUSD, H1 USDJPY, M15 Wenn der Parameter leer gelassen wird, sind Benachrichtigungen für alle Paare zulässig, die in den Indikatoreinstellungen (Chart1 ... Chart6) angegeben sind


    Empfohlene Produkte
    Fibonacci Wave Bands Indicator The Fibonacci Wave Bands indicator utilizes Fibonacci ratios to create dynamic bands around a central moving average. These bands are derived from key Fibonacci ratios (typically 38.2%, 50%, 61.8%) and adapt to market volatility, offering insights into potential support and resistance zones. Key Features: Fibonacci Levels: The indicator plots multiple bands above and below a central moving average based on Fibonacci ratios. Dynamic Support and Resistance: Bands ser
    UPD1 Fibo Levels
    Vitaliy Kuznetsov
    5 (1)
    Der Indikator analysiert die angegebene Anzahl von Kerzen und zeichnet Fibonacci-Niveaus basierend auf dem Hoch-Tief. Da sich die Ebenen neu anordnen, interessieren wir uns für die rechte Seite des Bereichs. Der Preis magnetisiert die Niveaus und reagiert auf die Berührung. Verwenden Sie dieses Tool, um nach einer Korrektur einen Trendeintrittspunkt zu finden. Wenn wir links sehen, dass die Pegel perfekt angestiegen sind, können wir davon ausgehen, dass wir das Ende der Bewegung am Extrempunkt g
    FREE
    Simply drop the indicator to the chart and Fibonacci levels will be shown automatically! The indicator is developed for automatic drawing of Fibonacci levels on the chart. It provides the abilities to: Select the standard Fibo levels to be shown Add custom levels Draw the indicator on the timeframes other than the current one. For example, the indicator is calculated on the weekly period (W1) and is displayed on the monthly period (MN1) Select the timeframes the indicator will be available on Ca
    Free automatic Fibonacci is an indicator that automatically plots a Fibonacci retracement based on the number of bars you select on the BarsToScan setting in the indicator. The Fibonacci is automatically updated in real time as new highest and lowest values appears amongst the selected bars. You can select which level values to be displayed in the indicator settings. You can also select the color of the levels thus enabling the trader to be able to attach the indicator several times with differe
    FREE
    AutoPivot
    Hafis Mohamed Yacine
    This indicator will draw monthly, weekly, and daily pivot. Pivot line will be calculated automatically again when the period ends. Auto Pivot Metatrader 4 Indicator The Auto Pivot indicator for Metatrader 4 automatically updates the pivot point (PP), support (S1,S2,S3) and resistance levels (r1,r2,r3) every day. Price above the pivot point means positive while price below the pivot point means negative. S3 indicates extremely oversold while price above resistance r3 means extremely overbought.
    Dieser Indikator wurde entwickelt, um mit der Elliott-Wellen-Theorie auf zwei Arten zu arbeiten: Automatische Arbeitsweise: In diesem Modus erkennt der Indikator automatisch alle fünf Motivwellen im Chart gemäß der Elliott-Wellen-Theorie. Er liefert Prognosen und identifiziert potenzielle Umkehrzonen. Darüber hinaus verfügt er über die Fähigkeit, Warnungen und Push-Nachrichten zu generieren, um Trader über bedeutende Entwicklungen zu informieren. Diese automatisierte Funktionalität vereinfacht d
    Auto Fibo mq
    DMITRII GRIDASOV
    "Auto FIBO" indicator    - is great auxiliary tool in trading! Indicator automatically calculate and place on chart Fibo levels and local trend lines (red color) Fibonacci levels indicate key areas where price can reverse Most important levels are 23.6%, 38.2%, 50% and 61.8% You can use it   for reversal scalping  or for zone grid trading There are plenty of opportunities to  improve your current system using Auto FIBO indicator as well // More great Expert Advisors and Indicators are availab
    Fibonacci SR Indicator This indicator creates support and resistance lines. This indicator is based on Fibonacci Retracement and Extension levels. It will consider many combinations of the Fibonacci levels and draw support/resistance lines based on these. This indicator uses tops and bottoms drawn by the ZigZag indicator in its calculations. The ZigZag can also be drawn on the chart, if necessary. The indicator considers many combinations of past reversal points and Fibonacci ratio levels, and
    FREE
    Der Trendfänger: Die Strategie des Trendfängers mit Alarmindikator ist ein vielseitiges technisches Analysewerkzeug, das Händlern hilft, Markttrends und potenzielle Ein- und Ausstiegspunkte zu identifizieren. Sie verfügt über eine dynamische Trendfängerstrategie, die sich den Marktbedingungen anpasst, um eine klare visuelle Darstellung der Trendrichtung zu ermöglichen. Händler können die Parameter an ihre Vorlieben und Risikotoleranz anpassen. Der Indikator hilft bei der Trendidentifikation,
    FREE
    Possible Price reversals levels - based on  Fibonacci + Support +  Resistance Levels Auto levels drawn based on input index (Bars Count )  ---->>> Price Over 50% Fibo line ---> UP TREND ---> BUY when price drop near Support Lines  ---->>> Price Down 50% Fibo line ---> DOWN TREND ---> SELL when price goes up  near Resistance Lines  --->>> The more close price levels ----> the more possibility for price reversals --->>> are you a scalper --> try it on M1 charts with big index like 5000 bars  or
    The indicator is designed for determining Fibonacci levels. Does not repaint/redraw The blue level shows the zero Fibonacci value (it is also the Pivot level) Red levels show calculated Fibonacci levels (used as a rollback or reversal point) Automatic period detection (periods can be entered manually) Adjustable display calculation method. Settings BarsHistory - the number of bars to be used to display the indicator. Method - method of calculation. AutoPeriod - automated period calculation (true
    Capital Pivot
    Mr Nisit Noijeam
    Pivot Points และระดับ (Support) และ(Resistance) บนแผนภูมิการเทรดใน MetaTrader 4 สำหรับตลาด Forex : คำนวณ Pivot Points : สคริปต์คำนวณจุด Pivot โดยใช้ข้อมูลราคาประวัติศาสตร์ เช่น ราคาเปิด, ราคาสูงสุด, ราคาต่ำสุด, และราคาปิด จากช่วงเวลาที่กำหนด (เช่น วัน, ชั่วโมง, ฯลฯ) จุด Pivot และระดับต่างๆ เช่น R1, R2, R3 (ระดับการต้านทาน) และ S1, S2, S3 (ระดับการสนับสนุน) ถูกคำนวณออกมา แสดงบนแผนภูมิ : หลังจากคำนวณจุด Pivot และระดับต่างๆ, สคริปต์จะแสดงเส้นเหล่านี้บนแผนภูมิ MT4 เพื่อช่วยให้นักเทรดสามารถเห็นจุดที่
    The indicator detects and displays the 5-0 harmonic pattern on the chart according to the scheme provided in the screenshot. The pattern is plotted by the extreme values of the ZigZag indicator (included in the resources, does not require additional installation). After detecting the pattern, the indicator notifies of that by the pop-up window, a mobile notification and an email. The indicator highlights not only the complete figure, but also the time of its formation. During the formation the f
    Strong Retracement Points Pro demo edition! SRP (Strong Retracement/Reversal Points) is a powerful and unique support and resistance indicator. It displays the closest important levels which we expect the price retracement/reversal! If all level are broken from one side, it recalculates and draws new support and resistance levels, so the levels might be valid for several days depending on the market! If you are still hesitating to start using this wonderful tool, you can check this link to see h
    ZigZag Professional
    Dmitriy Kashevich
    5 (1)
    the zigzag indicator draws lines on the chart from the highest point to the lowest There are built-in fibonacci levels built-in sound alert the indicator highlights trends on small timeframes with a thin line and trends highlights with a coarse line Fibonacci levels can be turned on and off in the settings settings are very simple and clear the same sound alert can be turned on and off, you can change the colors of the lines.
    Fibonaccitools
    Aymn Sʿyd Ahmd Hsn Alkwmy
    Fibonacci-Retracements sind beliebte Tools, mit denen Trader Unterstützungslinien ziehen, Widerstandsniveaus identifizieren, Stop-Loss-Orders platzieren und Zielpreise festlegen können. Ein Fibonacci-Retracement wird erstellt, indem zwei Extrempunkte auf einem Aktienchart genommen und die vertikale Distanz durch die wichtigsten Fibonacci-Verhältnisse von 23,6%, 38,2%, 50%, 61,8% und 100% geteilt werden. Der Fibonacci-Tools-Indikator zeichnet Fibonacci-Tools z.B. Retracement, Arc, Fan, Expansion
    Auto AndrewFork
    Noor Ghani Rahman
    1 (1)
    Auto Pitchfork Indicator The indicator calculate the Pitch fork for the previous Day (Selectable) with multiple Support and Resistance lines from the Median price which acts as Magnet for the Price that if price touch the above warning (1) or below warning (1) lines and not cross up or down then there is maximum possibilities that it will return to the Median Line, and thus maintain the Price Action in Cyclic Pattern to the Market Move. You are able to select how many warning lines you want to k
    Pivot Point Multi Method is a fully automatic pivot point indicator and indicate support and resistances (S1,S2,S3,S4,R1,R2,R3,R4) based on four Methods that you can select on of them Pivot point detection and drawing support resistances Methods( Classic ,Camarilla ,Woodie ,Fibonacci) Pivot Point Multi Method is working on all time frames and all currency pairs and gold silver and crypto currencies . Recommended Setting : Pivot_Method    select one of the methods ( Classic ,Camarilla ,Woodi
    Индикатор высчитывается по сложному авторскому алгоритму. Он строится с учетом тенденции по зонам перекупленности перепроданности объёмов . Это позволяет выявлять дивергенцию объёмов , выявить так называемые приседающие бары. Также он определяет уровни входа в рынок и цели. Средняя линия канала является предполагаемым уровнем отката. RPeriod- период расчета индикатора Indicator_Level - уровень зон перекупленности перепроданности Draw Fibo Levels - отображаем целевые уровни Fibo Level Col
    Trend Ray
    Andriy Sydoruk
    The indicator shows the potential trend direction by cyclical-wave dependence. Thus, all the rays of the intersection will be optimal rays, in the direction of which the price is expected to move, taking into account the indicator period. Rays can be used as a direction for potential market movement. But we must not forget that the approach must be comprehensive, the indicator signals require additional information to enter the market.
    Description: The indicator measures, through the zigzag indicator, the levels of trend or correction. It shows in the chart the levels of each low or high detected. KEY LINKS:   How to Install  –  Frequent Questions  -  All Products  How is this indicator useful? This indicator determines, depending on Zigzag parameter if a trend is beginning, developing, or ending This indicator determines the direction of the trend Components Levels as positive or negative numbers, depending on the direction
    FREE
    The indicator detects and displays Shark harmonic pattern (see the screenshot). The pattern is plotted by the extreme values of the ZigZag indicator (included in the resources, no need to install). After detecting the pattern, the indicator notifies of that by a pop-up window, a mobile notification and an email. The indicator highlights the process of the pattern formation and not just the complete pattern. In the former case, it is displayed in the contour triangles. After the pattern is comple
    Key level wedge pro
    Presley Annais Tatenda Meck
    5 (1)
    We have combined all of our beloved indicators the likes of: Key level order block , Key level supply and demand , Key level liquidity grab and Key level wedge into one single indicator and dashboard. Whats new Dashboard : There is an easy access dashboard for all your needs. Multi-timeframe button : There is now a multi-timeframe option for Order Blocks and Supply and demand zones, making it easy to see higher timeframe zones easily on the current timeframe by just clicking the desired timefr
    Average Daily Weekly Monthly Range Alerts. The most complete multi-period dynamic range indicator with full alert options. Visually displays the Average Range lines on chart + real time distances to the Range Highs and Lows. Notifications are sent when the average ranges are hit. An essential tool for any serious trader! Average period ranges, especially the ADR (Average Daily Range) for day traders, are one of the most useful and consistently reliable indicators available to traders. Always a
    FiboZag
    Andriy Sydoruk
    Indicator FiboZag - transfer the indicator to the chart and the Fibonacci levels will be built automatically on the last ZigZag turn. The main advantage lies in the correct construction of Fibonacci levels and markup of price levels. Simple, visual and effective use. The indicator is not redrawn and does not lag. Works on all currency pairs and on all timeframes.
    Market Structure Zig Zag
    Lesedi Oliver Seilane
    4.65 (26)
    Free Market structure zig zag to assist in price action trading the screenshots describe how to use and how to spot patterns new version comes with alerts, email alert and  push notification alert can be used on all pairs  can be used on all timeframes  you can add additional confirmation indicators the indicator shows you your higher high and low highs as well as your lower lows and lower highs  the indication makes price action analysis easier to spot.
    FREE
    The indicator detects and displays 3 Drives harmonic pattern (see the screenshot). The pattern is plotted by the extreme values of the ZigZag indicator (included in the resources, no need to install). After detecting the pattern, the indicator notifies of that by a pop-up window, a mobile notification and an email. The indicator highlights the process of the pattern formation and not just the complete pattern. In the former case, it is displayed in the contour triangles. After the pattern is com
    Candle EA MT4
    Mansour Babasafary
    4.43 (49)
    This expert is based on patterns The main patterns of this specialist are candlestick patterns Detects trends with candlestick patterns It has a profit limit and a loss limit, so it has a low risk The best time frame to use this expert is M30 time frame The best currency pairs to use with this expert is the EURUSD, GBPUSD, AUDUSD, USDCAD currency pairs Attributes: Can be used in the EURUSD, GBPUSD, AUDUSD, USDCAD  currency pairs Can be used in M30, H1, H4 time frames Has profit limit an
    Basic Fibonacci Calculation Indicator  shows Trend, Stoploss, Profit 1,2,3, will show you your daily Highs and your Daily Lows , it will also show you where it expects the price to move to.  best time frame is H1 or higher .  For  a better system that also includes my Non-repaint Indicator please check out my paid Fibo Indicator  https://www.mql5.com/en/market/product/82323
    FREE
    This is a new strategy for SUPPLY DEMAND areas It is based on a calculation using the tick volume to detect the big price action in market for both bear /bull actions this smart volume action candles are used to determine the supply and demand areas prices in between main supply and demand lines indicate sideway market  up arrows will be shown when prices moves above the main supply and the secondary supply lines Down arrows will be shown when prices moves below the main demand and the secondary
    Käufer dieses Produkts erwarben auch
    TPSpro RFI Levels
    Roman Podpora
    4.82 (22)
    Umkehr der ersten Impulsniveaus (RFI)       ANWEISUNGEN       Russland       -        ENG    Die Empfehlung basiert auf dem Indikator -   TPSpro   TREND PRO -   Version MT5 Die wichtigsten Elemente in der Branche sind entweder in Zonen oder in der Fabrik enthalten, oder sie führen zu einer Lösung bei einem Kauf oder dem Verkauf eines anderen Instruments. Wenn viele Menschen ihre Rechte nicht auf dem Händlerkonto verschlüsseln, werden die Folgen nicht schnell genug sein. Ich habe es damit abgesc
    Gold Stuff
    Vasiliy Strukov
    4.89 (238)
    Gold Stuff-Ein Trendindikator, der speziell für Gold entwickelt wurde, kann auch auf allen Finanzinstrumenten verwendet werden. Der Indikator wird nicht neu gezeichnet und verzögert sich nicht. Empfohlener Zeitrahmen H1. Nach diesem Indikator geschrieben EA Gold Stuff Berater, können Sie es in meinem Profil finden. WICHTIG! Kontaktieren Sie mich sofort nach dem Kauf, um Anweisungen und Bonus zu erhalten!   Sie können eine kostenlose Kopie unseres Strong Support- und Trendscanner-Indikators
    Atomic Analyst
    Issam Kassas
    5 (2)
    Zunächst einmal ist es erwähnenswert, dass dieser Handelsindikator nicht neu malt, nicht neu zeichnet und keine Verzögerung aufweist, was ihn sowohl für manuellen als auch für Roboterhandel ideal macht. Benutzerhandbuch: Einstellungen, Eingaben und Strategie. Der Atom-Analyst ist ein PA-Preisaktionsindikator, der die Stärke und das Momentum des Preises nutzt, um einen besseren Vorteil auf dem Markt zu finden. Ausgestattet mit fortschrittlichen Filtern, die helfen, Rauschen und falsche Signale z
    TPSproTREND PrO
    Roman Podpora
    4.79 (19)
    TPSpro TREND PRO   ist ein Trendindikator, der den Markt automatisch analysiert und Informationen über den Trend und jede seiner Änderungen liefert sowie Signale für den Einstieg in Geschäfte ohne Neuzeichnung gibt! Der Indikator verwendet jede Kerze und analysiert sie separat. bezieht sich auf verschiedene Impulse – Aufwärts- oder Abwärtsimpuls. Exakte Einstiegspunkte in Transaktionen für Währungen, Krypto, Metalle, Aktien, Indizes! Version MT5                   VOLLSTÄNDIGE BESCHREIBUNG DES
    FX Volume
    Daniel Stein
    4.58 (33)
    Erhalten Sie Ihr tägliches Marktupdate mit Details und Screenshots über unser Morning Briefing hier auf mql5 und auf Telegram ! FX Volume ist der ERSTE und EINZIGE Volumenindikator, der einen ECHTEN Einblick in die Marktstimmung aus Sicht eines Brokers bietet. Es bietet fantastische Einblicke in die Positionierung von institutionellen Marktteilnehmern, wie z.B. Brokern, auf dem Forex-Markt, viel schneller als COT-Berichte. Diese Informationen direkt auf Ihrem Chart zu sehen, ist der wahre Game
    Scalper Inside PRO
    Alexey Minkov
    4.73 (56)
    An exclusive indicator that utilizes an innovative algorithm to swiftly and accurately determine the market trend. The indicator automatically calculates opening, closing, and profit levels, providing detailed trading statistics. With these features, you can choose the most appropriate trading instrument for the current market conditions. Additionally, you can easily integrate your own arrow indicators into Scalper Inside Pro to quickly evaluate their statistics and profitability. Scalper Inside
    Enigmera
    Ivan Stefanov
    5 (3)
    ENIGMERA: Der Kern des Marktes https://www.enigmera.com Einführung Dieser Indikator und dieses Handelssystem sind ein bemerkenswerter Ansatz für die Finanzmärkte. ENIGMERA nutzt die fraktalen Zyklen zur genauen Berechnung von Unterstützungs- und Widerstandsniveaus. Er zeigt die echte Akkumulationsphase an und gibt Richtung und Ziele vor.  Ein System, das funktioniert, egal ob wir uns in einem Trend oder in einer Korrektur befinden.  Wie funktioniert es? ENIGMERA besteht aus drei Linien: der
    MetaBands M4
    Vahidreza Heidar Gholami
    5 (2)
    MetaBands verwendet leistungsstarke und einzigartige Algorithmen, um Kanäle zu zeichnen und Trends zu erkennen, sodass es Tradern potenzielle Punkte für den Einstieg und Ausstieg aus Trades bieten kann. Es ist ein Kanalindikator sowie ein leistungsstarker Trendindikator. Es umfasst verschiedene Arten von Kanälen, die einfach durch Verwendung der Eingabeparameter zusammengeführt werden können. MetaBands verwendet alle Arten von Warnmeldungen, um Benutzer über Marktereignisse zu informieren. Funkt
    Derzeit 20% Rabatt! Die beste Lösung für jeden Neueinsteiger oder Expert Händler! Dieses Dashboard arbeitet mit 28 Währungspaaren. Es basiert auf 2 unserer Hauptindikatoren (Advanced Currency Strength 28 und Advanced Currency Impulse). Es bietet einen hervorragenden Überblick über den gesamten Forex-Markt. Es zeigt die Werte der Advanced Currency Strength, die Veränderungsrate der Währungen und die Signale für 28 Devisenpaare in allen (9) Zeitrahmen. Stellen Sie sich vor, wie sich Ihr Hande
    Bomb Bank Signal
    Igor Pereira Calil
    5 (1)
    Bombenbanksignal: Ihr Vertrauensindikator in MetaTrader 4 Bomb Bank Signal ist ein leistungsstarker Indikator für MetaTrader 4, der entwickelt wurde, um die relevantesten Trends auf dem Finanzmarkt zu identifizieren. Wenn Sie nach einem Tool suchen, das Bewegungen genau vorhersieht, ist die Bomb Bank der Verbündete, den Sie brauchen. So funktioniert es: Dieser Indikator kombiniert drei unterschiedliche Methoden – Volumenanalyse, Kerzenschließungen und symmetrischer Trend –, um Kauf- und V
    Supply and Demand Dashboard PRO
    Bernhard Schweigert
    4.8 (20)
    Derzeit 20% reduziert! Dieses Dashboard ist eine sehr leistungsfähige Software, die mit mehreren Symbolen und bis zu 9 Zeitrahmen arbeitet. Es basiert auf unserem Hauptindikator (Beste Bewertungen: Advanced Supply Demand ).   Das Dashboard gibt einen guten Überblick. Es zeigt: Gefilterte Angebots- und Nachfragewerte einschließlich der Zonenstärkebewertung, Pips-Abstände zu/und innerhalb von Zonen, Es hebt verschachtelte Zonen hervor, Es gibt 4 Arten von Alarmen für die gewählten Symbole in
    Gold Channel is a volatility-based indicator, developed with a specific timing algorithm for the XAUUSD pair, which consists of finding possible corrections in the market. This indicator shows two outer lines, an inner line (retracement line) and an arrow sign, where the theory of the channel is to help identify overbought and oversold conditions in the market. The market price will generally fall between the boundaries of the channel. If prices touch or move outside the channel it is a tra
    PZ Day Trading
    PZ TRADING SLU
    3.67 (3)
    Dieser Indikator erkennt Preisumkehrungen im Zick-Zack, wobei nur Preisaktionsanalysen und ein Donchian-Kanal verwendet werden. Es wurde speziell für den kurzfristigen Handel entwickelt, ohne dass ein Nachlackieren oder ein Backpainting erforderlich ist. Es ist ein fantastisches Werkzeug für clevere Trader, die darauf abzielen, das Timing ihrer Operationen zu verbessern. [ Installationsanleitung | Update-Anleitung | Fehlerbehebung | FAQ | Alle Produkte ] Erstaunlich einfach zu handeln Es bi
    Currency Strength Exotics
    Bernhard Schweigert
    4.87 (30)
    Stärke von 8 Währungen plus EIN EXOTISCHES Paar oder Rohstoffe oder Indexe! Jedes Produkt kann als 9. Linie hinzugefügt werden. Fügen Sie Rohstoffe, Indexes oder exotische Währungen hinzu (Gold, Silber, Öl, DAX, US30, MXN, TRY, CNH ...). Eine neue noch nie dagewesene TRADING STRATEGIE  !!! Dieser Indikator ist einzigartig, weil wir eine Reihe von proprietäre Funktionen und neue Formeln eingebaut haben. Es funktioniert für alle Zeitrahmen. Basierend auf neuen zugrunde liegenden Algorithmen ist
    Quantum Trend Monitor Indicator
    QUANTUM TRADING SOFTWARE LIMITED
    Currency pairs never go up or down in a straight line. They rise and fall constantly, creating pullbacks and reversals. And with each rise and fall, so your emotions rise and fall. Hope, then fear, then hope. This is when the market will try to frighten you out of a strong position. It is when you are most vulnerable. But not if you have the Quantum Trend Monitor. And here, you even get two indicators for the price of one! The Quantum Trend Monitor has been designed to absorb these temporary pau
    Quantum Volume Point of Control Indicator
    QUANTUM TRADING SOFTWARE LIMITED
    5 (1)
    The Quantum VPOC indicator has been developed to expand the two dimensional study of volume and price, to a three dimensional one which embraces time. The volume/price/time relationship then provides real insight to the inner workings of the market and the heartbeat of sentiment and risk which drives the price action accordingly. The Quantum VPOC indicator displays several key pieces of information on the chart as follows: Volume Profile - this appears as a histogram of volume on the vertical pr
    XQ Indicator MetaTrader 4
    Marzena Maria Szmit
    3.67 (3)
    Step into the realm of Forex trading with confidence and precision using XQ, a cutting-edge Forex indicator designed to elevate your trading game to unprecedented heights. Whether you're a seasoned trader or just stepping into the world of currency exchange,   XQ Forex Indicator   empowers you with the insights and signals needed to make informed trading decisions. The signal conditions are a combination of three indicators, and XQ Forex Indicator only display  medium and long-term trends . The
    Wir stellen vor       Quantum Trend Sniper Indicator   , der bahnbrechende MQL5-Indikator, der die Art und Weise, wie Sie Trendumkehrungen erkennen und handeln, verändert! Entwickelt von einem Team erfahrener Händler mit über 13 Jahren Handelserfahrung,       Quantum Trend Sniper-Indikator       wurde entwickelt, um Ihre Trading-Reise mit seiner innovativen Methode zur Identifizierung von Trendumkehrungen mit extrem hoher Genauigkeit auf ein neues Niveau zu heben. ***Kaufe Quantum Trend Snipe
    RelicusRoad Pro
    Relicus LLC
    4.64 (103)
    Jetzt 147 US -Dollar (nach ein paar Aktualisierungen auf 499 US -Dollar) - Unbegrenzte Konten (PCs oder MACs) RelicusRoad Benutzerhandbuch + Schulungsvideos + Zugang zur privaten Discord-Gruppe + VIP-Status EINE NEUE ART, DEN MARKT ZU BETRACHTEN RelicusRoad ist der weltweit leistungsstärkste Handelsindikator für Forex, Futures, Kryptowährungen, Aktien und Indizes und gibt Händlern alle Informationen und Tools, die sie benötigen, um profitabel zu bleiben. Wir bieten technische Analysen un
    Cycle Sniper
    Elmira Memish
    4.37 (35)
    NEW YEAR SALE PRICE FOR LIMITED TIME!!! Please contact us after your purchase and we will send you the complimentary indicators to complete the system Cycle Sniper is not a holy grail but when you use it in a system which is explained in the videos, you will feel the difference. If you are not willing to focus on the charts designed with Cycle Sniper and other free tools we provide, we recommend not buying this indicator. We recommend watching the videos about the indiactor and system before pu
    Trend Arrow Super
    Aleksandr Makarov
    5 (1)
    Trend Arrow Super The indicator not repaint or change its data. A professional, yet very easy to use Forex system. The indicator gives accurate BUY\SELL signals. Trend Arrow Super is very easy to use, you just need to attach it to the chart and follow simple trading recommendations. Buy signal: Arrow + Histogram in green color, enter immediately on the market to buy. Sell signal: Arrow + Histogram of red color, enter immediately on the market to sell. Please email me after your purchase!
    Scalper gun
    Mikhail Nazarenko
    4.5 (2)
    Scalper gun   - the main weapon for trade in scalping and swing, with visualization and alert of entry points. The indicator works in both trend and non-trend market conditions. Suitable for beginners and experienced traders. SCALPER GUN surpasses popular top indicators of this site in speed, quality of visualization and accuracy of entry !!! Before buying, download the Scalper gun demo and compare it with similar indicators for scalping in the MT4 tester. Features This is a complete trading s
    AV Stop Hunter
    Anja Vivia Vogel
    "AV Stop Hunter" ist ein Indikator für MetaTrader 4, welcher Einstiegspfeile für Long und Short nach sogenannten Stop-Hunt-Kerzen zeichnet und über mehrere Benachrichtigungen darüber verfügt. Da es sich hier um ein Smart Money Konzept handelt, eignen sich die Perioden H1 und H4 am besten. Steigendes Volumen verstärkt das Signal, Linien und Pfeile sind dann dicker. Die MQL5 Variante hat farbige Stop-Hunting-Kerzen. Definition : Stop Hunting auch als Stop Running bezeichnet, ist die Praxi
    Entry Points Pro
    Yury Orlov
    4.62 (175)
    Dies ist ein Indikator für MT4, der genaue Signale für den Einstieg in einen Handel ohne Repainting (Neuzeichnen) liefert. Er kann auf alle Finanzwerte angewendet werden: Forex, Kryptowährungen, Metalle, Aktien, Indizes. Er liefert ziemlich genaue Schätzungen und sagt Ihnen, wann es am besten ist, eine Position zu eröffnen und zu schließen. Sehen Sie sich das Video (6:22) mit einem Beispiel für die Verarbeitung nur eines Signals an, das sich für den Indikator gelohnt hat! Die meisten Händler ver
    Best Currency Strength Indicator
    Tumelo Patrick Rakotsoane
    4.59 (46)
    Advanced Currency Strength Indicator The Advanced Divergence Currency Strength Indicator. Not only it breaks down all 28 forex currency pairs and calculates the strength of individual currencies across all timeframes , but, You'll be analyzing the WHOLE forex market in 1 window (In just 1 minute) . This indicator is very powerful because it reveals the true movements of the market.  It is highly recommended to  analyze charts knowing the performance of individual currencies or the countries ec
    Indicator : RealValueIndicator Description : RealValueIndicator is a powerful tool designed specifically for trading on the EURUSD pair. This indicator analyzes all EUR and USD pairs, calculates their real currency strength values, and displays them as a single realistic value to give you a head start on price. This indicator will tell you moves before they happen if you use it right. RealValueIndicator allows you to get a quick and accurate overview of the EURUSD currency pair tops and bottoms,
    This indicator is based on the Gann Signal indicator and acts as a market scanner. All you need to do is fill in the selected currency pairs in the settings and that’s it. Next, the indicator itself will view all these currency pairs and time frames from M5 to D1 simultaneously. When a new signal appears, the indicator will give you an Alert and also draw the letter N where this new signal will be.
    Volume Horizon is a horizontal volume indicator that allows you to observe the density of market participants' volumes across various price and time intervals. Volume histograms can be constructed based on ascending or descending market waves, as well as individual bars. This tool enables more precise determination of entry or exit points, relying on levels of maximum volumes or volume-weighted average prices (VWAP). What makes Volume Horizon unique? 1. Segmentation into ascending and descend
    EFW Pattern Trader is a powerful pattern scanner for Forex and Stock trading. The pattern detection in EFW Pattern Trader uses the Fractal Wave Theory, which captures the endless up and down movement of the market. Therefore, EFW Pattern Trader can be considered as the robust price action indicator. Any patterns in EFW Pattern Trader can be backtested visually in your strategy tester. Visual backtesting with pattern will show you how pattern will likely behave in the live trading. Therefore, you
    GOLD Impulse with Alert
    Bernhard Schweigert
    4.56 (9)
    Dieser Indikator ist eine hervorragende Kombination aus unseren 2 Produkten Advanced Currency IMPULSE with ALERT  +   Currency Strength Exotics . Es funktioniert für alle Zeitrahmen und zeigt grafisch Impulse der Stärke oder Schwäche für die 8 wichtigsten Währungen plus ein Symbol! Dieser Indikator ist darauf spezialisiert, die Beschleunigung der Währungsstärke für beliebige Symbole wie Gold, Exotische Paare, Rohstoffe, Indizes oder Futures anzuzeigen. Als erster seiner Art kann jedes Sym
    Weitere Produkte dieses Autors
    TradePad
    Ruslan Khasanov
    5 (2)
    Eine einfache Lösung für schnelle Handelsoperationen und Positionskontrolle auf mehreren Handelsinstrumenten. Die Bedienfeldoberfläche ist einfach und intuitiv. Für eine komfortable Arbeit eines Händlers verfügt das Panel über: Manager von "Hot Keys", mit denen Sie alle Handelsoperationen und Chartperioden verwalten können; ein Tool zum Markieren von Handelsniveaus bei der Platzierung von Pending- oder Market-Orders zur Bewertung von Risiken und potenziellen Gewinnen bei der Festlegung von Stop-
    MultiCharts MT5
    Ruslan Khasanov
    Ein Tool zur Überwachung mehrerer Währungen in Form eines Panels, in dem Diagramme aller von einem Händler ausgewählten Instrumente in einem separaten Fenster angezeigt werden. Ermöglicht dem Händler, eine visuelle Analyse der Preisbewegung auf mehreren verschiedenen Instrumenten und verschiedenen Zeiträumen durchzuführen und schnell zwischen den ausgewählten Instrumenten zu wechseln. Eine Demoversion ist auf der TradePad-Produktbeschreibungsseite verfügbar:    https://www.mql5.com/en/blogs/post
    Quick Info
    Ruslan Khasanov
    Quick Info   - ein Informationsdienstprogramm zum Sammeln und Bereitstellen verschiedener nützlicher Informationen, die für den täglichen Handel an den Finanzmärkten benötigt werden, in bequemer Form für einen Händler. Alle nützlichen Informationen, die Sie benötigen, werden in einem separaten Fenster gesammelt und gruppiert. Auf der ersten Registerkarte finden Sie Handelsstatistiken für den ausgewählten Zeitraum. Um Handelsstatistiken zu sammeln, müssen Sie nur einen Zeitraum aus der Liste ausw
    Candle hunter
    Ruslan Khasanov
    5 (1)
    Indikator zur grafischen Analyse. Markiert die wichtigsten japanischen Candlestick-Muster auf dem Chart. Derzeit stehen dem Händler die folgenden Muster zur Verfügung:  - Bearish/Bullish Abandoned Baby;  - Bearish Advance Block;  - Bearish Deliberation;  - Bearish/Bullish Belt Hold;  - Bearish/Bullish Engulfing;  - Bearish Shooting Star;  - Bearish Evening Star;  - Bearish Evening Doji Star;  - Bearish/Bullish Doji Star;    - Bearish/Bullish Tri-Star;  - Bearish Hanging Man;  - Bearish/Bullish
    Auswahl:
    4example
    245
    4example 2021.03.07 13:11 
     

    Wonderful indicator. Your can see at a glance what a pair is doing and have everything in one chart. More over, the indicator has alerts and you can add moving averages of your choice to it. So now I can receive alerts from all pairs since I have only one profile active. It is basically a scanner with multi time frames enabled. The developer answers really fast and is offering advice on how to twick and have it the way you desire. Not many developers doing this with their product. What took me before several minutes, now it is a breeze. I have one chart with all pairs open on daily. This way I can see at a glance what the main trend is doing. Another one with 1 hour alerts on all pairs I consider worth trading. ... WONDERFUL work. Thank you.

    Iqbal Aroussi
    114
    Iqbal Aroussi 2020.05.10 15:43 
     

    Der Benutzer hat keinen Kommentar hinterlassen

    Antwort auf eine Rezension
    Version 23.1 2023.03.27
    Die neue Version enthält zahlreiche Änderungen und Verbesserungen.
    Version 22.12 2022.12.08
    Fehler behoben. Verbesserte Leistung. Aktualisierte Sammlung von Trendindikatoren.
    Version 21.3 2021.03.16
    Benachrichtigungen hinzugefügt, wenn sich gleitende Durchschnitte kreuzen.
    In den Anzeigeeinstellungen wurde ein neuer Parameter hinzugefügt - Zulässige Paare für Benachrichtigungen. Liste der Symbole, für die Benachrichtigungen zulässig sind. Geben Sie durch ein Leerzeichen getrennt die Paare an, für die Benachrichtigungen zulässig sind, z. B.: EURUSD, M5 GBPUSD, H1 USDJPY, M15
    Wenn der Parameter leer gelassen wird, sind Benachrichtigungen für alle in den Indikatoreinstellungen angegebenen Paare zulässig.
    Version 20.5 2020.05.10
    Fixed a bug for currency pairs that have suffixes/prefixes in their names