• Panoramica
  • Recensioni (2)
  • Commenti (3)
  • Novità

MultiCharts MT4

5

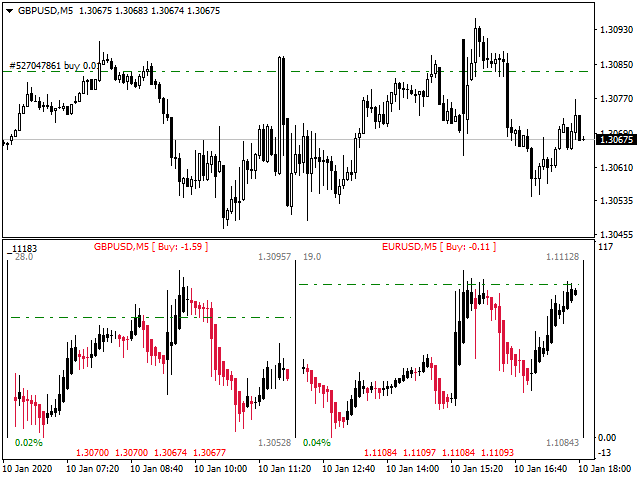
MultiCharts - indicatore multivaluta per l'analisi visiva di diversi strumenti di trading.

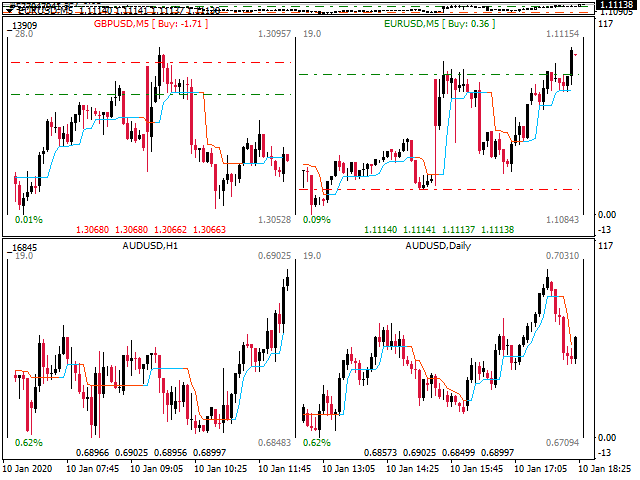
  • costruisce grafici degli strumenti selezionati in una finestra separata;
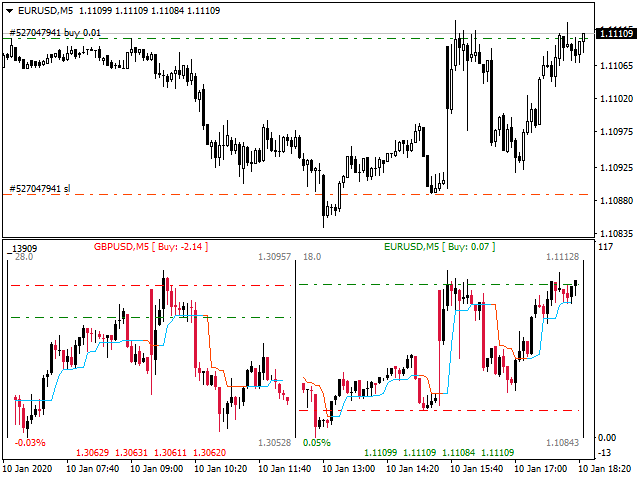
  • mostra i livelli di eventuali ordini stabiliti;
  • mostra profitto/perdita, numero e tipo di posizioni aperte;
  • costruisce indicatori tecnici Moving Average, Trend filter e grafici Heiken Ashi;
  • mostra lo spread, OHLC - prezzi della barra corrente;
  • mostra la variazione di prezzo relativa per il giorno corrente *;

* - per i periodi fino al Daily compreso, la variazione di prezzo è calcolata per il giorno corrente. Sopra Daily - per il periodo selezionato (settimana corrente, mese corrente, rispettivamente).

Tutte le proprietà elencate possono essere facilmente modificate dall'utente in qualsiasi momento tramite i parametri di input dell'indicatore.

  • Bear candle color - colore per candele ribassiste;
  • Bull candle color - colore per candele rialziste;
  • Labels color - colore del testo (nome dello strumento, OHLC);
  • Labels TP color - colore del testo se il prezzo si avvicina al livello Take Profit;
  • Labels SL color - colore del testo se il prezzo si avvicina al livello di Stop Loss;
  • Profit color - il colore del testo, se c'è profitto per il simbolo di scambio;
  • Loss color - colore del testo in caso di perdita per un simbolo di trading;
  • Text color - colore del testo (spread, variazione prezzo, bordo cella);
  • Orders line color - colore per linee di posizioni e ordini pendenti;
  • Stops line color - colore per le linee dei livelli di Stop Loss e Take Profit;
  • Fast MA color - colore della linea dell'indicatore Moving Average, Trend filter;
  • Slow MA color - colore della linea dell'indicatore Moving Average, Trend filter;
  • Fast MA period - periodo della media mobile "veloce";
  • Slow MA period - il periodo della media mobile "lenta";
  • MA method - metodo della media;
  • Applied price - un insieme di prezzi per il calcolo dell'indicatore;
  • Trend filter period - periodo indicatore Trend filter (il periodo consigliato per l'ingresso dall'indicatore è compreso tra 2 e 5);
  • Trend filter MA metod - metodo della media;
  • SDL period - Periodo dell'indicatore SDL;
  • SDL MA method - metodo della media;
  • SDL applied price - una serie di prezzi per il calcolo dell'indicatore;
  • Add Indicator - mostra indicatori tecnici Moving Average, SDL, Trend filter e grafici Heiken Ashi;
  • Show OHLC prices - mostrare i prezzi OHLC;
  • Draw orders - показывать линии ордеров;
  • Monitoring positions - mostrare il numero e il profitto/perdita totale sulle posizioni aperte;
  • Show profit - modalità di visualizzazione dell'utile/perdita sulle posizioni aperte (in punti o nella valuta del deposito);
  • Show growth - mostrare la variazione di prezzo relativa;
  • Orders line style - stile di linea per gli ordini;
  • Allow Email notifications - inviare notifiche e-mail quando vengono visualizzati i segnali del filtro di tendenza e dell'indicatore SDL; 
  • Allow Alert - utilizzare un avviso quando vengono visualizzati i segnali del filtro di tendenza e dell'indicatore SDL;
  • Allow Push notifications - inviare notifiche al terminale mobile quando compaiono i segnali del filtro Trend, dell'indicatore SDL;
  • Broker company label - nome dell'azienda da utilizzare nelle notifiche push, ad esempio: (MQ MT4) - 'EURUSD,H1: Possible change trend direction on uptrend!' . Se inserisci il simbolo -?, Verrà utilizzato il nome dell'azienda predefinito;
  • UID - numero indicatore univoco. Se c'è più di una copia dell'indicatore sul grafico dello strumento, allora per ogni copia è necessario impostare un proprio numero univoco;
  • Open chart in the... - aprire la finestra del grafico cliccando sul nome del simbolo nella finestra corrente o in una nuova finestra;
  • Chart 1....Chart 6 - nomi di simboli di trading (EURUSD, M5 ... USDCAD, H1);
  • Allowed pairs for Notifications - nomi delle coppie di trading per le quali sono consentite le notifiche. Specifica, separate da uno spazio, le coppie su cui sono consentite le notifiche, ad esempio: EURUSD, M5 GBPUSD, H1 USDJPY, M15 Se il parametro viene lasciato vuoto, le notifiche saranno consentite per tutte le coppie specificate nelle impostazioni dell'indicatore (Chart1...Chart6).


Recensioni 2
Iqbal Aroussi
114
Iqbal Aroussi 2020.05.10 15:43 
 

A very good tool to visualize and analyze several trading symbols quickly. Without the need of having multiple monitors.

Very useful when you're on the move, like traveling or simply not at your trading desk, working from your laptop.

I contacted the Dev Ruslan a Sunday morning for an issue regarding the indicator not working on my Linux MT4 installation. I was amazed that he fixed quickly and uploaded the new version to Market Place within the hour that we chatted.

I'm a happy buyer of the full version, really worth it.

Iqbal

Prodotti consigliati
UPD1 Fibo Levels
Vitaliy Kuznetsov
5 (3)
L'indicatore analizza il numero di candele specificato e costruisce i livelli di Fibonacci in base al massimo e al minimo. Poiché i livelli vengono ricostruiti, siamo interessati al lato destro dell'intervallo. Il prezzo è magnetico rispetto ai livelli e reagisce a un tocco. Utilizzate questo strumento per trovare un punto di ingresso nel trend dopo una correzione. Se a sinistra vediamo che i livelli sono perfettamente al rialzo, allora possiamo presumere di aver trovato la fine del movimento ne
FREE
Simply drop the indicator to the chart and Fibonacci levels will be shown automatically! The indicator is developed for automatic drawing of Fibonacci levels on the chart. It provides the abilities to: Select the standard Fibo levels to be shown Add custom levels Draw the indicator on the timeframes other than the current one. For example, the indicator is calculated on the weekly period (W1) and is displayed on the monthly period (MN1) Select the timeframes the indicator will be available on Ca
Free automatic Fibonacci is an indicator that automatically plots a Fibonacci retracement based on the number of bars you select on the BarsToScan setting in the indicator. The Fibonacci is automatically updated in real time as new highest and lowest values appears amongst the selected bars. You can select which level values to be displayed in the indicator settings. You can also select the color of the levels thus enabling the trader to be able to attach the indicator several times with differe
FREE
AutoPivot
Hafis Mohamed Yacine
This indicator will draw monthly, weekly, and daily pivot. Pivot line will be calculated automatically again when the period ends. Auto Pivot Metatrader 4 Indicator The Auto Pivot indicator for Metatrader 4 automatically updates the pivot point (PP), support (S1,S2,S3) and resistance levels (r1,r2,r3) every day. Price above the pivot point means positive while price below the pivot point means negative. S3 indicates extremely oversold while price above resistance r3 means extremely overbought.
Capital Pivot
Mr Nisit Noijeam
Pivot Points และระดับ (Support) และ(Resistance) บนแผนภูมิการเทรดใน MetaTrader 4 สำหรับตลาด Forex : คำนวณ Pivot Points : สคริปต์คำนวณจุด Pivot โดยใช้ข้อมูลราคาประวัติศาสตร์ เช่น ราคาเปิด, ราคาสูงสุด, ราคาต่ำสุด, และราคาปิด จากช่วงเวลาที่กำหนด (เช่น วัน, ชั่วโมง, ฯลฯ) จุด Pivot และระดับต่างๆ เช่น R1, R2, R3 (ระดับการต้านทาน) และ S1, S2, S3 (ระดับการสนับสนุน) ถูกคำนวณออกมา แสดงบนแผนภูมิ : หลังจากคำนวณจุด Pivot และระดับต่างๆ, สคริปต์จะแสดงเส้นเหล่านี้บนแผนภูมิ MT4 เพื่อช่วยให้นักเทรดสามารถเห็นจุดที่
Auto Fibo mq
DMITRII GRIDASOV
"Auto FIBO" indicator    - is great auxiliary tool in trading! Indicator automatically calculate and place on chart Fibo levels and local trend lines (red color) Fibonacci levels indicate key areas where price can reverse Most important levels are 23.6%, 38.2%, 50% and 61.8% You can use it   for reversal scalping  or for zone grid trading There are plenty of opportunities to  improve your current system using Auto FIBO indicator as well // More great Expert Advisors and Indicators are availab
Fibonacci SR Indicator
Martin Eshleman
3 (2)
Fibonacci SR Indicator This indicator creates support and resistance lines. This indicator is based on Fibonacci Retracement and Extension levels. It will consider many combinations of the Fibonacci levels and draw support/resistance lines based on these. This indicator uses tops and bottoms drawn by the ZigZag indicator in its calculations. The ZigZag can also be drawn on the chart, if necessary. The indicator considers many combinations of past reversal points and Fibonacci ratio levels, and
FREE
Il Catturatore di Tendenza: La Strategia del Catturatore di Tendenza con Indicatore di Allarme è uno strumento versatile di analisi tecnica che aiuta i trader a identificare le tendenze di mercato e i potenziali punti di ingresso e uscita. Presenta una Strategia dinamica del Catturatore di Tendenza, adattandosi alle condizioni di mercato per una chiara rappresentazione visiva della direzione della tendenza. I trader possono personalizzare i parametri in base alle loro preferenze e tolleranza
FREE
Possible Price reversals levels - based on  Fibonacci + Support +  Resistance Levels Auto levels drawn based on input index (Bars Count )  ---->>> Price Over 50% Fibo line ---> UP TREND ---> BUY when price drop near Support Lines  ---->>> Price Down 50% Fibo line ---> DOWN TREND ---> SELL when price goes up  near Resistance Lines  --->>> The more close price levels ----> the more possibility for price reversals --->>> are you a scalper --> try it on M1 charts with big index like 5000 bars  or
Leo Fibonacci
Dmitriy Zaytsev
The indicator is designed for determining Fibonacci levels. Does not repaint/redraw The blue level shows the zero Fibonacci value (it is also the Pivot level) Red levels show calculated Fibonacci levels (used as a rollback or reversal point) Automatic period detection (periods can be entered manually) Adjustable display calculation method. Settings BarsHistory - the number of bars to be used to display the indicator. Method - method of calculation. AutoPeriod - automated period calculation (true
PS Wave Crossing MT4
Miguel Angel Vico Alba
5 (4)
Taking into account an efficiency factor and the CCI + RSI + MA, the result is a cross with a high probability rate. Each crossing could be taken as the "Delta" based on the above-mentioned factors. Feel free to adapt it to your liking. This is not an indicator "magical", is one more tool to help confirm signals. Parameters CCI Period RSI Period MA Period Coefficient (0 to 8) Drawing Style Color Main Line Color Signal Line Lines Width (1 to 5) Show arrows crossing Main/Signal Show arrows cros
The indicator detects and displays the 5-0 harmonic pattern on the chart according to the scheme provided in the screenshot. The pattern is plotted by the extreme values of the ZigZag indicator (included in the resources, does not require additional installation). After detecting the pattern, the indicator notifies of that by the pop-up window, a mobile notification and an email. The indicator highlights not only the complete figure, but also the time of its formation. During the formation the f
Strong Retracement Points Pro demo edition! SRP (Strong Retracement/Reversal Points) is a powerful and unique support and resistance indicator. It displays the closest important levels which we expect the price retracement/reversal! If all level are broken from one side, it recalculates and draws new support and resistance levels, so the levels might be valid for several days depending on the market! If you are still hesitating to start using this wonderful tool, you can check this link to see h
ZigZag Professional
Dmitriy Kashevich
5 (1)
the zigzag indicator draws lines on the chart from the highest point to the lowest There are built-in fibonacci levels built-in sound alert the indicator highlights trends on small timeframes with a thin line and trends highlights with a coarse line Fibonacci levels can be turned on and off in the settings settings are very simple and clear the same sound alert can be turned on and off, you can change the colors of the lines.
Fibonaccitools
Aymn Sʿyd Ahmd Hsn Alkwmy
Fibonacci retracements are popular tools that traders can use to draw support lines, identify resistance levels, place stop-loss orders, and set target prices. A Fibonacci retracement is created by taking two extreme points on a stock chart and dividing the vertical distance by the key Fibonacci ratios of 23.6%, 38.2%, 50%, 61.8%, and 100%. Fibonacci tools indicator will Draw Fibonacci Tools e.g. Retracement, Arc, Fan, Expansion, TimeZones. Based on zigzag indicator"
Auto AndrewFork
Noor Ghani Rahman
1 (1)
Auto Pitchfork Indicator The indicator calculate the Pitch fork for the previous Day (Selectable) with multiple Support and Resistance lines from the Median price which acts as Magnet for the Price that if price touch the above warning (1) or below warning (1) lines and not cross up or down then there is maximum possibilities that it will return to the Median Line, and thus maintain the Price Action in Cyclic Pattern to the Market Move. You are able to select how many warning lines you want to k
Pivot Point Multi Method is a fully automatic pivot point indicator and indicate support and resistances (S1,S2,S3,S4,R1,R2,R3,R4) based on four Methods that you can select on of them Pivot point detection and drawing support resistances Methods( Classic ,Camarilla ,Woodie ,Fibonacci) Pivot Point Multi Method is working on all time frames and all currency pairs and gold silver and crypto currencies . Recommended Setting : Pivot_Method    select one of the methods ( Classic ,Camarilla ,Woodi
Индикатор высчитывается по сложному авторскому алгоритму. Он строится с учетом тенденции по зонам перекупленности перепроданности объёмов . Это позволяет выявлять дивергенцию объёмов , выявить так называемые приседающие бары. Также он определяет уровни входа в рынок и цели. Средняя линия канала является предполагаемым уровнем отката. RPeriod- период расчета индикатора Indicator_Level - уровень зон перекупленности перепроданности Draw Fibo Levels - отображаем целевые уровни Fibo Level Col
Trend Ray
Andriy Sydoruk
The indicator shows the potential trend direction by cyclical-wave dependence. Thus, all the rays of the intersection will be optimal rays, in the direction of which the price is expected to move, taking into account the indicator period. Rays can be used as a direction for potential market movement. But we must not forget that the approach must be comprehensive, the indicator signals require additional information to enter the market.
Description: The indicator measures, through the zigzag indicator, the levels of trend or correction. It shows in the chart the levels of each low or high detected. KEY LINKS:   How to Install  –  Frequent Questions  -  All Products  How is this indicator useful? This indicator determines, depending on Zigzag parameter if a trend is beginning, developing, or ending This indicator determines the direction of the trend Components Levels as positive or negative numbers, depending on the direction
FREE
NO REPAINT ADVANCED CHART PATTERN INDICATOR By definition, a price ( chart)  pattern is a recognizable configuration of price movement that is identified using a series of  trendlines  and/or curves. When a price pattern signals a change in trend direction, it is known as a reversal pattern; a continuation pattern occurs when the trend continues in its existing direction following a brief pause. Advanced Chart Pattern Tracker is designed to find the MOST ACCURATE patterns. A special script is
This powerful tool combines the Zigzag algorithm with Fibonacci retracement levels, enhancing your trading experience in the MetaTrader 4 (MT4) platform. Zigzag with Fibo Indicator Time Frame :- 1H and above The   Zigzag with Fibo Indicator   is designed to identify trend direction and provide precise entry and exit points for forex trading. Here’s what makes it stand out: Zigzag Algorithm Integration : The indicator utilizes the Zigzag algorithm, which helps filter out market noise and highligh
FREE
The indicator detects and displays Shark harmonic pattern (see the screenshot). The pattern is plotted by the extreme values of the ZigZag indicator (included in the resources, no need to install). After detecting the pattern, the indicator notifies of that by a pop-up window, a mobile notification and an email. The indicator highlights the process of the pattern formation and not just the complete pattern. In the former case, it is displayed in the contour triangles. After the pattern is comple
ZigZag Fibo Retracement
Dang Khoa Nguyen
5 (1)
ZigZag Fibo Retracement Indicator Optimize Your Trading Strategy! Are you seeking to optimize your trading strategy in the financial markets? Explore the unique features of the ZigZag Fibo Retracement Indicator, a powerful tool designed to help you identify potential support and resistance levels based on the combination of ZigZag patterns and Fibonacci ratios. Integration of ZigZag Patterns and Fibonacci: The ZigZag Fibo Retracement Indicator combines the effectiveness of ZigZag patterns, helpi
FREE
TLM Map AM
Andriy Matviyevs'kyy
TLM Map AM (Trend Line Momentum Map) is an indicator developed based on a set of digital technical analysis indicators described in the article by Vladimir Kravchuk: " Digital indicators in the technical analysis of financial markets ". The indicator displays in a separate window a complex of digital technical analysis indicators such as FTLM and STLM. Recommended for use in conjunction with the RTL Map AM (Reference Trend Line Map) indicator. The indicator has no customizable parameters.
FREE
Average Daily Weekly Monthly Range Alerts. The most complete multi-period dynamic range indicator with full alert options. Visually displays the Average Range lines on chart + real time distances to the Range Highs and Lows. Notifications are sent when the average ranges are hit. An essential tool for any serious trader! Average period ranges, especially the ADR (Average Daily Range) for day traders, are one of the most useful and consistently reliable indicators available to traders. Always a
FiboZag
Andriy Sydoruk
Indicator FiboZag - transfer the indicator to the chart and the Fibonacci levels will be built automatically on the last ZigZag turn. The main advantage lies in the correct construction of Fibonacci levels and markup of price levels. Simple, visual and effective use. The indicator is not redrawn and does not lag. Works on all currency pairs and on all timeframes.
Market Structure Zig Zag
Lesedi Oliver Seilane
4.77 (22)
Free Market structure zig zag to assist in price action trading the screenshots describe how to use and how to spot patterns new version comes with alerts, email alert and  push notification alert can be used on all pairs  can be used on all timeframes  you can add additional confirmation indicators the indicator shows you your higher high and low highs as well as your lower lows and lower highs  the indication makes price action analysis easier to spot.
FREE
The indicator detects and displays 3 Drives harmonic pattern (see the screenshot). The pattern is plotted by the extreme values of the ZigZag indicator (included in the resources, no need to install). After detecting the pattern, the indicator notifies of that by a pop-up window, a mobile notification and an email. The indicator highlights the process of the pattern formation and not just the complete pattern. In the former case, it is displayed in the contour triangles. After the pattern is com
Candle EA MT4
Mansour Babasafary
4.58 (38)
This expert is based on patterns The main patterns of this specialist are candlestick patterns Detects trends with candlestick patterns It has a profit limit and a loss limit, so it has a low risk The best time frame to use this expert is M30 time frame The best currency pairs to use with this expert is the EURUSD, GBPUSD, AUDUSD, USDCAD currency pairs The price will increase by 100$ after every 10 purchases! Final price 2450$ Get a 50% bonus by buying (or even renting) any of our product
Gli utenti di questo prodotto hanno anche acquistato
Atomic Analyst
Issam Kassas
5 (1)
Innanzitutto, vale la pena sottolineare che questo indicatore di trading non è repaint, non è ridisegno e non presenta ritardi, il che lo rende ideale sia per il trading manuale che per quello automatico. L'Analista Atomico è un indicatore di azione del prezzo PA che utilizza la forza e il momentum del prezzo per trovare un miglior vantaggio sul mercato. Dotato di filtri avanzati che aiutano a rimuovere rumori e segnali falsi, e aumentare il potenziale di trading. Utilizzando più strati di in
ATTUALMENTE SCONTATO DEL 26% La soluzione migliore per ogni principiante o trader esperto! Questo indicatore è uno strumento di trading unico, di alta qualità e conveniente perché abbiamo incorporato una serie di caratteristiche proprietarie e una nuova formula. Con un solo grafico è possibile leggere la forza delle valute per 28 coppie Forex! Immaginate come migliorerà il vostro trading perché sarete in grado di individuare l'esatto punto di innesco di una nuova tendenza o di un'opportunit
TPSproTREND PrO
Roman Podpora
5 (15)
TPSpro TRENDPRO  - is a trend indicator that automatically analyzes the market and provides information about the trend and each of its changes, as well as giving signals for entering trades without redrawing! The indicator uses each candle, analyzing them separately. referring to different impulses - up or down impulse. Exact entry points into transactions for currencies, crypto, metals, stocks, indices!  -  Version MT5               DETAILED DESCRIPTION        /       TRADING SETUPS           
Attualmente 20% di sconto! La soluzione migliore per ogni principiante o trader esperto! Questo software per cruscotti funziona su 28 coppie di valute. Si basa su 2 dei nostri indicatori principali (Advanced Currency Strength 28 e Advanced Currency Impulse). Offre un'ottima panoramica dell'intero mercato Forex. Mostra i valori di forza delle valute avanzate, la velocità di movimento delle valute e i segnali per 28 coppie Forex in tutti i (9) timeframe. Immaginate come migliorerà il vostro t
Scalper Inside PRO
Alexey Minkov
4.75 (55)
SALE NOW! Limited Time Offer! An exclusive indicator that utilizes an innovative algorithm to swiftly and accurately determine the market trend. The indicator automatically calculates opening, closing, and profit levels, providing detailed trading statistics. With these features, you can choose the most appropriate trading instrument for the current market conditions. Additionally, you can easily integrate your own arrow indicators into Scalper Inside Pro to quickly evaluate their statistics and
TPSpro RFI Levels
Roman Podpora
5 (13)
A key element in trading is zones or levels from which decisions to buy or sell a trading instrument are made. Despite attempts by major players to conceal their presence in the market, they inevitably leave traces. Our task was to learn how to identify these traces and interpret them correctly. Reversal First Impulse levels (RFI)   -  Version MT5                INSTRUCTIONS                 RUS                 ENG                                       R ecommended to use with an indicator   -  
Presentazione       Quantum Trend Sniper Indicator   , l'innovativo indicatore MQL5 che sta trasformando il modo in cui identifichi e scambi le inversioni di tendenza! Sviluppato da un team di trader esperti con un'esperienza di trading di oltre 13 anni,       Indicatore Quantum Trend Sniper       è progettato per spingere il tuo viaggio di trading verso nuove vette con il suo modo innovativo di identificare le inversioni di tendenza con una precisione estremamente elevata. *** Acquista Quant
Quantum Breakout Indicator PRO
Bogdan Ion Puscasu
4.96 (26)
Presentazione       Quantum Breakout PRO   , l'innovativo indicatore MQL5 che sta trasformando il modo in cui scambi le zone di breakout! Sviluppato da un team di trader esperti con un'esperienza di trading di oltre 13 anni,   Quantum Breakout PRO   è progettato per spingere il tuo viaggio di trading a nuovi livelli con la sua strategia innovativa e dinamica della zona di breakout. Quantum Breakout Indicator ti fornirà frecce di segnalazione sulle zone di breakout con 5 zone target di prof
Advanced Supply Demand
Bernhard Schweigert
4.92 (310)
CURRENTLY 26% OFF !! Best Solution for any Newbie or Expert Trader! This indicator is a unique, high quality and affordable trading tool because we have incorporated a number of proprietary features and a new formula. With this update, you will be able to show double timeframe zones. You will not only be able to show a higher TF but to show both, the chart TF, PLUS the higher TF: SHOWING NESTED ZONES. All Supply Demand traders will love it. :) Important Information Revealed Maximize the potenti
Presentazione dell'indicatore Miraculous Forex: Libera il potere del trading preciso Sei stanco di cercare il miglior indicatore Forex che fornisca risultati eccezionali su tutti i timeframe? Non cercare oltre! L'indicatore Miraculous Forex è qui per rivoluzionare la tua esperienza di trading e portare i tuoi profitti a nuove vette. Basato su tecnologia all'avanguardia e anni di sviluppo accurato, l'indicatore Miraculous Forex si distingue come l'apice di potenza e precisione nel mercato delle v
Entry Points Pro
Yury Orlov
4.7 (225)
Indicatore top per MT5 che fornisce segnali accurati per entrare in un trade senza riverniciare! Può essere applicato a qualsiasi attività finanziaria: forex, criptovalute, metalli, azioni, indici.  La versione MT5 è qui Fornirà segnali di trading piuttosto precisi e ti dirà quando è meglio aprire un trade e chiuderlo. Guarda il video (6:22) con un esempio di elaborazione di un solo segnale che ha ripagato l'indicatore! La maggior parte dei trader migliora i propri risultati di trading
TrendMaestro
Stefano Frisetti
5 (2)
nota: questo indicatore e' per METATRADER4, se vuoi la versione per  METATRADER5 questo e' il link:  https://www.mql5.com/it/market/product/108123 TRENDMAESTRO riconosce un nuovo TREND sul nascere, non sbaglia mai. La sicurezza di identificare un nuovo TREND non ha prezzo. DESCRIZIONE TRENDMAESTRO identifica un nuovo TREND sul nascere, questo indicatore prende in esame la volatilita' i volumi ed il momentum per identificare il momento in cui c'e' un'esplosione di uno  opiu' di questi dati
FX Power MT4 NG
Daniel Stein
5 (8)
Ricevi il tuo aggiornamento quotidiano sul mercato con dettagli e schermate tramite il nostro Morning Briefing qui su mql5 e su Telegram ! FX Power MT4 NG è la nuova generazione del nostro popolare misuratore di forza delle valute, FX Power. Cosa offre questo misuratore di forza di nuova generazione? Tutto ciò che avete amato dell'FX Power originale IN PIÙ Analisi della forza di ORO/XAU Risultati di calcolo ancora più precisi Periodi di analisi configurabili individualmente Limite di calcolo pe
Price Action Entry Alerts
Stephen Sanjeeve Sahayam
5 (3)
Questo indicatore controlla ogni barra per la pressione di acquisto o vendita e identifica 4 tipi di modelli di candele con il volume più alto. Queste candele vengono quindi filtrate utilizzando diversi filtri lineari per mostrare segnali di acquisto o vendita. I segnali funzionano meglio, in combinazione con una direzione temporale più elevata e quando scambiati durante le ore ad alto volume. Tutti i filtri sono personalizzabili e funzionano in modo indipendente. Può visualizzare i segnali di
FX Volume
Daniel Stein
4.6 (35)
Ricevi il tuo aggiornamento quotidiano sul mercato con dettagli e schermate tramite il nostro Morning Briefing qui su mql5 e su Telegram ! FX Volume è il PRIMO e UNICO indicatore di volume che fornisce una visione REALE del sentiment del mercato dal punto di vista del broker. Fornisce informazioni straordinarie su come gli operatori di mercato istituzionali, come i broker, sono posizionati sul mercato Forex, molto più velocemente dei rapporti COT. Vedere queste informazioni direttamente sul vo
Up down v6T
Guner Koca
5 (1)
Thise indicator is up down v6  comes with tradingwiev version. purchased people, after installed on terminal ,contact me on mql5  to get BONUS  TradingView version. up-down indicator is no repaint and works all pairs and lower than weekly time frames charts. it is suitable also 1 m charts for all pairs. and hold long way to signal. dont gives too many signals. when red histogram cross trigger line that is up signal.and price probably will down when blue histogram cross trigger line that is dow
How to use Pair Trading Station Pair Trading Station is recommended for H1 time frame and you can use it for any currency pairs. To generate buy and sell signal, follow few steps below to apply Pair Trading Station to your MetaTrader terminal. When you load Pair Trading Station on your chart, Pair Trading station will assess available historical data in your MetaTrader platforms for each currency pair. On your chart, the amount of historical data available will be displayed for each currency pai
Cycle Sniper
Elmira Memish
4.4 (35)
NEW YEAR SALE PRICE FOR LIMITED TIME!!! Please contact us after your purchase and we will send you the complimentary indicators to complete the system Cycle Sniper is not a holy grail but when you use it in a system which is explained in the videos, you will feel the difference. If you are not willing to focus on the charts designed with Cycle Sniper and other free tools we provide, we recommend not buying this indicator. We recommend watching the videos about the indiactor and system before pu
PTS Precision Index Oscillator V2
PrecisionTradingSystems
5 (1)
L'Oscillatore dell'Indice di Precisione (Pi-Osc) di Roger Medcalf di Precision Trading Systems La Versione 2 è stata attentamente rielaborata per essere estremamente veloce nel caricarsi sul tuo grafico e sono state apportate alcune altre migliorie tecniche per migliorare l'esperienza. Il Pi-Osc è stato creato per fornire segnali di sincronizzazione del trading accurati progettati per individuare punti di esaurimento estremi, i punti ai quali i mercati vengono costretti a recarsi solo per e
TakePropips Donchian Trend Pro
Eric John Pajarillaga Aldana
4.82 (17)
TakePropips Donchian Trend Pro   (MT4) è uno strumento potente ed efficace che rileva automaticamente la direzione del trend utilizzando il canale Donchian e ti fornisce segnali di trading di entrata e uscita! Questo indicatore multifunzione include uno scanner di tendenza, segnali di trading, pannello statistico, screener, sessioni di trading e dashboard della cronologia degli avvisi. È progettato per fornirti segnali di trading e farti risparmiare ore analizzando i grafici! È possibile scarica
GOLD Impulse with Alert
Bernhard Schweigert
4.56 (9)
Questo indicatore è una super combinazione dei nostri 2 prodotti Advanced Currency IMPULSE with ALERT  +   Currency Strength Exotics . Funziona per tutti i time frame e mostra graficamente l'impulso di forza o debolezza per le 8 valute principali più un simbolo! Questo indicatore è specializzato nel mostrare l'accelerazione della forza delle valute per qualsiasi simbolo come oro, coppie esotiche, materie prime, indici o futures. Primo nel suo genere, qualsiasi simbolo può essere aggiunto
PTS Divergence Buy Finder
PrecisionTradingSystems
PTS - Divergence Buy Finder di Precision Trading Systems Il Precision Divergence Finder è stato progettato per individuare i minimi di mercato con estrema precisione e lo fa frequentemente. Nell'analisi tecnica, l'arte di individuare i minimi di mercato è generalmente molto più semplice rispetto a individuare i massimi, e questo strumento è progettato appositamente per questa finalità. Dopo aver identificato una divergenza rialzista, è saggio attendere che la tendenza si inverta prima di ac
L'indicatore di vendita PTS Divergence Finder di Roger Medcalf - Precision Trading Systems. Questo indicatore fornisce solo segnali ribassisti - di vendita. In primo luogo, mi è stato chiesto molte volte perché non avessi fornito un indicatore di divergenza di vendita mentre fornivo volentieri un indicatore di ricerca di divergenza di segnali di acquisto da molti anni. Ho risposto che le divergenze di vendita sono meno affidabili delle divergenze di acquisto, cosa che è ancora vera. Alcune soluz
TPA True Price Action indicator reveals the true price action of the market makers through 100% non-repainting signals (except early signals mode) strictly at the close of a candle! TPA shows entries and re-entries, every time the bulls are definitely stronger than the bears and vice versa. Not to confuse with red/green candles. The shift of power gets confirmed at the earliest stage and is ONE exit strategy of several. There are available now two free parts of the TPA User Guide for our custo
Indicator : RealValueIndicator Description : RealValueIndicator is a powerful tool designed specifically for trading on the EURUSD pair. This indicator analyzes all EUR and USD pairs, calculates their real currency strength values, and displays them as a single realistic value to give you a head start on price. This indicator will tell you moves before they happen if you use it right. RealValueIndicator allows you to get a quick and accurate overview of the EURUSD currency pair tops and bottoms,
XQ Indicator MetaTrader 4
Marzena Maria Szmit
3 (2)
Step into the realm of Forex trading with confidence and precision using XQ, a cutting-edge Forex indicator designed to elevate your trading game to unprecedented heights. Whether you're a seasoned trader or just stepping into the world of currency exchange,   XQ Forex Indicator   empowers you with the insights and signals needed to make informed trading decisions. The signal conditions are a combination of three indicators, and XQ Forex Indicator only display  medium and long-term trends . The
Vi presentiamo ON Trade Waves Patterns Harmonic Elliot Wolfe, un indicatore avanzato progettato per rilevare vari tipi di pattern sul mercato utilizzando metodi sia manuali che automatici. Ecco come funziona: Pattern Armonici: Questo indicatore è in grado di individuare pattern armonici che appaiono sul vostro grafico. Questi pattern sono fondamentali per i trader che praticano la teoria del trading armonico, come descritta nel libro di Scott Carney "Harmonic Trading vol 1 & 2". Che li disegniat
Currency Strength Exotics
Bernhard Schweigert
4.88 (33)
ATTUALMENTE SCONTATO DEL 20%! La soluzione migliore per qualsiasi principiante o trader esperto! Questo indicatore è specializzato nel mostrare la forza della valuta per qualsiasi simbolo come coppie esotiche, materie prime, indici o futures. È il primo nel suo genere, qualsiasi simbolo può essere aggiunto alla nona riga per mostrare la vera forza della valuta di Oro, Argento, Petrolio, DAX, US30, MXN, TRY, CNH ecc. Si tratta di uno strumento di trading unico, di alta qualità e conveniente
Royal Scalping Indicator M4
Vahidreza Heidar Gholami
4.17 (6)
Royal Scalping Indicator is an advanced price adaptive indicator designed to generate high-quality trading signals. Built-in multi-timeframe and multi-currency capabilities make it even more powerful to have configurations based on different symbols and timeframes. This indicator is perfect for scalp trades as well as swing trades. Royal Scalping is not just an indicator, but a trading strategy itself. Features Price Adaptive Trend Detector Algorithm Multi-Timeframe and Multi-Currency Trend Low
Gartley Hunter Multi MT4
Siarhei Vashchylka
4.67 (3)
Gartley Hunter Multi - An indicator for searching for harmonic patterns simultaneously on dozens of trading instruments and on all classic timeframes: (m1, m5, m15, m30, H1, H4, D1, Wk, Mn). Manual (Be sure to read before purchasing) | Version for MT5 Advantages 1. Patterns: Gartley, Butterfly, Shark, Crab. Bat, Alternate Bat, Deep Crab, Cypher 2. Simultaneous search for patterns on dozens of trading instruments and on all classic timeframes 3. Search for patterns of all possible sizes. Fr
Altri dall’autore
TradePad
Ruslan Khasanov
5 (2)
Una soluzione semplice per operazioni di trading veloci e controllo della posizione su diversi strumenti di trading. L'interfaccia del pannello è semplice ed intuitiva. Per un comodo lavoro di un trader, il pannello ha: gestore di tasti "caldi", con cui è possibile gestire tutte le operazioni di trading e i periodi grafici; uno strumento per contrassegnare i livelli di negoziazione quando si effettuano ordini in sospeso o di mercato per valutare i rischi e i potenziali profitti quando si imposta
MultiCharts MT5
Ruslan Khasanov
5 (1)
Uno strumento di monitoraggio multivaluta sotto forma di pannello che mostra i grafici di qualsiasi strumento selezionato da un trader in una finestra separata. Consente al trader di effettuare un'analisi visiva del movimento del prezzo su diversi strumenti e periodi di tempo diversi, per passare rapidamente tra gli strumenti selezionati. Una versione demo è disponibile nella pagina di descrizione del prodotto TradePad:    https://www.mql5.com/en/blogs/post/751207 Incluso con un'altra utility d
Quick Info
Ruslan Khasanov
Quick Info è un'utilità di informazioni per raccogliere e fornire a un trader varie informazioni utili necessarie nel trading sui mercati finanziari ogni giorno. Tutte le informazioni necessarie vengono raccolte e raggruppate in una finestra separata. Nella prima scheda troverai le statistiche commerciali per il periodo di tempo selezionato. Per raccogliere statistiche commerciali, è sufficiente selezionare un periodo di tempo dall'elenco o specificare le date di inizio e fine del periodo per
Candle hunter
Ruslan Khasanov
5 (1)
Indicatore per analisi grafica. Segna i principali modelli di candele giapponesi sul grafico. Al momento, il trader ha a disposizione la seguente serie di modelli:  - Bearish/Bullish Abandoned Baby;  - Bearish Advance Block;  - Bearish Deliberation;  - Bearish/Bullish Belt Hold;  - Bearish/Bullish Engulfing;  - Bearish Shooting Star;  - Bearish Evening Star;  - Bearish Evening Doji Star;  - Bearish/Bullish Doji Star;    - Bearish/Bullish Tri-Star;  - Bearish Hanging Man;  - Bearish/Bullish Hara
Filtro:
4example
245
4example 2021.03.07 13:11 
 

Wonderful indicator. Your can see at a glance what a pair is doing and have everything in one chart. More over, the indicator has alerts and you can add moving averages of your choice to it. So now I can receive alerts from all pairs since I have only one profile active. It is basically a scanner with multi time frames enabled. The developer answers really fast and is offering advice on how to twick and have it the way you desire. Not many developers doing this with their product. What took me before several minutes, now it is a breeze. I have one chart with all pairs open on daily. This way I can see at a glance what the main trend is doing. Another one with 1 hour alerts on all pairs I consider worth trading. ... WONDERFUL work. Thank you.

Iqbal Aroussi
114
Iqbal Aroussi 2020.05.10 15:43 
 

A very good tool to visualize and analyze several trading symbols quickly. Without the need of having multiple monitors.

Very useful when you're on the move, like traveling or simply not at your trading desk, working from your laptop.

I contacted the Dev Ruslan a Sunday morning for an issue regarding the indicator not working on my Linux MT4 installation. I was amazed that he fixed quickly and uploaded the new version to Market Place within the hour that we chatted.

I'm a happy buyer of the full version, really worth it.

Iqbal

Rispondi alla recensione
Versione 23.1 2023.03.27
La nuova versione contiene numerose modifiche e miglioramenti.
Versione 22.12 2022.12.08
Bug corretti. Prestazione migliorata. Raccolta aggiornata di indicatori di tendenza.
Versione 21.3 2021.03.16
Added notifications when moving averages cross.
Added a new parameter in the indicator settings - Allowed pairs for Notifications. List of symbols for which notifications are allowed. Specify, separated by a space, pairs on which notifications are allowed, for example: EURUSD, M5 GBPUSD, H1 USDJPY, M15
If the parameter is left blank, then notifications will be allowed for all pairs specified in the indicator settings.
Versione 20.5 2020.05.10
Fixed a bug for currency pairs that have suffixes/prefixes in their names