• Übersicht
  • Bewertungen (23)
  • Diskussion (640)
  • Neue Funktionen

Harmonic Pattern Plus MT4

4.44

Introduction

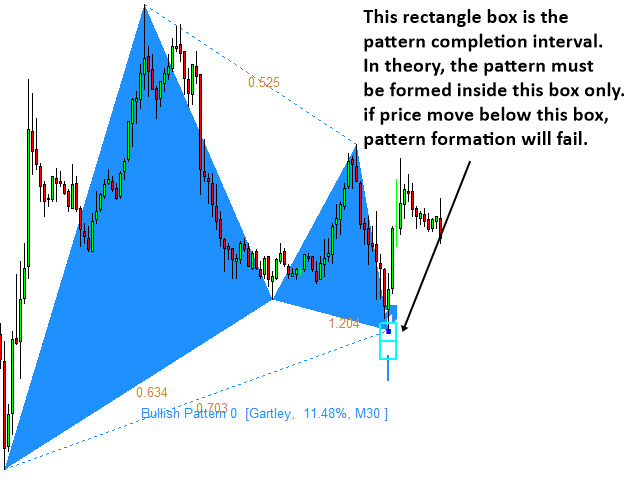
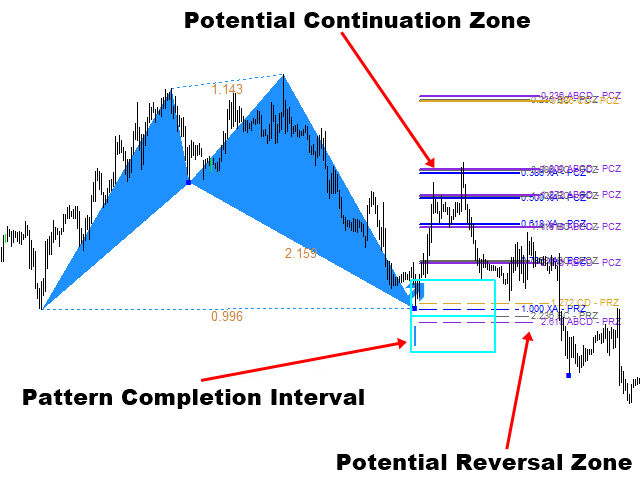
Harmonic Patterns are best used to predict potential turning point. Traditionally, Harmonic Pattern was identified manually connecting peaks and troughs points in the chart. Manual harmonic pattern detection is painfully tedious and not suitable for everyone. You are often exposed under subjective pattern identification with manual pattern detection. To avoid these limitations, Harmonic Pattern Plus was designed to automate your harmonic pattern detection process. The functionality of Harmonic Pattern plus is beyond manual pattern detection and textbook approach. Harmonic Pattern Plus provides many harmonic patterns we have tested in our research. In addition, you can use the three important trading elements including Pattern Completion Interval (PCI), Potential Reversal Zone (PRZ), and Potential Continuation Zone (PCZ) to improve accuracy of your trading. You will experience amazing performance using our Harmonic Pattern Plus for your trading. Especially, pattern completion interval provides the trading zone which you can manage your trading and risk easily.


Main Features

  • 11 Harmonic Patterns can be detected automatically
  • Support multiple timeframe pattern scanning (This means you need one chart per symbol only.)
  • Potential Reversal Zone (PRZ) detection for Point D identification
  • Potential Continuation Zone (PCZ) detection for future price movement prediction
  • Pattern Completion Interval (PCI) detection for precision trading
  • Historical pattern forward and backward reply function to create new trading strategy
  • Pattern locking and unlocking feature to prevent repainting of patterns
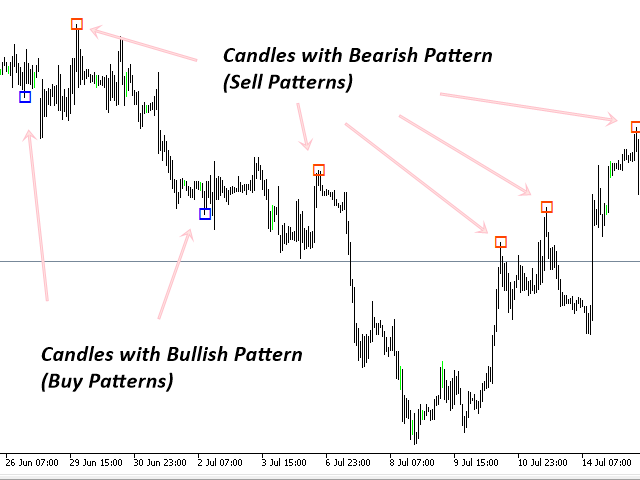
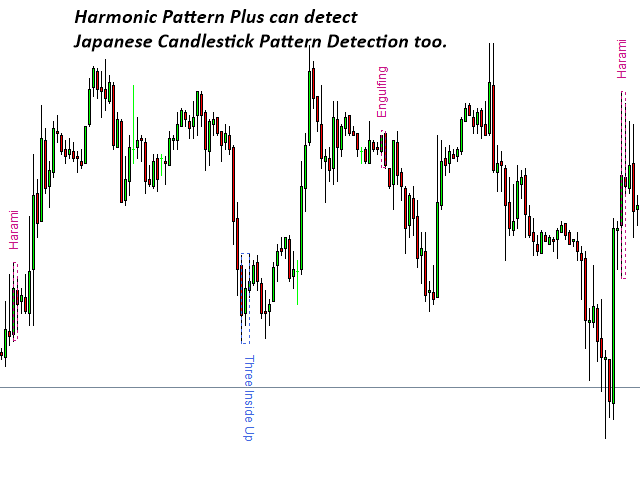
  • 52 different bullish and bearish Candlestick pattern recognition feature
  • Support Email, Sound alerts or Push Notification


Recognizable and Tradable Patterns

  • Butterfly
  • Gartley
  • Bat
  • Alternate Bat
  • AB=CD
  • Shark
  • Crab
  • Deep Crab
  • Cypher
  • 5-0 Patterns
  • 3 Drives Pattern
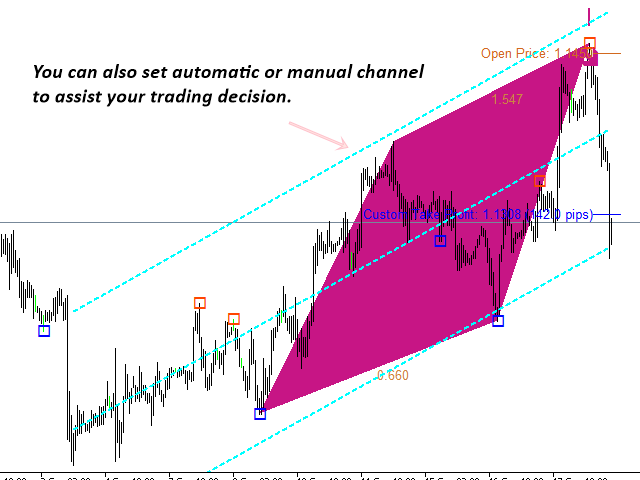
  • Automatic drawing of Linear regression channel
  • Candlestick patterns: detect 52 different bearish and bullish candlestick patterns. The candlestick patterns include hanging man, shooting star, engulfing, doji, harami, kicking, etc. Our Candlestick Pattern detection algorithm uses purely price action only.


Indicator Setting and Parameters

Default setting will work most of time. If you want to change how the indicator looks in your chart, you can certainly change them from input setting. All the input settings are self-explanatory. The simple description is given on left hand side columns and you need to change value on your right hand side columns.


Trading Strategy Guide

In fact, the detailed trading strategy with harmonic pattern can be found from the link below:

https://www.mql5.com/en/blogs/post/747647

For the most important trading strategy, you can have a look at the Young’s Mutual Pattern Turning Point Strategy in the following books: Guide to Precision Harmonic Pattern Trading and  Science Of Support, Resistance, Fibonacci Analysis, Harmonic Pattern, Elliott Wave and X3 Chart Pattern.


Important Note

This is the off the shelf product. Therefore, we do not accept any modification or customization request on this product. In addition, we do not provide any code library or any support for your coding for this product.


Bewertungen 20
gevans49
263
gevans49 2021.06.21 17:24 
 

I like everything about this indicator and all of its components.

teddyawa
45
teddyawa 2020.12.03 12:39 
 

this is a great tool. highly recommended

Roger
526
Roger 2019.10.10 15:44 
 

There is a learning curve but I would not be without this in my trading toolbox. NOTE: Try swing trading with it on the H1 timeframe.

Empfohlene Produkte
Introduction to X3 Chart Pattern Scanner X3 Cherart Pattern Scanner is the non-repainting and non-lagging indicator detecting X3 chart patterns including Harmonic pattern, Elliott Wave pattern, X3 patterns, and Japanese Candlestick patterns. Historical patterns match with signal patterns. Hence, you can readily develop the solid trading strategy in your chart. More importantly, this superb pattern scanner can detect the optimal pattern of its kind. In addition, you can switch on and off individu
Elliott Wave Trend was designed for the scientific wave counting. This tool focuses to get rid of the vagueness of the classic Elliott Wave Counting using the guideline from the template and pattern approach. In doing so, firstly Elliott Wave Trend offers the template for your wave counting. Secondly, it offers Wave Structural Score to assist to identify accurate wave formation. It offers both impulse wave Structural Score and corrective wave Structure Score. Structural Score is the rating to sh
The Penta-O is a 6-point retracement harmonacci pattern which usually precedes big market movements. Penta-O patterns can expand and repaint quite a bit. To make things easier this indicator implements a twist: it waits for a donchian breakout in the right direction before signaling the trade. The end result is an otherwise repainting indicator with a very reliable trading signal. The donchian breakout period is entered as an input. [ Installation Guide | Update Guide | Troubleshooting | FAQ | A
Reversal Pattern Pro
Boonyapagorn Rodvattanajinda
Reversal Patterns Pro Reversal Patterns Pro is a Price Action (PA) analytical tool that scans the reversal patterns.  - Finds and marks the most dependable Japanese candlestick patterns in real-time. - Supports all time frames (Best for Scalping) - Doesn't repaint making it an exceptional indicator for Expert Advisors. Input parameters : - Support & Resistance Mode ( true or false ) for enabling advanced filtering - Donchian Period - RSI Period - RSI Oversold Level - RSI Overbought Level - 
Gartley Projection D
Oleksandr Medviediev
3.71 (7)
Der Indikator identifiziert die harmonischen Muster (XABCD) gemäß den Entwicklungen von H.M. Gartley („Profits in the Stock Market“, 1935г). Der D-Punkt wird als Punkt in der perspektivischen Projektion projiziert (geben Sie in den Einstellungen ProjectionD_Mode = true an). Wird nicht neu gezeichnet. Wenn ein Balken des Arbeitszeitraums schließt und sich der identifizierte Musterpunkt während der Balken von Patterns_Fractal_Bars nicht bewegt hat, erscheint ein Pfeil auf dem Diagramm (in Ric
PZ 123 Pattern
PZ TRADING SLU
1 (1)
Das 123-Muster ist eines der beliebtesten, leistungsstärksten und flexibelsten Diagrammmuster. Das Muster besteht aus drei Preispunkten: einem Boden, einem Gipfel oder Tal und einem Fibonacci-Retracement zwischen 38,2% und 71,8%. Ein Muster gilt als gültig, wenn der Preis jenseits des letzten Gipfels oder Tals abbricht, in dem der Indikator einen Pfeil zeichnet, einen Alarm auslöst und der Handel platziert werden kann. [ Installationsanleitung | Update-Anleitung | Fehlerbehebung | FAQ | Alle Pr
Monster Harmonic Indicator
Paul Geirnaerdt
4.59 (29)
Monster Harmonics Indicator is a harmonic pattern indicator. It recognizes Gartley, Bat, Crab, Butterfly, Cypher, White Swan, Black Swan, Shark and several other patterns. Projected patterns that are not yet completed are recognized, too. Monster even shows the PRZ (Potential Reversal Zone). Users can add their own user defined patterns to Monster. Besides the current pattern, Monster also shows all patterns in the symbols history. Monster will provide alerts for developing patterns. Introduced
The indicator provides a superior alternative to price action analysis. It enables the identification of normalized patterns, which are then transformed into a graphical representation to forecast future steps within a time series. In the top-left corner, you'll find information regarding the expected prediction accuracy, determined through a complex MSQE calculation. You have the flexibility to adjust the time window, making it easy to validate the indicator's performance. Additionally, you can
Master Scalping M1 ist ein innovativer Indikator, der einen Algorithmus verwendet, um den Trend schnell und genau zu bestimmen. Der Indikator berechnet den Zeitpunkt zum Öffnen und Schließen von Positionen, die Indikatoralgorithmen ermöglichen es Ihnen, die idealen Zeitpunkte für den Einstieg in einen Handel (Kauf oder Verkauf eines Vermögenswerts) zu finden, was den Erfolg von Transaktionen für die meisten Händler erhöht. Vorteile des Indikators: Einfach zu bedienen, überladen Sie das Diagramm
This is an arrow indicator without a future function,developed based on the most advanced profit trading algorithms.It has the most innovative and advanced dual trend analysis module, as well as the latest and highly effective market trend prediction algorithm.Trends are your friends, and following larger trends can earn the maximum profit in foreign exchange. This indicator helps traders identify current trends and track them. Someone once made a profit of 10 times in a week by relying on it.No
Price Breakout pattern Scanner is the automatic scanner for traders and investors. It can detect following patterns automatically from your chart. Head and Shoulder - Common tradable pattern. Reverse Head and Shoulder - This pattern is the reverse formation of the Head and Shoulder. Double Top - When the price hits resistance level twice and decline toward the support level, the trader can anticipate sudden bearish breakout through the support level. Double Bottom - The double bottom pattern is
The CCI Divergence is a reasonably useful indicator in itself, but it is even more effective when used with divergence pattern trading. The CCI Divergence indicator signal is one of the most potent signals among the indicators that exist in the market. Here is new version for Divergence Indicator using CCI method, with more improvements. Divergences indicate a potential investment point because the directional moment does not confirm the price. A bullish divergence occurs when the underlying
Crazy Dancing moving RES/SUP Levels Automatic redrawing of moving Supports and resistances levels  to indicate price breaking supports (signal SELL)  or breaking resistance levels (signal BUY) Very simple appearing indicator but very clever and smart too !!!! Main Inputs: # of bars for the support and resistances levels + the initial shift from start + moving average for filter signaling Smaller values for bars /shift inputs when using Higher Time frames (D1-H4) and the reverse higher values for
All Symbols   AND  All Time frames Scan                                                                                                                 Document Introduction   The ABCD is a basic harmonic pattern. The ABCD pattern is a visual, geometric chart pattern comprised of three consecutive price swings. It looks like a diagonal lightning bolt and can indicate an upcoming trading opp
Trade with Gann on your side!! MASTER CIRCLE 360 CIRCLE CHART, originally created by Gann admitted that this is “The Mother of all charts”. It is one of the last studies that this great trader left for us. The numeric tab le is apparently quite simple like all the tables and is based on square numbers, the SQUARE OF 12 and is by evolution, one of the most important square numbers. Here we can find CYCLE, PRICE AND TIME thanks to angles and grades, to show past and future support and resistance.
Introduction to Harmonic Volatility Indicator Harmonic Volatility Indicator is the first technical analysis applying the Fibonacci analysis to the financial volatility. Harmonic volatility indicator is another level of price action trading tool, which combines robust Fibonacci ratios (0.618, 0.382, etc.) with volatility. Originally, Harmonic Volatility Indicator was developed to overcome the limitation and the weakness of Gann’s Angle, also known as Gann’s Fan. We have demonstrated that Harmonic
Levels Market
Vitalii Zakharuk
Levels Market is one of the simplest, but no less effective tools from this. Pivot points can be built from these levels, levels are constructed as statistical significance at a given point in time. Trading by levels is a classic in the work of a trader. You can use them as a ready-made trading strategy or as an additional filter in your trading system. In the settings you can specify the offset for building levels. Interpretation of levels: Lines 8/8 and 0/8 (Final Resistance). These lines a
RTrends
Nikolay Likhovid
The RTrends indicator does two things: first, it automatically draws the layout of the price chart by plotting trend lines and, secondly, it produces bearish and bullish signals. The layout reflects the fractal nature of the market. Trends from different time horizons are applied simultaneously on the chart. Thus, from a single chart a trader can see trend lines of higher timeframes. The lines, depending on the horizon, differ in color and width: the older the horizon, the thicker the line is. T
Trend lines master
The Trading Team Ltd
5 (1)
Launch promotion For a limited time only:  30$ instead of 157$ Summary Create precise trend lines in a second Description This indicator will draw your trend lines automatically with great precision, saving you some precious time. It uses Bill Williams Fractals to identify the key points and draws both inner and outer trend lines. Features Automatically draws precise trend lines
Alpha Trend Zeichen ist seit langem ein sehr beliebtes Handelstool in unserem Unternehmen. Es kann unser Handelssystem überprüfen und Handelssignale klar anzeigen, und die Signale werden nicht driften. Hauptfunktionen: Anhand der Marktanzeige aktiver Bereiche können Indikatoren intuitiv bestimmen, ob der aktuelle Markttrend zu einem Trendmarkt oder zu einem volatilen Markt gehört. Und betreten Sie den Markt gemäß den Indikatorpfeilen, mit grünen Pfeilen für Kauf und roten Pfeilen für Verk
Auto Levels
Yaroslav Varankin
Auto Level this tool is able to determine the levels of support and resistance. search and display when the price has broken through the level and when it pushed off from it. the indicator can be useful if you use resistance support levels in your trading. or the highs and lows of the price, then it will greatly simplify your work and help you more quickly and more accurately determine the rebound or breakdown of the current trend or tendencies level. blue line bottom uptrend red line on top dow
Expert Advisor designed for trading Engulfing Candle Patterns within a manually input price range the D point of harmonic patterns , gartley , bat cypher butterfly ect.  This is the  full version , word test in the title is an error How Does It Work Step 1 Identify a price range around the end point D of your harmonic pattern. Input two prices into the EA settings   Inp9 Upper Level- type the highest price where an engulfing candle pattern can occur. Inp9 Lower Level - type the lowest price wh
FREE
The Sensitive Volume indicator is an indicator designed to generate trading signals. The purpose of this indicator is to generate signals from the highest probability of trading. Using a number of price movements and a set of indicator properties to generate these signals.  Easy to use, simple and understandable to the user. With alert features, user signals can be reached quickly.  Visually the user can easily recognize the signals. This indicator will not repaint. Parameters Trend_Period - p
Gold Phoenix
Yaroslav Varankin
The perfect tool for Scalng in the Forex markets You can trade both from signal to signal and using take profit  The algorithm does not use Zigzag!  No redrawing!  This is a channel instrument that uses a moving average as a filter. Moving Average  There are 2 parameters for the settings Ma Period = 5 period Moving Average  Channel 1.0 distance of channel lines from the chart Price Signal Filter - calculation of signal opening and filter There is a complete set of Alert There is a multi-timefram
The indicator displays Renko bars on the chart, uses them to plot the ZigZag - trend lines connecting the local Lows and Highs of the price movement, and highlights them based on the Gartley patterns, showing the potential price reversal points. Renko - specialized display of the price action, in which the graph is displayed not every bar of the time frame, but only under the condition that the price had passed more than the specified number of points. Renko bars are not bound to a time frame, s
Are you tired of plotting fibonacci retracements or extensions manually? This indicator displays fibonacci retracements or extensions automatically, calculated from two different price points, without human intervention or manual object anchoring.  [ Installation Guide | Update Guide | Troubleshooting | FAQ | All Products ] Easy to use Manual anchoring is not needed Perfect for price confluence studies The indicator evaluates if retracements or extensions are needed Once drawn, you can manually
Introduction Excessive Momentum Indicator is the momentum indicator to measure the excessive momentum directly from raw price series. Hence, this is an extended price action and pattern trading. Excessive Momentum Indicator was originally developed by Young Ho Seo. This indicator demonstrates the concept of Equilibrium Fractal Wave and Practical Application at the same time. Excessive Momentum detects the market anomaly. Excessive momentum will give us a lot of clue about potential reversal and
Day Pattern
Oleksandr Martsynyshen
Description: - D ay Pattern - an indicator that helps to identify patterns of price changes for the development of trading algorithms and strategies. For whom this tool? - For developers of trading strategies and algorithms. - Medium- and long-term traders. Time frames H1-W1. Features of the indicator: - There is a function of exporting indicator values to a file of the csv format. - Using the information panel, you can conduct an express analysis of trading tool. - The indicat
The indicator detects and displays М. Gartley's Butterfly pattern. The pattern is plotted by the extreme values of the ZigZag indicator (included in the resources, no need to install). After detecting the pattern, the indicator notifies of that by the pop-up window, a mobile notification and an email. The pattern and wave parameters are displayed on the screenshots. The default parameters are used for demonstration purposes only in order to increase the amount of detected patterns. Parameters
We present you the indicator "Candle closing counter", which will become your indispensable assistant in the world of trading. That’s why knowing when the candle will close can help: If you like to trade using candle patterns, you will know when the candle will be closed. This indicator will allow you to check if a known pattern has formed and if there is a possibility of trading. The indicator will help you to prepare for market opening and market closure. You can set a timer to create a p
Käufer dieses Produkts erwarben auch
FX Volume
Daniel Stein
4.58 (33)
Erhalten Sie Ihr tägliches Marktupdate mit Details und Screenshots über unser Morning Briefing hier auf mql5 und auf Telegram ! FX Volume ist der ERSTE und EINZIGE Volumenindikator, der einen ECHTEN Einblick in die Marktstimmung aus Sicht eines Brokers bietet. Es bietet fantastische Einblicke in die Positionierung von institutionellen Marktteilnehmern, wie z.B. Brokern, auf dem Forex-Markt, viel schneller als COT-Berichte. Diese Informationen direkt auf Ihrem Chart zu sehen, ist der wahre Game
Atomic Analyst
Issam Kassas
5 (2)
Zunächst einmal ist es erwähnenswert, dass dieser Handelsindikator nicht neu malt, nicht neu zeichnet und keine Verzögerung aufweist, was ihn sowohl für manuellen als auch für Roboterhandel ideal macht. Benutzerhandbuch: Einstellungen, Eingaben und Strategie. Der Atom-Analyst ist ein PA-Preisaktionsindikator, der die Stärke und das Momentum des Preises nutzt, um einen besseren Vorteil auf dem Markt zu finden. Ausgestattet mit fortschrittlichen Filtern, die helfen, Rauschen und falsche Signale z
TPSpro RFI Levels
Roman Podpora
4.82 (22)
ANWEISUNGEN    Russland -    ENG    Die Empfehlung basiert auf dem Indikator -   TPSpro   TREND PRO -   Version MT5 Die wichtigsten Elemente in der Branche sind entweder in Zonen oder in der Fabrik enthalten, oder sie führen zu einer Lösung bei einem Kauf oder dem Verkauf eines anderen Instruments. Wenn viele Menschen ihre Rechte nicht auf dem Händlerkonto verschlüsseln, werden die Folgen nicht schnell genug sein. Ich habe es damit abgeschlossen, dass ich diese Folgen nun noch interpretieren un
Dynamic Forex28 Navigator
Bernhard Schweigert
5 (2)
Dynamic Forex28 Navigator – Das Forex-Handelstool der nächsten Generation AKTUELL 49 % RABATT. Dynamic Forex28 Navigator ist die Weiterentwicklung unserer seit langem beliebten Indikatoren und vereint die Leistung von drei in einem: Advanced Currency Strength28 Indicator (695 Bewertungen) + Advanced Currency IMPULSE mit ALERT (520 Bewertungen) + CS28 Combo Signals (Bonus) Details zum Indikator https://www.mql5.com/en/blogs/post/758844 Was bietet der Strength Indicator der nächsten Generation?
Scalper Inside PRO
Alexey Minkov
4.73 (56)
An exclusive indicator that utilizes an innovative algorithm to swiftly and accurately determine the market trend. The indicator automatically calculates opening, closing, and profit levels, providing detailed trading statistics. With these features, you can choose the most appropriate trading instrument for the current market conditions. Additionally, you can easily integrate your own arrow indicators into Scalper Inside Pro to quickly evaluate their statistics and profitability. Scalper Inside
TPSproTREND PrO
Roman Podpora
4.79 (19)
TPSpro TREND PRO   ist ein Trendindikator, der den Markt automatisch analysiert und Informationen über den Trend und jede seiner Änderungen liefert sowie Signale für den Einstieg in Geschäfte ohne Neuzeichnung gibt! Der Indikator verwendet jede Kerze und analysiert sie separat. bezieht sich auf verschiedene Impulse – Aufwärts- oder Abwärtsimpuls. Exakte Einstiegspunkte in Transaktionen für Währungen, Krypto, Metalle, Aktien, Indizes! Version MT5                   VOLLSTÄNDIGE BESCHREIBUNG DES
FX Levels ist ein außergewöhnlich präziser Unterstützungs- und Widerstandsindikator, der die traditionelle Lighthouse-Methode mit einem innovativen dynamischen Ansatz verbindet und für alle Handelssymbole einwandfrei funktioniert. Dazu gehören Währungspaare, Indizes, Aktien oder Rohstoffe. FX Levels identifiziert Umkehrpunkte und zeigt sie auf dem Chart an, die Sie ideal als Gewinnziele für Ihre Handelsaktivitäten nutzen können. Bei der Entwicklung von FX Levels haben wir unsere umfangreichen E
The Stochastic Basket Currency Strenght  brings the Stochastic indicator to a new level.  Expanding the boundaries of TimeFrames and mono-currency analysis, the SBCS take the movements of each currency that composes the cross and confront them in the whole basket of 7 crosses.  The indicator works with any combination of AUD, CAD, CHF, EUR, GBP, JPY, NZD, USD pairs and with full automation takes in account every stochastic value (main line) for the selected Time Frame.  After that, the indicator
FX Power MT4 NG
Daniel Stein
5 (13)
Erhalten Sie Ihr tägliches Marktupdate mit Details und Screenshots über unser Morning Briefing hier auf mql5 und auf Telegram ! FX Power MT4 NG ist die nächste Generation unseres langjährig sehr beliebten Währungsstärkemessers FX Power. Und was bietet dieser Stärkezähler der nächsten Generation? Alles, was Sie am ursprünglichen FX Power geliebt haben PLUS GOLD/XAU-Stärkeanalyse Noch präzisere Berechnungsergebnisse Individuell konfigurierbare Analysezeiträume Anpassbares Berechnungslimit für noc
Wir stellen Ihnen ON Trade Waves Patterns Harmonic Elliot Wolfe vor, einen fortschrittlichen Indikator, der entwickelt wurde, um verschiedene Markt-Muster mithilfe sowohl manueller als auch automatischer Methoden zu erkennen. Hier ist, wie er funktioniert: Harmonische Muster: Dieser Indikator kann harmonische Muster erkennen, die auf Ihrem Chart erscheinen. Diese Muster sind für Trader, die die Theorie des harmonischen Handels praktizieren, wie sie in Scott Carney's Buch "Harmonic Trading vol 1
ACB Breakout Arrows
KEENBASE SOFTWARE SOLUTIONS
4.15 (34)
The ACB Breakout Arrows indicator provides a crucial entry signal in the market by detecting a special breakout pattern. The indicator constantly scans the chart for a settling momentum in one direction and provide the accurate entry signal right before the major move.  Get multi-symbol and multi-timeframe scanner from here - Scanner for ACB Breakout Arrows MT4 Key features Stoploss and Take Profit levels are provided by the indicator. Comes with a MTF Scanner dashboard which tracks the brea
Gold Channel is a volatility-based indicator, developed with a specific timing algorithm for the XAUUSD pair, which consists of finding possible corrections in the market. This indicator shows two outer lines, an inner line (retracement line) and an arrow sign, where the theory of the channel is to help identify overbought and oversold conditions in the market. The market price will generally fall between the boundaries of the channel. If prices touch or move outside the channel it is a tra
Ultimate Gold Advisor für MetaTrader 4 Der Ultimate Gold Advisor ist ein fortschrittliches technologisches Werkzeug, das entwickelt wurde, um das Handelserlebnis auf MetaTrader 4 zu optimieren. Es wurde entwickelt, um den Bedürfnissen erfahrener Trader gerecht zu werden. Dieser Indikator kombiniert Präzision, anspruchsvolle Analysen und vielseitige Funktionalität, um informierte Handelsentscheidungen zu unterstützen. Ideal für den Goldhandel, aber auch auf eine Vielzahl von Vermögenswerten anwen
BITTE LESEN SIE DIE INFORMATIONEN UNTEN, BEVOR SIE DAS PRODUKT KAUFEN! Apollo Pips PLUS SP ist ein einzigartiges Produkt! ES IST FÜR ALLE, DIE MEINEN NEUEN „APOLLO PIPS“-INDIKATOR PLUS „SUPER PACK“-BONUS MIT ZUGRIFF AUF ALLE MEINE HANDELSINDIKATOREN ERHALTEN MÖCHTEN! Mit dem Kauf des Produkts Apollo Pips PLUS SP erwerben Sie tatsächlich eine völlig neue Version meines Apollo Pips-Indikators. Diese Version des Indikators verfügt über einen verbesserten Algorithmus und einen benutzerfreundlichen P
Derzeit 20% Rabatt! Die beste Lösung für jeden Neueinsteiger oder Expert Händler! Dieses Dashboard arbeitet mit 28 Währungspaaren. Es basiert auf 2 unserer Hauptindikatoren (Advanced Currency Strength 28 und Advanced Currency Impulse). Es bietet einen hervorragenden Überblick über den gesamten Forex-Markt. Es zeigt die Werte der Advanced Currency Strength, die Veränderungsrate der Währungen und die Signale für 28 Devisenpaare in allen (9) Zeitrahmen. Stellen Sie sich vor, wie sich Ihr Hande
Der Forex TPA Indikator deckt die wahren Aktionen der Marktmacher auf, immer dann wenn sie passieren. "Kämpfe nicht gegen die Marktmacher an, sondern folge ihnen", ist wohl der beste Rat, den ein Trader bekommen kann. Der TPA Indikator zeigt jedesmal seine Signale an wenn die Bullen definitiv stärker sind als die Bären und umgekehrt. Dieser Indikator wurde VON Tradern FÜR Trader gemacht und ist 100% NICHT NACHZEICHNEND! Signale werden STRENG am Schluss einer Kerze  generiert. Das sagen unsere Ku
Gann Swing Structure
Kirill Borovskii
5 (1)
This indicator is based on the mathematics of the great trader W.D. Ganna. With its help, you can easily find strong levels by analyzing swings to find the optimal entry point. The indicator works on all instruments and all timeframes. The indicator is fully manual and has control buttons. All you need to do is press the NEW button, a segment will appear, which you can place on any movement, swing or even 1 candle that you want to analyze. By placing the segment, press the OK button. A grid (th
Supply and Demand Dashboard PRO
Bernhard Schweigert
4.8 (20)
Derzeit 20% reduziert! Dieses Dashboard ist eine sehr leistungsfähige Software, die mit mehreren Symbolen und bis zu 9 Zeitrahmen arbeitet. Es basiert auf unserem Hauptindikator (Beste Bewertungen: Advanced Supply Demand ).   Das Dashboard gibt einen guten Überblick. Es zeigt: Gefilterte Angebots- und Nachfragewerte einschließlich der Zonenstärkebewertung, Pips-Abstände zu/und innerhalb von Zonen, Es hebt verschachtelte Zonen hervor, Es gibt 4 Arten von Alarmen für die gewählten Symbole in
Enigmera
Ivan Stefanov
5 (3)
ENIGMERA: Der Kern des Marktes https://www.enigmera.com Einführung Dieser Indikator und dieses Handelssystem sind ein bemerkenswerter Ansatz für die Finanzmärkte. ENIGMERA nutzt die fraktalen Zyklen zur genauen Berechnung von Unterstützungs- und Widerstandsniveaus. Er zeigt die echte Akkumulationsphase an und gibt Richtung und Ziele vor.  Ein System, das funktioniert, egal ob wir uns in einem Trend oder in einer Korrektur befinden.  Wie funktioniert es? ENIGMERA besteht aus drei Linien: der
Currency Strength Exotics
Bernhard Schweigert
4.87 (31)
Stärke von 8 Währungen plus EIN EXOTISCHES Paar oder Rohstoffe oder Indexe! Jedes Produkt kann als 9. Linie hinzugefügt werden. Fügen Sie Rohstoffe, Indexes oder exotische Währungen hinzu (Gold, Silber, Öl, DAX, US30, MXN, TRY, CNH ...). Eine neue noch nie dagewesene TRADING STRATEGIE  !!! Dieser Indikator ist einzigartig, weil wir eine Reihe von proprietäre Funktionen und neue Formeln eingebaut haben. Es funktioniert für alle Zeitrahmen. Basierend auf neuen zugrunde liegenden Algorithmen ist
REMINDER: Early buyers hot price discount: Price subject to rise after first 20 copies. Starting price $65 and final price will be $1275. Secure your discounted copy Now! Smart Money Analyser Indicator User Manual 1. Introduction Welcome to the   Smart Money Analyser Indicator This powerful tool provides traders with comprehensive market analysis by combining various technical indicators to generate actionable trading signals. Designed to be user-friendly, this indicator helps traders of a
Shepherd Harmonic Pattern
Abdullah Alrai
4.65 (49)
Dieser Indikator erkennt harmonische Muster, die manuell oder automatisch auf dem Chart gezeichnet wurden. Sie können das Benutzerhandbuch unter diesem Link einsehen: Fügen Sie Ihre Bewertung hinzu und kontaktieren Sie uns, um es zu erhalten. Es gibt eine kostenlose Version, um dieses Produkt auf MT4 auszuprobieren. Sie können es verwenden, um Gartley- und Nenstar-Muster zu erkennen: https://www.mql5.com/en/market/product/30181 Sie können die vollständige MT4-Version von kaufen: https://www.mql5
Sneaky Busters 4
Mushfiq Faysal
5 (2)
Previous Price : $323.00 Current Price: $359.00 Future Price: Will increase soon NOTICE Please DO NOT buy this indicator if you are just learning about smart money movement . You need to have some experience with accumulation and distribution to fully grasp the gravity of this indicator. Since smart money does not play by the book , so this indicator was only developed to find their trail that they did not bother to hide . If the signals do not correspond to your trading style, this is not the
Cycle Sniper
Elmira Memish
4.39 (36)
NEW YEAR SALE PRICE FOR LIMITED TIME!!! Please contact us after your purchase and we will send you the complimentary indicators to complete the system Cycle Sniper is not a holy grail but when you use it in a system which is explained in the videos, you will feel the difference. If you are not willing to focus on the charts designed with Cycle Sniper and other free tools we provide, we recommend not buying this indicator. We recommend watching the videos about the indiactor and system before pu
Bomb Bank Signal
Igor Pereira Calil
5 (1)
Bombenbanksignal: Ihr Vertrauensindikator in MetaTrader 4 Bomb Bank Signal ist ein leistungsstarker Indikator für MetaTrader 4, der entwickelt wurde, um die relevantesten Trends auf dem Finanzmarkt zu identifizieren. Wenn Sie nach einem Tool suchen, das Bewegungen genau vorhersieht, ist die Bomb Bank der Verbündete, den Sie brauchen. So funktioniert es: Dieser Indikator kombiniert drei unterschiedliche Methoden – Volumenanalyse, Kerzenschließungen und symmetrischer Trend –, um Kauf- und V
Master Pullback
TDINVEST LLP
5 (3)
- 50% OFF - Telegram group : https://t.me/+5RIceImV_OJmNDA0 MT5 version : https://www.mql5.com/en/market/product/85917?source=Site+Market+Product+Page Master Pullback is a complete system that gives unique trading opportunities and a clear indication of the market: trend, signals as well as stop loss and take profit levels. This system has been designed to be as simple as possible and detects extreme overbought and oversold zones, support and resistance levels, as well as the major trend. You
NNFX Strength System
Benjamin Joshua Nash
3 (1)
A complete NNFX algorithm in one indicator. NEW: Inbuilt backtester shows historical trade stats on the chart to show which pairs are most profitable. Don't be fooled. It's not enough to simply match a strong and weak currency to trade successfully with a strength meter, you need to know the intimate details of the relationship between two currencies. This is exactly what we've done with NNFX Strength, giving you all the information you need to make solid trading decisions. Years in the makin
CONGESTION BREAKOUT PRO This indicator scans the breakout of congestion zones . This indicator unlike any other congestion indicator you will find in the market right now,  it uses an advanced algorithm not peculiar to most traditional congestion indicators available today . The advanced algorithm used to define the congestions  is greatly responsible for the high rate real congestion zones and low rate fake congestion zones spotted by this product. UNDERSTANDING CONGESTION Congestion are
Flip Flops
Tatiana Savkevych
The Flip Flop indicator tracks market trends, ignoring sharp fluctuations and market noise. The indicator can work both for entry points and as a filter. The Flip Flop indicator displays information in a visual way. Helps in finding entry points during analysis. Suitable for trading on small time frames because it ignores sudden price spikes or corrections in price movements by reducing market noise around the average price.
Trend Channel is a Forex trend arrow indicator for identifying potential entry points. I like it, first of all, because it has a simple operating mechanism, adaptation to all time periods and trading tactics. Created based on a regression channel with filters. We display the signals of the Trend Channel indicator on the price function chart using a mathematical approach. How it works: when the price breaks through the overbought/oversold zone (channel levels), a buy or sell signal is generate
Weitere Produkte dieses Autors
How to use Pair Trading Station Pair Trading Station is recommended for H1 time frame and you can use it for any currency pairs. To generate buy and sell signal, follow few steps below to apply Pair Trading Station to your MetaTrader terminal. When you load Pair Trading Station on your chart, Pair Trading station will assess available historical data in your MetaTrader platforms for each currency pair. On your chart, the amount of historical data available will be displayed for each currency pai
Introduction to Support Resistance Indicator Support and Resistance are the important price levels to watch out during intraday market. These price levels are often tested before development of new trend or often stop the existing trend causing trend reversal at this point. Highly precise support and resistance are indispensable for experienced traders. Many typical trading strategies like breakout or trend reversal can be played well around these support and resistance levels. The Precision Sup
Introduction to Harmonic Pattern Scenario Planner The present state of Forex market can go through many different possible price paths to reach its future destination. Future is dynamic. Therefore, planning your trade with possible future scenario is an important step for your success. To meet such a powerful concept, we introduce the Harmonic Pattern Scenario Planner, the first predictive Harmonic Pattern Tool in the world among its kind. Main Features Predicting future patterns for scenari
Introduction to X3 Chart Pattern Scanner X3 Cherart Pattern Scanner is the non-repainting and non-lagging indicator detecting X3 chart patterns including Harmonic pattern, Elliott Wave pattern, X3 patterns, and Japanese Candlestick patterns. Historical patterns match with signal patterns. Hence, you can readily develop the solid trading strategy in your chart. More importantly, this superb pattern scanner can detect the optimal pattern of its kind. In addition, you can switch on and off individu
Peak Trough Analysis is the great tool to detect peaks and troughs in your chart. Peak Trough Analysis tool can use three different peaks and troughs detection algorithm. The three algorithm include the orignal Fractals Indicator by Bill Williams, the Modified Fractals indicator and ZigZag indicator. You can use this peak and trough analysis tool to detect the price pattern made up from Equilibrium Fractal-Wave process. For further usage, there are good guide line on how to use this peak trough
FREE
Introduction to Fractal Pattern Scanner Fractal Indicator refers to the technical indicator that makes use of the fractal geometry found in the financial market. Fractal Pattern Scanner is the advanced Fractal Indicator that brings the latest trading technology after the extensive research and development work in the fractal geometry in the financial market. The most important feature in Fractal Pattern Scanner is the ability to measure the turning point probability as well as the trend probabil
Introduction to Sideways Market Analyzer Notable period of Low volatility and non-trending movements in the financial market is considered as Sideways Market. Sooner or later, the low volatility will increase and the price will pick up a trend after Sideways Market. In terms of trading point of view, Sideways Market can serve as the very good entry timing for traders. Sideways Market is also quite often the representation of accumulation of large orders from big investors. Therefore, knowing the
Introduction This indicator detects volume spread patterns for buy and sell opportunity. The patterns include demand and supply patterns. You might use each pattern for trading. However, these patterns are best used to detect the demand zone (=accumulation area) and supply zone (=distribution area). Demand pattern indicates generally potential buying opportunity. Supply pattern indicates generally potential selling opportunity. These are the underlying patterns rather than direct price action. T
FREE
How to use Pair Trading Station Pair Trading Station is recommended for H1 time frame and you can use it for any currency pairs. To generate buy and sell signal, follow few steps below to apply Pair Trading Station to your MetaTrader terminal. When you load Pair Trading Station on your chart, Pair Trading station will assess available historical data in your MetaTrader platforms for each currency pair. On your chart, the amount of historical data available will be displayed for each currency pai
Introduction to X3 Chart Pattern Scanner X3 Cherart Pattern Scanner is the non-repainting and non-lagging indicator detecting X3 chart patterns including Harmonic pattern, Elliott Wave pattern, X3 patterns, and Japanese Candlestick patterns. Historical patterns match with signal patterns. Hence, you can readily develop the solid trading strategy in your chart. More importantly, this superb pattern scanner can detect the optimal pattern of its kind. In addition, you can switch on and off individu
Introduction Excessive Momentum Indicator is the momentum indicator to measure the excessive momentum directly from raw price series. Hence, this is an extended price action and pattern trading. Excessive Momentum Indicator was originally developed by Young Ho Seo. This indicator demonstrates the concept of Equilibrium Fractal Wave and Practical Application at the same time. Excessive Momentum detects the market anomaly. Excessive momentum will give us a lot of clue about potential reversal and
Elliott Wave Trend was designed for the scientific wave counting. This tool focuses to get rid of the vagueness of the classic Elliott Wave Counting using the guideline from the template and pattern approach. In doing so, firstly Elliott Wave Trend offers the template for your wave counting. Secondly, it offers Wave Structural Score to assist to identify accurate wave formation. It offers both impulse wave Structural Score and corrective wave Structure Score. Structural Score is the rating to sh
Price Breakout pattern Scanner is the automatic scanner for traders and investors. It can detect following patterns automatically from your chart. Head and Shoulder - Common tradable pattern. Reverse Head and Shoulder - This pattern is the reverse formation of the Head and Shoulder. Double Top - When the price hits resistance level twice and decline toward the support level, the trader can anticipate sudden bearish breakout through the support level. Double Bottom - The double bottom pattern is
Introduction Harmonic Patterns are best used to predict potential turning point. Traditionally, Harmonic Pattern was identified manually connecting peaks and troughs points in the chart. Manual harmonic pattern detection is painfully tedious and not suitable for everyone. You are often exposed under subjective pattern identification with manual pattern detection. To avoid these limitations, Harmonic Pattern Plus was designed to automate your harmonic pattern detection process. The functionality
Introduction to Chart Pattern MT Chart Pattern MT is a chart pattern scanner to detect the triangle pattern, falling wedge pattern, rising wedge pattern, channel pattern and so on. Chart Pattern MT uses highly sophisticated chart pattern detection algorithm. However, we have designed it in the easy to use with intuitive user interface. Chart Pattern MT will show all the patterns in your chart in the most efficient format for your trading. You do not have to do tedious manual pattern detection an
Introduction to Fractal Moving Average Fractal Moving Average indicator was designed as part of Fractal Pattern Scanner. Inside Fractal Pattern Scanner, Fractal Moving Average Indicator was implemented as multiple of chart objects. With over thousands of chart object, we find that it was not the best and efficient ways to operate the indicator. It was computationally too heavy for the indicator. Hence, we decide to implement the indicator version of Fractal Moving Average indicator to benefit ou
FREE
Mean Reversion Supply Demand Indicator Mean Reversion Supply Demand is the indicator to detect the important supply demand zone in your chart. The concept of supply demand trading relies on the quantity mismatching between buying and selling volumes in the financial market. Typically, supply demand zone serves to predict the turning point. The wave pattern, for any supply demand zone to work as an successful trade, looks like the price must touch the base zone, move away and then return to zone
Introduction This indicator detects volume spread patterns for buy and sell opportunity. The patterns include demand and supply patterns. You might use each pattern for trading. However, these patterns are best used to detect the demand zone (=accumulation area) and supply zone (=distribution area). Demand pattern indicates generally potential buying opportunity. Supply pattern indicates generally potential selling opportunity. These are the underlying patterns rather than direct price action. T
FREE
Introduction To Time Box Indicator Time Box Indicator is a must have indicator for any trader. It will display daily, weekly and Monthly box according to your preferences. Yet, you can extend any important price levels in your chart automatically. You can use them as the significant support and resistance levels. It is very simple but effective tool for your trading. Graphic Setting Use White Chart Line Style for Current Open price Daily Setting Update Timeframe for daily box Number of days
FREE
Introduction to Fractal Pattern Scanner Fractal Indicator refers to the technical indicator that makes use of the fractal geometry found in the financial market. Fractal Pattern Scanner is the advanced Fractal Indicator that brings the latest trading technology after the extensive research and development work in the fractal geometry in the financial market. The most important feature in Fractal Pattern Scanner is the ability to measure the turning point probability as well as the trend probabi
Ace Supply Demand Zone Indicator The concept of supply demand relies on the quantity mismatching between buying and selling volumes in the financial market. Supply and demand zone can provide the good entry and exit. A zone is easier to trade than a line. The supply demand zone can provide the detailed trading plan and the risk management. Its ability to predict market direction is high. There are two distinctive points about Ace Supply Demand Zone Indicator. Ace Supply Demand Zone indicator was
EFW Pattern Trader is a powerful pattern scanner for Forex and Stock trading. The pattern detection in EFW Pattern Trader uses the Fractal Wave Theory, which captures the endless up and down movement of the market. Therefore, EFW Pattern Trader can be considered as the robust price action indicator. Any patterns in EFW Pattern Trader can be backtested visually in your strategy tester. Visual backtesting with pattern will show you how pattern will likely behave in the live trading. Therefore, you
Peak Trough Analysis is the great tool to detect peaks and troughs in your chart. Peak Trough Analysis tool can use three different peaks and troughs detection algorithm. The three algorithm include the orignal Fractals Indicator by Bill Williams, the Modified Fractals indicator and ZigZag indicator. You can use this peak and trough analysis tool to detect the price pattern made up from Equilibrium Fractal-Wave process. For further usage, there are good guide line on how to use this peak trough
FREE
Introduction To Turning Point Indicator The trajectories of Financial Market movement are very much like the polynomial curvatures with the presence of random fluctuations. It is quite common to read that scientist can decompose the financial data into many different cyclic components. If or any if the financial market possess at least one cycle, then the turning point must be present for that financial market data. With this assumption, most of financial market data should possesses the multipl
Auto Chart Alert MT5
Young Ho Seo
3.6 (5)
Introduction Auto Chart Alert is a convenient tool to set alert for your trading in your chart. With Auto Chart Alert, you can set the alert line in one click in your desired location in your chart. You can even set alert over the sloped lines in your chart. Auto Chart Alert is a great tool when you have to watch out importnat support and resistance levels for your trading. You can receive the sound alert, email and push notification when the price hit the alert line at you desired location. A
FREE
Introduction to Fractal Moving Average Fractal Moving Average indicator was designed as part of Fractal Pattern Scanner. Inside Fractal Pattern Scanner, Fractal Moving Average Indicator was implemented as multiple of chart objects. With over thousands of chart object, we find that it was not the best and efficient ways to operate the indicator. It was computationally too heavy for the indicator. Hence, we decide to implement the indicator version of Fractal Moving Average indicator to benefit
FREE
Introduction to Order Risk Management EA ORM EA is specially designed for fast and accurate market order execution to be used with our Price Action and Econometric Trading strategies listed below. ORM EA is fully automatic and ORM EA is also very easy to use. ORM EA is totally free of charge. You can also use this robust order execution feature of this ORM EA for any other your own trading strategy. Trading Strategy Guide Order Risk Management EA provides the guide for the risk management for
FREE
Introduction To Time Box Indicator Time Box Indicator is a must have indicator for any trader. It will display daily, weekly and Monthly box according to your preferences. Yet, you can extend any important price levels in your chart automatically. You can use them as the significant support and resistance levels. It is very simple but effective tool for your trading. Graphic Setting Use White Chart Line Style for Current Open price Daily Setting Update Timeframe for daily box Number of days
FREE
Introduction to Double Harmonic Volatility Indicator Use of the Fibonacci analysis for financial trading can nearly go back to 85 years from today since the birth of Elliott Wave Theory by R. N. Elliott. Until now, traders use the Fibonacci analysis to identify the patterns in the price series. Yet, we could not find any one attempted to use Fibonacci analysis for the Volatility. Harmonic Volatility Indicator was the first technical analysis applying the Fibonacci analysis to the financial Volat
Introduction to Order Risk Management EA ORM EA is specially designed for fast and accurate market order execution to be used with our Price Action and Econometric Trading strategies listed below. ORM EA is fully automatic and ORM EA is also very easy to use. ORM EA is totally free of charge. You can also use this robust order execution feature of this ORM EA for any other your own trading strategy. Trading Strategy Guide Order Risk Management EA provides the guide for the risk management for
FREE
Auswahl:
gevans49
263
gevans49 2021.06.21 17:24 
 

I like everything about this indicator and all of its components.

MILAD ORANGI
117
MILAD ORANGI 2021.02.01 15:13 
 

Unfortunately there are bugs and bugs and support are not active for more than a year.(update)

teddyawa
45
teddyawa 2020.12.03 12:39 
 

this is a great tool. highly recommended

Roger
526
Roger 2019.10.10 15:44 
 

There is a learning curve but I would not be without this in my trading toolbox. NOTE: Try swing trading with it on the H1 timeframe.

Nicola Furini
945
Nicola Furini 2019.05.12 18:23 
 

Der Benutzer hat keinen Kommentar hinterlassen

evalovesam
109
evalovesam 2019.05.05 19:49 
 

在MT4买了很多EA指标等等,这个个指标算有良心的了,通道有,蜡烛形态有,走势有,阻力位支持位也有,这价钱这性价比之高,这作者是有爱心的人!

chinajohn
762
chinajohn 2019.04.07 10:59 
 

GOOD!

daixingsheng0871
23
daixingsheng0871 2019.04.07 08:33 
 

Der Benutzer hat keinen Kommentar hinterlassen

2840023
92
2840023 2018.02.04 13:36 
 

it's a good Indicator, Helps you to recognize better harmonic pattern...

zuowalter
21
zuowalter 2017.11.06 13:37 
 

在MT4中如何设置邮件提醒

Andres Meza
573
Andres Meza 2017.07.29 00:34 
 

Der Benutzer hat keinen Kommentar hinterlassen

hezap
174
hezap 2017.06.19 17:37 
 

Very good stuff!

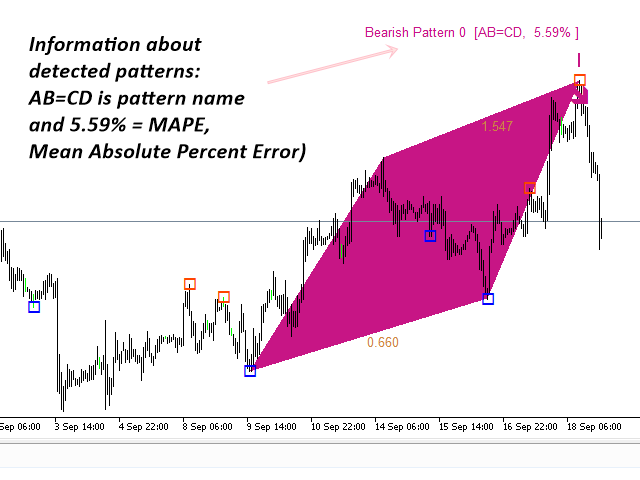
Dont go for every pattern! Check the trend, SR and 5% max MAPE!!!!

Alfredo Sabatini
387
Alfredo Sabatini 2017.01.07 20:21 
 

Der Benutzer hat keinen Kommentar hinterlassen

nguyenphanduc
198
nguyenphanduc 2016.12.01 10:14 
 

I bought tools from Young Ho Seo and use the strategy to be Young Ho Seo instructions. The results were amazing. A toolkit to help me see clearly the market for extremely accurate decisions.

Highly recommended for all traders

EddyAccountant
30
EddyAccountant 2016.06.17 05:58 
 

Der Benutzer hat keinen Kommentar hinterlassen

braveamit
43
braveamit 2016.06.16 08:53 
 

Der Benutzer hat keinen Kommentar hinterlassen

Xamanus
140
Xamanus 2016.06.07 13:27 
 

Der Benutzer hat keinen Kommentar hinterlassen

Mytime
19
Mytime 2016.01.18 17:00 
 

Excellent. :)

ladyjenny
43
ladyjenny 2015.12.18 07:35 
 

Der Benutzer hat keinen Kommentar hinterlassen

Phitsanukhom Chaiyavet
166
Phitsanukhom Chaiyavet 2015.10.13 12:16 
 

4.9 Star for This tool If you want to know about Reversal zone or where of trend is the end you must have this indicator because this tool will help predict quality reversal zone

You don't have any knowledge about Harmonic pattern but you can understand where is a strong reversal point.

You don't waste time about learning Harmonic but you must practice Demo trading before using this tool for real world trading.

Support is good if you have any problem about indicator.

But I Have a little reproach of this tool it cannot switch to disappear/appear Fibonacci level because some time I must to see clearly chart.

12
Antwort auf eine Rezension
Version 11.3 2021.02.01
In version 11.3, Harmonic Pattern Plus will show you which pattern is formed completely and which pattern is not formed completely. This information is available from both single indicator mode and multiple timeframe pattern detection mode.
Version 11.1 2019.10.10
In version 11.1, we have polished up Regression Channel functions. Now you can set the style, color and width of Regression Channel. To use Regression Channel as part of your trading strategy, just set Use Channel = true.
Version 11.0 2019.01.30
In Version 11.0, we have made some improvement over Potential Continuation Zone.
Version 10.9 2018.12.22
Version 10.8, minor work on indicator. All functionality are kept the same.
Version 10.7 2018.11.30
In version 10.7, we have changed line width and lenth for better visibility.
Version 10.6 2018.10.10
In version 10.6, we have added sound alert, email and push notification for 52 Japanese candlestick patterns.
Version 10.5 2018.07.27
In version 10.5, user can control the width of trianlge when the triangle is not filled.
Version 10.3 2018.05.17
In this version, Harmonic Pattern will be shown at ideal point D.
Version 9.9 2017.07.27
In Version 9.9, User can set the pattern matching accuracy for individual point as well as over the averaged MAPE.
Version 9.8 2017.06.22
In Version 9.8, Now multiple pattern locking is allowed. This means that trader can lock as many pattern as he want in the chart. This feature not only protects traders from the repainting and redrawing issues of the classic Pattern trading but also trader can enhance his trading performance by incorporating multiple timeframe patterns analysis at ease.
Version 9.5 2017.04.28
In Version 9.5, Trader have access to Potential Reversal Zone Type A and Potential Reversal Zone Type B.

Potential Reversal Zone Type A: use to predict the reversal point at Point D.
Potential Reversal Zone Type B: use to preduct the future price movement after the pattern is formed.
Version 9.3 2017.03.09
In version 9.3, you can automatically set up your stop loss and take profit by just moving stop loss or take profit level in your chart. This new feature will allow you to have intuitive and more efficient approach of setting your stop loss and profit target from geometric analysis.
Version 9.2 2016.11.14
Updated Feature for Harmonic Pattern Plus and Harmonic Pattern Scenario Planner for version 9.2

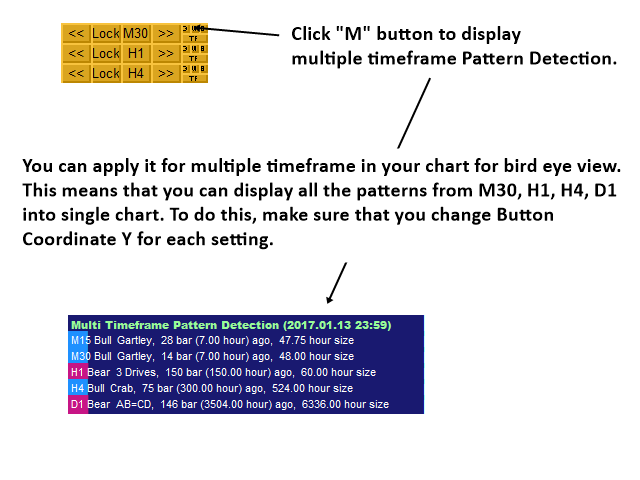
Multiple Timeframe Control Feature in Single Chart

This description applies to both Harmonic Pattern Plus and Harmonic Pattern Scenario Planner since both of them are identical 95% of their functionality. Most important feature in this new version is that you can add multiple of Harmonic Pattern Plus controlling different timeframes in one chart. If you wish, you can add 4 Harmonic Pattern Plus in one chart controlling M15, H1, H4, D1 timeframe or even more. One limitation when you add multiple Harmonic Pattern Plus is that you can only use the Calculation Timeframe (timeframe to detect patterns) greater than current chart timeframe. For example, if your chart timeframe is H1, then you can only use Calculation timeframe H1, H4, D1, etc. You can not use M15 calculation timeframe for H1 chart timeframe since you can not draw the M15 pattern to H1 timeframe chart.


Custom Take Profit and Stop Loss

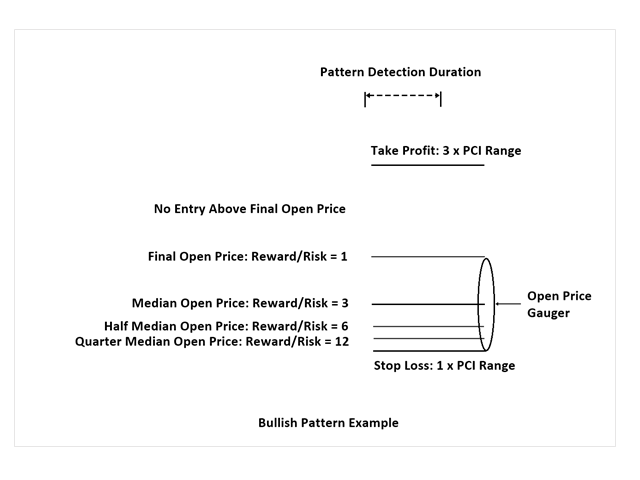
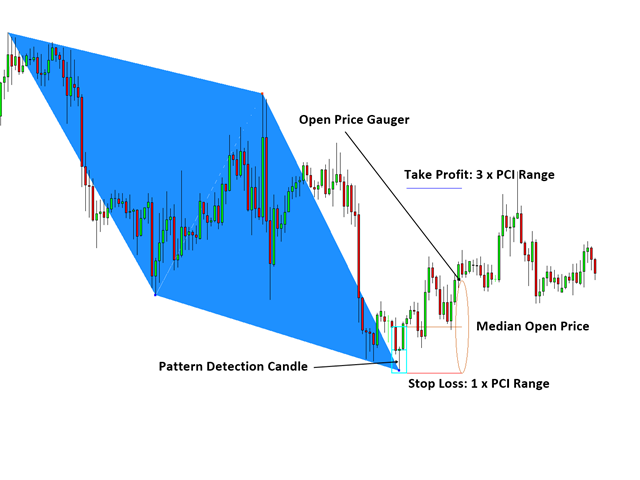
In version 9.2, Custom Take Profit and Stop Loss are defined using Pattern Completion Interval (PCI) for more clever setup. 3 Take Profit is equivalent to the 3 x the PCI box range. 1 Stop Loss is equivalent to the 1 x the PCI box range. The ellipses (stretched circle) shows you the potential entry. When your order is placed inside this circle, your Reward/Risk can range from 1 to 10 or even more in strictly mechanical trading. Why this happen? Do some basic math maybe looking at your chart. Note that this is the potential entry level shown only for your convenience but not limited to creating your own clever trading setup. The ellipses is like the ruler to gauge your potential entry in your preferred Rewards/Risk ratio and it is not an indicator showing direction or etc.


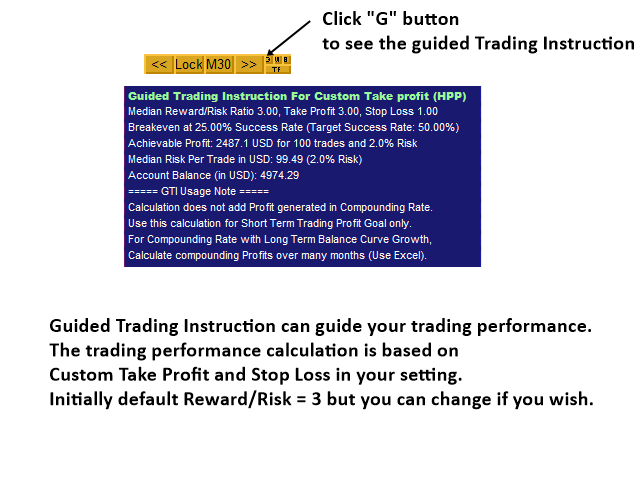
In addition, this PCI based Custom Take Profit and Stop Loss will influence your Guided Trading Instruction. Guided Trading Instruction will only calculate your profit assuming you are using median open price, which is the top of the PCI box (for bullish pattern, the other way around for bearish pattern). So this new feature on our Custom Take Profit and Stop Loss are rather optional for your trading.

For more details about version 9.2, you can check this link below.

Harmonic Pattern Plus MT4: https://www.mql5.com/en/market/product/4488#!tab=comments&page=12
Version 8.8 2016.10.31
In version 8.8, Harmonic Pattern Plus can detect Harmonic Pattern at every tick level as an option. This is only small minor change from previous 8.6. There is no version 8.7 since we decided to name the latest version to 8.8 from 8.6. When you are detecting patterns at tick level, make sure that you understand it uses a lot more computation which can make your MetaTrader slow. However, this might be useful for traders using Pattern Completion Interval as entry. To detect pattern at every tick level, just set Detect Pattern at Every Tick to True.
Version 8.6 2016.07.26
We have implemted 2 new features succesffully for our tools.

Feature 1: Options to switch on and off each pattern type. With this option, you can switch off or switch on any pattern type as you wish. For example, if you want to turn off Bat pattern from Harmonic Pattern Plus. Yes. You can. You can do the same for the price Breakout Pattern Scanner. For example, if you don’t want to see head and shoulder pattern, then you can just switch off them. How to use this feature is very intuitive. You just need to set the swton on and off in your Indicator Input settings.

Feature 2: Options to filter out small patterns. We will add “Pattern Size Filter” input. With this input, you can filter out small patterns and you can only trade with big patterns. You can use this feature in our Price Breakout Pattern Scanner too as well as with Harmonic Pattern Scenario Planner. Pattern Size Filter is simply done by counting number of candles inside patterns. So Make Pattern Size Filter large, then you will only see large patterns. If you want to see any patterns, then just set Pattern Size Filter = 0.
Version 8.0 2016.06.09
Smart Renko version 6.0, Smart Renko can draw the brick the same level on your chart regardless of amount of historical bars and Meta Trader platforms. To do this, you need to choose the brick height which is the factor of 100 pip or factor of 1000 pips with Brick Height Mode = 0.

For example, you can use Brick Height (in pips) = 10, 20, 25, 50, 100, 200, 500, etc, as they are the fact of 100 or 1000 pips. As long as you are using these brick height, the brick will be drawn in the same level regardless of the amount of historical bars and your brokers. This is really good property as traders can develop strategy universally working across different platform.

This improved version of Smart Renko 6.0 is included in the new update for Harmonic Pattern Plus.
Number of detected patterns can be different according to your brick height and now you can even find that pattern specially formed around psychological number (round number) if this is one of your preferred strategy.
Version 7.8 2016.05.27
In version 7.8, we have fixed the small bug related to Multiple Timeframe Pattern Detection. The bug was found after our update on Renko Filter Implementation in version 7.7.
Version 7.7 2016.05.23
In version 7.7, Harmonic Pattern Plus can detect pattern using Renko Brick calulation. This is equivalent to detect pattern over the dedicated Renko Chart (Imagine that you have opened Renko Chart and then put this indicator over the Renko Chart). So it is very powerful due to less noise in the Renko Chart. The good news is that you don't need a dedicated Renko Chart as this indicators does renko brick calculation at the background using Smart Renko Indicator. So you are hassle free but this indicators will does a lot of work for you.

At the same time, user can choose to detect pattern over normal candle stick too as before. To choose the detection mode, user can use the following variable.

Use Renko Filter for Pattern detection : true or false only

We have currently set the default as Renko Filter Mode.

(Important note, Renko can be calculated using sub time frame. For example, Renko brick can be calculated using M5 or M15 time frame when you actually use this indicator for H1 chart. If the data is loaded, then there is not a problem. But sometime, data loading may be issue. But this is the issue present inside Meta Trader terminal. It might be fixed in the future when new Meta Trader version is released or maybe not. To avoid this issue, your default calculation time for Renko brick calculation is set to current time frame. But you can always change it with your own experiment. In our experience, there can be small difference when you change the calculation time frame. Smaller time frame is generally more accurate. But still higher time frame will do the job too.)
Version 7.3 2016.04.14
In version 7.3, users have a choice over update frequency on pattern detection.

This means that you can choose pattern update frequency at different timeframe from a default one.

For example, if you are using Harmonic Pattern Plus on H1, normally pattern detection will be updated at every 1 hour but now you can even detect pattern at every 1 or 5 minutes instead of every 1 hour.

To do so, simply set Pattern Update Frequency = Period you want (PERIODM1 or PERIODM5, etc.).

This helps you to enter with much better risk/reward ratio.
Version 7.1 2016.04.08
In the version 7.1, If you set the ButtonTextSize = 0, then you can hide buttons from your chart. Really minor update.
Version 7.0 2016.03.23
In version 7.0, user can show clustered PRZ lines nicely. But it is possible not to filter PRZ lines and showing raw PRZ lines.
Version 6.6 2016.02.22
In version 6.6, you can switch on or off MTD( multiple time frame detection feature) for each time frame. For example, if you don't use M1 or M5 time frame for your MTD, then just set Use M1 timeframe = false and use M5 timeframe = false in your MTD setting.
Version 6.5 2016.01.22
In version 6.5, Multi Time Frame Pattern Detection (MDT) feature is added. If user want to check what pattern is formed in other time frame. It is now possible to check pattern formed across all time frame without changing your chart or time frame.

Button "MTD" is used to perform multi Time Frame Pattern Detection. So press this button to see or hide the multi time frame pattern panels.

We have also added five input setting in regards to this MTD feature.
If you want to permanently run this MTD feature at every candle,
then just set Use Multi Timeframe Pattern Detection = true.

However, this MTD feature require much heavier computation. Therefore, to run this at every candle, we will leave this to your own choice.

//Use Multi Timeframe Pattern Detection
//Use Sound Alert from MTD
//MTD Panel X coordinate
//MTD Panel Y coordinate
//MTD Panel Update Frequency

Overall this MTD feature will help traders to make a lot better and more accurate trading decision.
Version 6.2 2015.11.18
In version 6.2, minor update only. Graphical objects were drawn in background rather than foreground.
Version 6.0 2015.10.26
In version 6.0, Pattern Completion Interval was added. Added the new input variables.

//Show Pattern Completion Interval ('true' or 'false' only)
//Pattern Completion Interval Box Size (default = 4)
//Pattern Completion Interval Box Width (default = 2)
//Pattern Completion Interval Bullish Color
//Pattern Completion Interval Bearish Color
//Pattern Completion Interval Text Color
//Pattern Completion Interval Text Size
Version 5.6 2015.10.15
In version 5.6, Now user can hide buttons on their charts by clicking "BT" button on chart. Minor update only.
Version 5.5 2015.09.23
Linear regression channel alert bug was fixed.
Version 5.3 2015.09.22
In this version 5.3, Custom Risk Control module was added. And the following variables were added.

//Use Custom Stop Loss and Take Profit
//Custom Take Profit: Enter fibo number 0.386, 0.5, 0.618, 0.786, 1.0
//Risk Reward Ratio (Reward/Risk): user more than 1.0
//Custom Take Profit and Stop Loss Line Length
//Custom Take Profit and Stop Loss Line Width
//Custom Take Profit and Stop Loss Text Size
//Custom Take Profit Color
//Custom Stop Loss Color
//Custom Open Price Color
//Show Guided Trading Instruction
//Guided Trading Instruciton X Coordination
//Guided Trading Instruction Y Coordination
//Your Target Success Rate: 55%(0.55) = default
//Your Risk per Trade: 2% (0.02) = default
//Your Target Trade Number: 100 = default


Version 5.1 2015.08.20
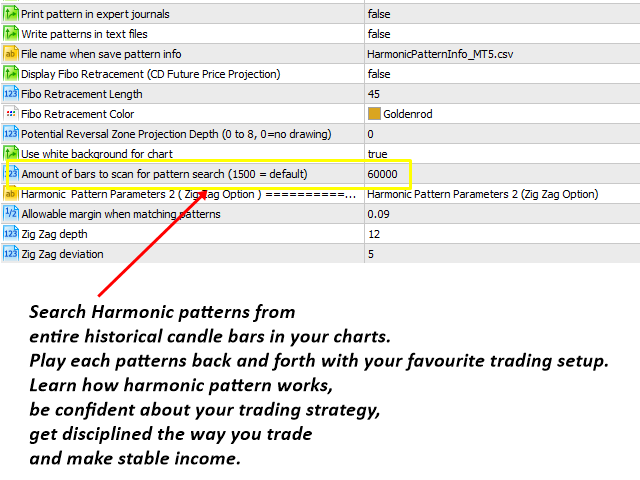
In version 5.1, now user can select how many historical bars to scan.

Note that this feature is great so you can study How harmonic pattern evolved through historcal data. This is very powerful feature. For example, you can learn how harmonic pattern worked in 2005 and compare its appearance on 2015. You can apply this knowledge for your trading. Something like this can't be achieved by manual traders.


However, scanning more bars requires a lot more computation time. So please be careful in using this feature. Also maxium number of patterns indicators can search is 1000. So Know this limitation too.


For average traders, 1500 bars (default setting) is more than fine.


Kind regards.
Version 5.0 2015.05.26
In version 5.0, trader can disable direction arrow. Just set Direction Arrow Width =0 to disable the arrow from your chart.
Version 3.9 2015.05.13
In this version, small bug of getting array out of range when you set PRZ depth = 0 is fixed.
Version 3.8 2015.05.05
In version 3.8 New feature 1:


We added Fibonacci projection of followings:

1. Internal Price Retracement (XA)
2. External Price Retracement (BC)
3. Correction of Price Projection (ABCD)
4. Future Price projection (CD, this is existing Fibo retracement from earlier version)


Trader can control depth of these Fibonacci Projection using following variable:

Potential Reversal Zone Projection Depth (0 to 8, 0=no drawing)

value 1: fewer Fibonacci lines (for less sophisticated trading setup)
value 8: more Fibonacci lines (for more sophisticated trading setup)


Also individual Fibonacci projection can be switch on/off by setting these values to zero or other values:

Potential Reversal Zone Line Length for XA (0=no projection)
Potential Reversal Zone Line Length for BC (0=no projection)
Potential Reversal Zone Line Length for ABCD (0=no projection)


Future Price projection (CD, this is existing Fibonacci retracement from earlier version) is identical to and this can be controlled by previous Fibo Display option.


In version 3.8 New feature 2:

Now by just simply clicking over "Symbol" button on your chart, trader can detect new patterns at any tick arrival without waiting for new bar arrival. This is useful if you want to detect patterns before new bar arrivals. (Fast discovery of the patterns)
Version 3.5 2015.04.28
In version 3.5, user can select any pattern to lock on his chart. Of course, user can unlock and delete the locked pattern. This locking and unlocking pattern is done by pressing "Pattern" button on the chart.
Version 3.3 2015.04.13
Version 3.3

1. Added ability to change button text size (Text Size button).

2. Added push notifications for sending messages to mobile terminals.
Version 3.2 2015.03.31
In version 3.2, just changed description of this indicator. (Very minor)
Version 3.1 2015.03.19
In this version, Button has been redesigned for simpler looking.
Version 3.0 2015.02.11
In version 3.0, Candlestick Pattern Detection algorithm was hugely improved by adding intensive statistical pattern matching process.
Version 2.9 2015.01.21
Fixed small issue with Sound Alert.
Version 2.8 2015.01.19
In version 2.8, pattern matching error (%) is added to account for how close the detected patterns are to reference patterns in text book.
Version 2.7 2015.01.05
In version 2.7, now you can select different symbols using buttons on charts. Users now need to open fewer charts and their trading operation become quicker.
Version 2.5 2014.09.24
In version 2.5, Harmonic Pattern Plus can detect 3 drives pattern and deep crab pattern. In addition, with version 2.5, user can build Expert Advisor using iCustom function.
Version 2.3 2014.08.04
In Version 2.2, there was small bug printing Button creation failed occasionally. In Version 2.3, the bug was fixed.
Version 2.2 2014.06.19
In Version 2.2, I added two buttons to replay historical harmonic patterns back and forth. This will help users to develop their trading strategy. Core search engines are remained intact. White background colour is used for chart instead of default chart. White background colour is better when user want to combine harmonic pattern with Price Breakout Pattern Scanner.
Version 2.0 2014.06.02
In Version 2.0, Candlestick pattern recognition function was added.
Therefore, Harmonic Pattern Plus MetaTrader 4 Version is identical to Harmonic Pattern Plus MetaTrader 5 Version.
Version 1.9 2014.05.28
I found Name for harmonic pattern was not displayed correctly in 4 digit broker platform. So I corrected this error.