Time Box Indicator MT5
- Indikatoren
- Young Ho Seo
- Version: 1.5
- Aktualisiert: 4 März 2022
Introduction To Time Box Indicator
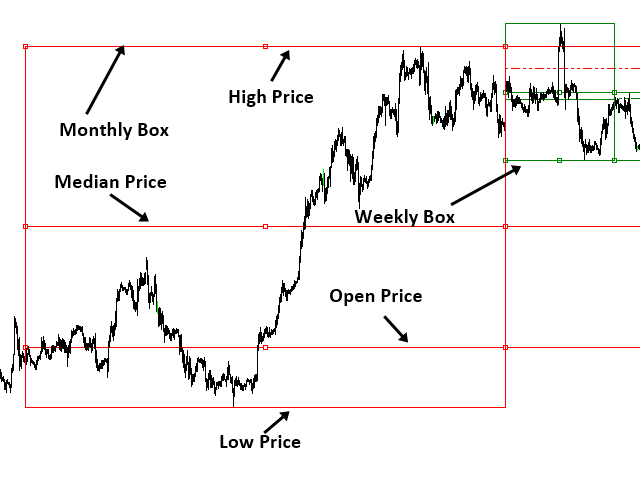
Time Box Indicator is a must have indicator for any trader. It will display daily, weekly and Monthly box according to your preferences.
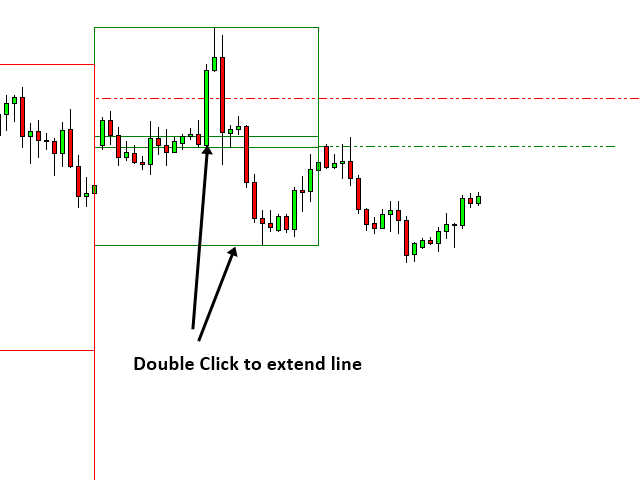
Yet, you can extend any important price levels in your chart automatically. You can use them as the significant support and resistance levels.
It is very simple but effective tool for your trading.
Graphic Setting
- Use White Chart
- Line Style for Current Open price
Daily Setting
- Update Timeframe for daily box
- Number of days to display
- Days Box Color
- Days Box Width
Weekly Setting
- Update Timeframe for weekly box
- Number of weeks to display
- Weeks Box Color
- Weeks Box Width
Monthly Setting
- Update Timeframe for monthly box
- Number of months to display
- Months Box Color
- Months Box Width
Trading Strategy Guide
You can use Time Box Indicator together with any of following technical analysis.
Volume Spread Analysis: https://www.mql5.com/en/blogs/post/747652
Harmonic Pattern Detection Indicator: https://www.mql5.com/en/blogs/post/747647
Momentum Indicator: https://www.mql5.com/en/blogs/post/747633
Supply Demand Indicator: https://www.mql5.com/en/blogs/post/747632
Triangle Pattern, Falling Wedge Pattern, Rising Wedge Pattern and Channel: https://www.mql5.com/en/blogs/post/747649
Elliott Wave Indicator: https://www.mql5.com/en/blogs/post/747668
Volatility Indicator: https://www.mql5.com/en/blogs/post/747670
Important Note
This is the off the shelf product. Therefore, we do not accept any modification or customization request on this product. In addition, we do not provide any code library or any support for your coding for this product.


OK