Color Candles Show the Trend Change
- Indikatoren
- Ziheng Zhuang
- Version: 4.20
- Aktualisiert: 14 August 2018
- Aktivierungen: 10
Der Indikator besteht aus zwei Teilen.
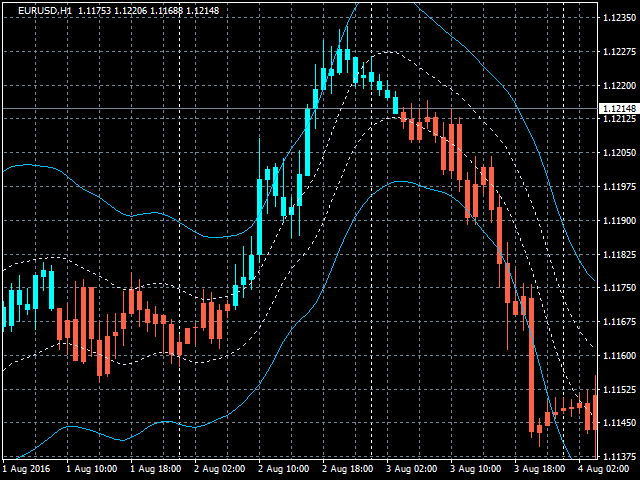
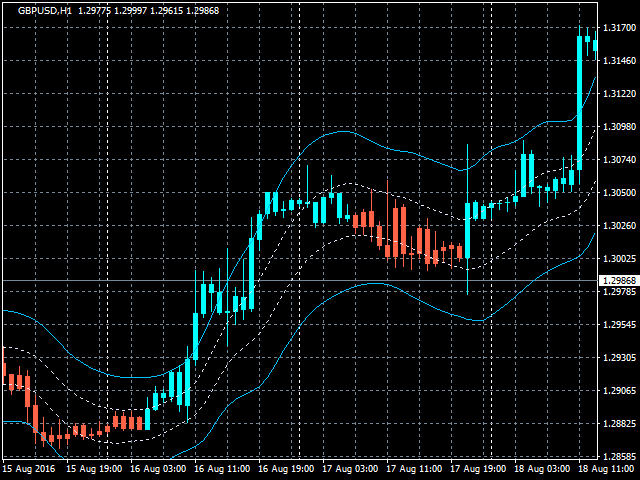
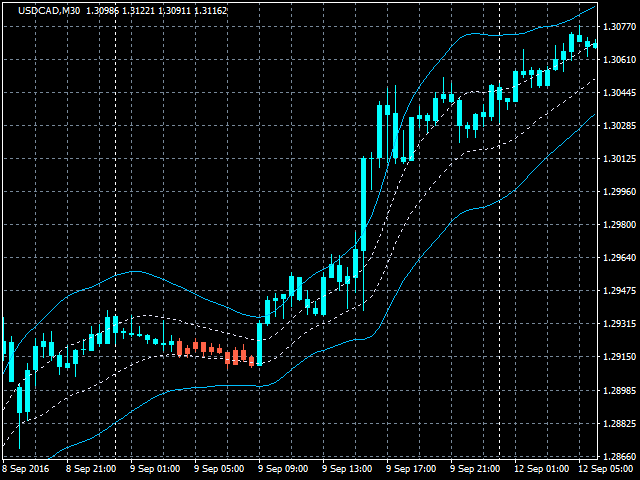
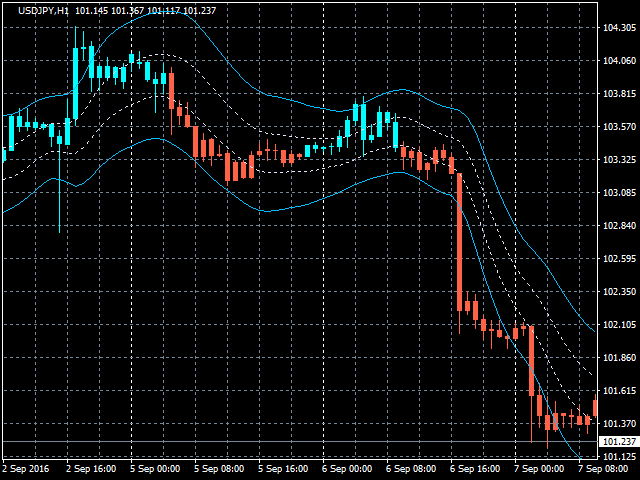
Teil I: Farbkerzen zeigen den großen Trend
Farbkerzen dienen dazu, den Marktzustand anhand von Farbkerzen zu identifizieren.
Wie in den Screenshots gezeigt, befindet sich der Markt in einem Zustand, in dem Sie Long-Orders platzieren oder Short-Orders beenden sollten, wenn die Farbe Aqua ist. Wenn die Farbe Tomate ist, ist es an der Zeit, Short-Orders aufzugeben oder Long-Orders zu beenden.
Wenn sich die Farbe ändert, ist es besser, auf den Abschluss zu warten (bis der aktuelle Balken geschlossen wird).
Teil II: Bänder zeichnen
Die inneren Bänder sind als sicherer Bereich definiert und die äußeren Bänder dienen als Nahbereich.
Handelsstrategie wie folgt:
- Wenn die Farbe Aqua ist und der Preis in den inneren Bändern liegt, geben Sie eine Langbestellung auf. Wenn der Preis die äußeren Bänder überschreitet, ist es Zeit, die Bestellung abzuschließen.
- Wenn die Farbe Tomate ist und der Preis in den inneren Bändern liegt, geben Sie eine kurze Bestellung auf. Wenn der Preis die äußeren Bänder überschreitet, ist es Zeit, die Bestellung abzuschließen.
Eingabeparameter
- ShowColorCandle - true bedeutet, dass der Indikator eine farbige Kerze zeichnet.
- AlertColorChange – true“ bedeutet, dass eine Warnung ausgegeben wird, wenn der Farbwechsel abgeschlossen ist.
- EmailColorChange – true bedeutet, dass eine E-Mail gesendet wird, wenn die Farbänderung abgeschlossen ist.
- ShowBands – true bedeutet, dass der Indikator die Bänder zeichnet
- AlertCrossOuterBands - Echte Männer werden alarmiert sein, wenn der Preis die äußeren Bänder überschreitet
- AlertCrossOuttrBands - „true“ bedeutet, dass eine E-Mail gesendet wird, wenn der Preis die äußeren Bänder überschreitet.
MT5-Version: https://www.mql5.com/de/market/product/1051