Technische Indikatoren für den MetaTrader 5 - 40

THE SOUND OF MARKET is an indicator designed to detect the sound produced for the market movement. This system detects the background sound produced by market movements in real time to decide in your operation. In addition, by analyzing the sound recorded in the indicator, we can detect operational patterns. You can download the demo and test it yourself.
The indicator has a text help in the upper right corner, in which it shows whether the indicator has a bullish or bearish backgro

TClusterSearch - индикатор для поиска кластеров согласно заданным критериям. Для работы индикатора требуются реальные биржевые обьемы. Основная функциональность
Поиск и визуализация кластеров с обьемом, задаваемым фильтрами (до трех). Для каждого фильтра можно задать свой цвет. Поиск и визуализация кластеров с дельтой большей значения задаваемым фильтром Поиск и визуализация кластеров по бид/аск согласно фильтру Возможность фильтровать кластера в зависимотсти от его положения относительно б
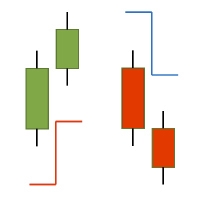
The ATR-StopLoss-Line indicator for MT5 calculates a stoploss line by the Average-True-Range (ATR) - Value of the particular candle. As point of reference you can choose the High/Low or Close of the particular candle. The indicator is suitable for scalping and intraday trading. The indicator does not redraw (recalculate). Signals are generated strictly on the "Close of the bar". It can be used as a standalone tool or together with other indicators. Alerts on Colorchanges are activatable.
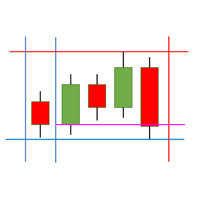
The SessionLines indicator for MT5 shows up the most important time intervalls and price levels in the DAX-Index. The following times get marked: Opening Time DAX Future, Opening Time DAX Kassa, Closing Time DAX Kassa, Closing Time DAX Future, Opening Time US Index Futures, Opening Time US Kassa Markets, Spezial Times, The following price levels get marked: Daily High/Low, Previous Daily High/Low, Weekly High/Low, Opening and Cloth Levels of Future and Kassa Daily (inkl. Previous Day).
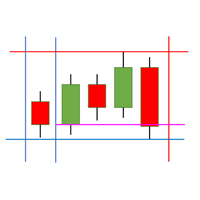
The SessionLines indicator for MT5 shows up the most important time intervalls and price levels in the US- Indices .
The following times get marked: Opening Time US Futures, Opening Time US Kassas, Closing Time US Kassas, Spezial Times,
The following price levels get marked: Daily High/Low, Previous Daily High/Low, Weekly High/Low, Opening and Cloth Levels of Futures Daily (inkl. Previous Day).

MOUNTAINS:It is an indicator that detects market consolidations prior to a movement.
The objective of this indicator is to indicate the areas before the market makes a move.
The areas that we are interested in detecting are the PLATEAU, which are between the slopes.
When the system detects a PLATEAU , the trader must place his operation in that area, waiting for the increase in volatility to reach its target.
The best option to carry out the operation of the PLATEAU is th

Volume Analysis Trader looks at volume using a fixed average of volume. This averaging helps spot when volume is rising or declining. Also I have added volume spikes which are when volume suddenly is above the average. These help spot market reversals.
This will hep a trader look for the following in their trading:
Rising volume during a rally shows trend is strong. Falling volume on a rally shows trend is weakening. As a rule of thumb on daily charts if current volume is higher than yester
Pullback Probability It is an indicator that shows us the probability that the price will t urn around and we can operate that market turn.
The indicator marks a line that oscillates between a percentage of 0% to 100%.
The one indicated in the upper left corner shows us a help in which it informs us of the area in which the price is in real time, as well as the percentage that the candle is open. You can download the demo and test it yourself.
The indicator marks 6 work zones. 1) Above 80

The Keltner Channels are powerful tools of technical analysis made specifically to take advantage of the opportunities created by price volatility. The indicator was originally developed by the American Chester W. Keltner, in the 1960s, and is widely used, especially in the American market.
However, despite the high usability in the market, the Keltner Channel suffers from a problem of having only 2 channels, which makes it very difficult to know the right time to enter or leave a position. S

Las Bandas de Bollinger se encuentran entre los indicadores más utilizados en el análisis técnico, su autor es el estadounidense John Bollinger, analista financiero y gran colaborador en el área. John comenzó a desarrollar esta técnica en la década de 1980 y en 2001 publicó su libro Bollinger on Bollinger Bands.
Las bandas de Bollinger son muy útiles para indicar niveles de precios en los que una acción puede haberse apreciado o devaluado demasiado, además de indicar signos de máximos y fon
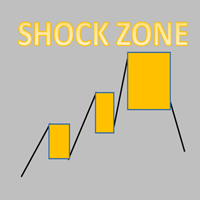
Every trading shock range is a point of gaining momentum!
The stop loss is generally the height of the shock zone.
Take profit depends on personal preference and market position. Generally at least double the height of the shock zone. Being in a good market position, it can have a profit-loss ratio of 5-10
Necessary for traders: tools and indicators Waves automatically calculate indicators, channel trend trading Perfect trend-wave automatic calculation channel calculation , MT4 Perfect

Provide ideas for trend trading.
Automatic calculation and generation of trend channels.
The channel line, also known as the pipeline line, is to draw a straight line parallel to the trend line in the opposite direction of the trend line, and the straight line crosses the highest or lowest price of the recent period. These two lines run the price in the middle and have obvious pipe or channel shapes. Necessary for traders: tools and indicators Waves automatically calculate indicators, chann
Dieser Indikator bestimmt die Kanäle, auf denen sich die Preise in der Handelshistorie bewegen. Es gibt viele Handelsstrategien, die auf dem Kanalhandel beruhen, um die Kanalgrenze zu überschreiten. Dieser Indikator kann Preiskanäle zeichnen, indem Informationen aus mehreren Zeiträumen gleichzeitig gelesen werden (aus dem aktuellen, aus dem zweiten und dritten). Sie können die Farbe und Dicke der Linien für jeden Zeitraum anpassen. Sie können auch einen anderen Abstand zwischen Höhen und Tiefen

Die BTFX-Drehpunkte sind ein Indikator, der die Unterstützungs- und Widerstandsstufen für jeden Tag berechnet. Mit diesem Indikator zeigen die Pivot-Ebenen klare Ziele auf, auf die abgezielt werden soll. Die Widerstandsstufen werden über der silbernen Pivot-Linie in lila angezeigt. Die Unterstützungsstufen sind in Orange dargestellt und befinden sich unterhalb der silbernen Pivot-Linie. Dieser Indikator funktioniert sehr gut, wenn er mit dem BTFX Daybreak Indicator verwendet wird. Eine

Genetic Code , is an indicator that differentiates two types of market: the market in range and the market with volatility.
This indicator allows the trader to choose whether to use a range trade or a volatility trade. You can download the demo and test it yourself.
When observing the trace of the indicator it shows us narrow areas that correspond to market ranges.
These ranges always end with a volatility process, so you can work with two conditional pending orders.
When th

Audible order flow, we can set a different tone for up to 12 buy order sizes and 12 other sizes for sell orders.
Up to 84 musical notes are available, ie 7 octaves. The default settings have been tested in the Forex (EURUSD, GBPUSD, XAUUSD, USDJPY, USDCHF and USDMXN) and Brazilian futures (WDOFUT, DOLFUT, WINFUT and INDFUT).
This tool was inspired by an interview with a visually impaired trader, as there are no tools for this type of trader and I decided to make it available for free, so

DNA is an indicator that allows us to operate both in favor of a trend and a pullback.
You can download the demo and test it yourself.
Trend trading is above zero and pullback trading is below zero.
The direction of the operation is marked by the color of the line.
If the line is green it corresponds to purchases.
If the line is red it corresponds to sales.
For example, if the green line is above zero and growing, we will have an uptrend operation. If the red line is above zero and

DNA is an indicator that allows us to operate both in favor of a trend and a pullback. You can download the demo and test it yourself.
Trend trading is above zero and pullback trading is below zero.
The direction of the operation is marked by the color of the line.
If the line is green it corresponds to purchases.
If the line is red it corresponds to sales.
For example, if the green line is above zero and growing, we will have an uptrend operation. If the red line is above zero and

Multicurrency and multitimeframe indicator of the Standard Deviation Channel. Displays the current direction of the market. On the panel, you can see breakouts and touches (by price) of the levels of the linear regression channel. In the parameters, you can specify any desired currencies and timeframes. Also, the indicator can send notifications when levels are touched. By clicking on a cell, this symbol and period will be opened. This is MTF Scanner. The key to hide the dashboard from the char
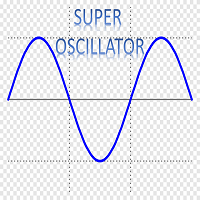
Super Oscillator , is a powerful indicator that vibrates along with the market, resulting in a very useful tool to improve and decide your trading.
You can download the demo and test it yourself.
In a versatile indicator that in a single graph shows us information about four different aspects of the market
1) 4 operational zones. The indicator divides the screen into 4 zones that allows us to properly assess the moment of the market. a) Pullback Buy Trend. If the indicator is ab

DAILY STATS PANEL is a small panel that shows some statistic of opened chart. For example: Fibonacci resistance and support, daily average moving points and today's moving range, etc. After applied this expert advisor to chart, a small panel will be shown on the right. ** NOTE: This is not an algo trading expert advisor. **
Input parameters show_pivot - Whether or not to show pivot, resistance and support line on the chart. Pivot Color - R1-R4, Pivot and S1-S4 horizontal line colors.
Stati

Swing Point Volume, the indicator that signals weakness and strength at the tops and bottoms. This indicador can be for used the Wyckoff Method.
Information provided; - Swing on customized ticks. - Volume and points in each balance sheet. - Percentage of Displacement. - Sound alert option on top and bottom breaks. - Volume in ticks and Real Volume. - Volume HL (extreme) or (opening and closing) - Customized volume shapes.

O Indicador ATR Projeção destaca-se como uma ferramenta robusta na análise técnica, projetada para fornecer insights precisos sobre os limites potenciais de movimentação dos preços no mercado financeiro. Sua abordagem flexível permite aos usuários customizar as métricas de análise de forma intuitiva, adaptando-se às necessidades específicas de cada ativo operado.
Funcionamento Personalizável:
Por padrão, o ATR Projeção opera considerando 30% da média dos últimos 100 candles. Essa flexibili

Smoothing Oscillator , is a powerful indicator that vibrates along with the market, resulting in a very useful tool to improve and decide your trading. This indicator is a smoothed version of the Super Oscillator MT5 that you can download at this link https://www.mql5.com/es/market/product/59071 The idea of this indicator is to smooth and limit the aggressiveness of the previous indicator, it has less power in terms of pullback points but has more power to detect trends and consolidations Yo

You ask yourself the question every time you open your charts: how to win in trading? Will using a lot of indicators work? well know that I also asked myself the same questions when I first started trading. After testing many indicators, I realized that winning trading is simple and accurate trading. after several months of thinking and optimizing I was able to find my solution: Candle Good Setup Candle Good setup is a trend and entry timing indicator analyzing the market in multi-frame to give

Are you tired of drawing Support & Resistance levels for all charts of the same Symbol while doing Multi-Timeframe analysis? Well, if you are Price Action trader then this indicator will solve your problem. Draw on 1 Timeframe and it will auto-sync with other charts of the same Symbol. You can draw rectangles, lines, arrows, and eclipse. It will give an alert when touched/break on line and arrow. It work's on all Timeframe.
Major Update
Added::
1}Triangle
2}Fibonacci Retracement

This utility is a universal meta-indicator that enables you to use any other indicator calculated over the higher timeframe (HTF) data. Now you may find precise entries and exits on working timeframe with no need of switching to a higher timeframe. You no longer need to purchase HTF version of you favorite indicators.
Indicator parameters: inp_ind_name - name of the indicator that should be calculated on the selected timeframe. You can choose from: the list of built-in indicators (e.g. MA for

This indicator watch the Fibonacci retracement for levels and timeframes selected by the trader. In the workload of day trading, having your eyes on all the timeframes to validate some information, for Fibonacci traders, is really time consuming and requires constant focus. With this in mind, this tool allows you to have your attention on other trading details while this one monitors the retracements of each timeframe in real time. In the charts, this indicator data (retracement %, age of the r

Crash 1000 Alert is an indicator that alerts trader when price is in the CRASH ZONE. The defaults settings work best only on Crash 1000 Index but are also fully customizable.
How to use: When price enters the crash zone, the indicator will send out messages of a potential crash. Traders can use this info to enter sell trades and capitalize on the spike down. Notifications and alerts are sent to your mobile device and platforms respectively. NB: please make sure notifications are enabled

This utility is a universal meta-indicator that enables you to use any other indicator calculated over the higher timeframe (HTF) data. Now you may find precise entries and exits on working timeframe with no need of switching to a higher timeframe. You no longer need to purchase HTF version of you favorite indicators.
Indicator parameters: inp_ind_name - name of the indicator that should be calculated on the selected timeframe. You can choose from: the list of built-in indicators (e.g. M

Um den Long- und Short-Indikator effektiv zu nutzen und die Korrelationen zwischen verschiedenen Assets zu nutzen, ist es wichtig, einige grundlegende Schritte zu befolgen. Verstehe die Grundlagen des Indikators: Mach dich mit den zugrunde liegenden Metriken und Berechnungen des Long- und Short-Indikators vertraut. Verstehe, wie er Währungspaare, Indizes oder Kryptowährungen korreliert und positive oder negative Korrelationen zwischen diesen Assets identifiziert. Analysiere die Korrelationen zwi

Description
Money Zones is an indicator that determines accumulation/distribution zones in the market. Green zones make it possible to look for buy entry points or sell exit points. Red zones, on the contrary, define the opportunity for selling or closing buys. The indicator has the ability to define money zones for two timeframes simultaneously on the same chart.
How to use?
Use this indicator to identify market zones as support/resistance zones to determine the best conditions for marke
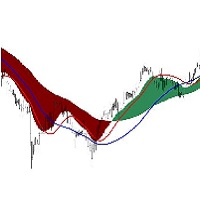
The Visual MACD Indicator is a forex technical analysis tool based on Moving Average Convergence Divergence, but it is plotted directly on the main trading chart with two macd signals. You should look for buy trades after the yellow line crosses the blue line and the MACD wave is blue. Similarly, you should look for sell trades after the yellow line crosses the blue when the MACD wave is red and the price is below the blue line . Go ahead and add it to your best trading system. It fits all
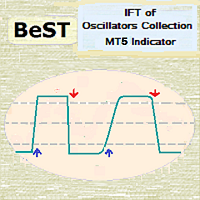
BeST_IFT of Oscillators Collection is a Composite MT4/5 Indicator that is based on the IFT ( Inverse Fisher Transformation ) applied to RSI , CCI , Stochastic and DeMarker Oscillators in order to find the best Entry and Exit points while using these Oscillators in our trading. The IFT was first used by John Ehlers to help clearly define the trigger points while using for this any common Oscillator ( TASC – May 2004 ). All Buy and Sell Signals are derived by the Indicator’s crossings of the Bu

Description :
VWAP (Volume-Weighted Average Price) is the ratio of the value traded to total volume traded over a particular time horizon. It is a measure of the average price at which pair is traded over the trading horizon. Read More.
All Symbols and All Timeframes are supported.
Indicator Inputs :
VWAP Mode : Mode of VWAP Calculation. Options can be selected : Single,Session,Daily,Weekly,Monthly
Volumes : Real Volumes,Tick Volumes
Price Type : Used price for cal

This is a momentum Indicator adapted to work on lower timeframes for Boom and Crash Indeecies. However the indicator can work with other Synthetic Indecies.
The indicator trend colour is set default to Aqua, then sell signal, the colour changes to red and blue signifies buy signals. .
For non Boom nor Crash Indecies use a smaller period and slightly increase the deviation.
The moving average is the easiest indicator to recognize changes in the price of a currency.
It is excellent to set multiple indicators for each period or type and see the transition.
However, setting multiple moving averages is very troublesome, isn't it?
Moreover, displaying multiple currency pairs will increase the time and effort.
It is an indicator that saves you the trouble.
You can display multiple moving averages at once.
You can freely set up to 4 lines, line thickness,

Find out in real time which side, buy or sell, is putting the most pressure through a simple and efficient visualization of Depth of Market. The indicator calculates the amount of offers at the specified depths and displays the percentage on each side in relation to the total. PressureBook Indicator is fully customizable, in which you can: Select which symbol you want to track. By default, the selected symbol is the same as the graph in which the indicator was inserted; Define the amount of pri
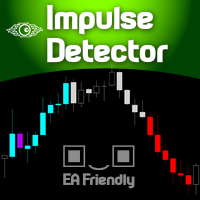
Imagine a support tool that Colors Up the candlesticks on your chart according to the market behavior, based on Trend , Momentum , Price Behavior, and/or Volume . You choose what to use! Well, welcome to the Minions Labs creation called Impulse Detector ! This flexible indicator is designed to give visual support on your chart using just colored candlesticks, so you can continue to draw your studies, use any other indicators in auxiliary sub-windows without affecting your screen real state. It d
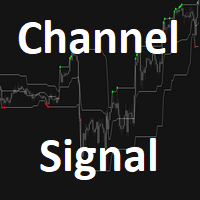
Der Kanal-Forex-Indikator ist auf extreme Preiswerte für einen bestimmten Zeitraum ausgelegt.
Der Indikator besteht aus drei deutlich gefärbten Linien, die denen der Bollinger-Bänder ähneln.
Grundlegende Handelssignale
Kaufsignal: Gehen Sie long, wenn der Preis über der mittleren mittleren Linie des Indikators öffnet und schließt, und handeln Sie entlang der oberen Kanalgrenze.
Verkaufssignal: Gehen Sie short, wenn der Preis unter der mittleren, mittelblauen Linie des Indikators öffnet

Leave a review for this product, and receive another "Free" product that you choose. You can see my other products here: https://www.mql5.com/en/users/zakri/seller
Trend Detective is an advanced trend detection indicator which shows accurate entry points in direction of trend. It uses smart technology in order to detect entry points, trend changing points, and TP points. It also shows hit rate for current chart using selected parameters. Hit rate for this indicator on different charts can be

FXC iMACD-DivergencE MT5 Indicator
This is an advanced MACD indicator that finds trend-turn divergences on the current symbol. The indicator detects divergence between the MACD and the price movements as a strong trend-turn pattern.
Main features: Advanced divergence settings
Price based on Close, Open or High/Low prices Give Buy/Sell open signals PUSH notifications
E-mail sending Pop-up alert Customizeable Information panel Input parameters: MACD Fast-EMA: The Fast-EMA variable of the MACD
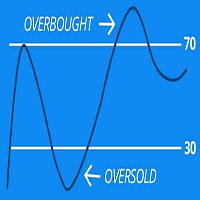
Scan all your favorite pairs with RSI, and get notified on your preferred time frames.
Settings are Customizable
Click to change time frame or open new pairs
Notification: Phone/Popup/Email The relative strength index (RSI) is a technical indicator used in the analysis of financial markets. It is intended to chart the current and historical strength or weakness of a pair/stock based on the closing prices of a recent trading period. The RSI is most typically used on a 14 period, measured on

GIVE A LOOK TO MY OTHER PRODUCTS !
100 % PER MONTH PROFIT---- MY NEW SIGNAL HERE -------> https://www.mql5.com/en/signals/2162238?source=Site+Signals+My# BROKEN TRENDLINE ALERT IS A SIMPLE TOOL INDICATOR. JUST DRAW IN YOUR CHART A DYNAMIC OR STATIC TRENDLINE,AND THE INDICATOR WILL SEND YOU ALERT WHENEVER THE PRICE CROSSES BELOW OR ABOVE YOUR DRAWN TRENDLINE. IT WORKS IN ANY TIMEFRAME AND ANY CHART YOU WANT.JUST GOT A VPS AND DON'T STRESS IN FRONT OF YOUR COMPUTER.
FOR ANY KIND OF QUESTION
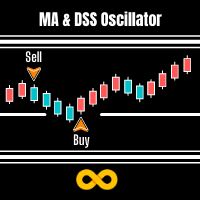
MA & DSS Oscillator is a simple system that overcomes all the market confusion by looking at the Moving Average and Double Smoothed Stochastic Oscillator. A Signal is made when the Oscillator is under 50 (A default value) and heading in same direction as the Moving Average.
The moving average is arguably the simplest but most effective tool when trading larger timeframes. We use this and the Double Smoothed Stochastic Oscillator to time our market entry.
Double Smoothed Stochastic is simila

The Market Sessions Indicator for MT5 helps you predict market turnarounds by detecting major supply and demand areas. These pivot points tend to occur after a new session has started and the previous one is still open. It is also used to gauge how many points or pips the market moves on average during a session. This helps us to place better our take profits and stop losses. The indicator works on all forex pairs, gold, silver, commodities, stocks, indices and any other instrument that your

GIVE A LOOK TO MY OTHER PRODUCTS ! 100 % PER MONTH PROFIT---- MY NEW SIGNAL HERE -------> https://www.mql5.com/en/signals/2162238?source=Site+Signals+My# MACD Cross Alert is a tool indicator that notificate directly to your phone whenever the signal line crosses the base line. For more accurate signals,crosses are filtered like this : Buy Signal : SIGNAL LINE CROSSES ABOVE BASE LINE AND BOTH ARE ABOVE THE 0 VALUE Sell Signal : SIGNAL LINE CROSSES BELOW BASE LINE AN

Bei der Analyse finanzieller Zeitreihen gehen Forscher meist davon aus, dass die Preise nach dem normalen (Gaußschen) Gesetz verteilt werden. Dieser Ansatz beruht auf der Tatsache, dass eine große Anzahl realer Prozesse unter Verwendung der Normalverteilung simuliert werden kann. Darüber hinaus bereitet die Berechnung der Parameter dieser Verteilung keine großen Schwierigkeiten. Auf den Finanzmärkten funktioniert die Normalverteilung jedoch nicht immer. Die Renditen von Finanzinstrumenten haben

GIVE A LOOK TO MY OTHER PRODUCTS ! 100 % PER MONTH PROFIT---- MY NEW SIGNAL HERE -------> https://www.mql5.com/en/signals/2162238?source=Site+Signals+My# Breakout Wall is a very cool indicator. It paints a resistance and a support in the chart given by a " n " number of candles ( you can choose the parameter ),and give you an alert when a candle closes below a support or above a resistance.Very important tool if you trade daily candles for example..... Just close your pc and don'

The patterns of 3 (three) Candles:
Three White Soldiers; Three Black Crows; These are reversal patterns widely used by traders, as they have a high probability of showing the inversion of the current market movement. For example, if in a bullish trend there are three black crows, there is a high probability of reversing the current bullish movement.
The Three White Soldiers have the following characteristics: There are 3 consecutive candles with a good body, that is, the difference between

Der IndicateMe-Indikator wurde speziell entwickelt, um so viel Rauschen wie möglich aus den von ihm abgegebenen Signalen zu entfernen.
Der Indikator wurde mit mehreren anderen bekannten Indikatoren kombiniert. Verwendete Indikatoren: "Gleitender Durchschnitt, stokastischer Indikator, relativer Stärkeindex, gleitend".
Alle verwendeten Indikatoren können von Ihnen selbst angepasst werden. Die Standardeinstellungen sind auf die Werte eingestellt, die ich gerne verwende.
Stellen Sie einfach
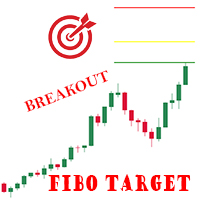
Indicator shows 3 Fibonacci expansion levels, based on the last pivot breakout. Pivots are calculated based on volatility (ATR), works on every Timeframe and Symbol. Lines are displayed only after the pivot breakout. A comment on the upper left side shows the minimum calculated value (in points) for pivots. Parameters: Variation: minimum variation for the pivot. ATR multiplication factor. (default 3) ATR Period: Period for ATR value calculations. (default 60)
Ex.: ATR on TimeFrame H1 = 100po
Leave a review for this product, and receive another "Free" product that you choose. You can see my other products here: https://www.mql5.com/en/users/zakri/seller
Harmonic Patterns Detector indicator draws harmonic patterns on chart. Harmonic patterns have a high hit-rate of around 80% and are excellent for trade entries. They are used as price reversal points. Some of them have a long history of usage and were created by famous traders like H. M. Gartley. Many harmonic patterns are included
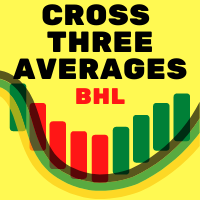
This indicator is based on the system of three moving averages where: First is the fast average (MA1); Second is the intermediate average (MA2) and; T hird is the slow average (MA3). The theory covered in the technical analysis books informs us that when the first average exceeds the second average it is an alert for the trader, however the movement occurs when the second average exceeds the third. The indicator will insert the check s Parameters : Averages : Period Fast Moving Average(FMA); Smo

Plucking Machine
Plucking Machine is a trend indicator designed specifically for gold and can also be used on any financial instrument. The indicator does not redraw and does not lag. Recommended time frame H1. The current setting is applicable for all time periods. It shows the current direction of the market based on price movements. Corresponding products of indicators: https://www.mql5.com/zh/market/product/61388?source=Site+Market+Product+Page#description
The brother Indicator :

Plucking Machine I Plucking Machine I is a trend indicator designed specifically for gold and can also be used on any financial instrument. The indicator does not redraw and does not lag. Recommended time frame H1. The current setting is applicable for all time periods. It shows the current direction of the market based on price movements. Corresponding products of indicators: https://www.mql5.com/zh/market/product/61388?source=Site+Market+Product+Page#description

This indicator provides you with MACD formula applied to volume-aware Accumulation/Distribution and OnBalance Volumes indicators. In addition to tick volumes it supports special pseudo-real volumes, synthesized for Forex symbols where real volumes are unknown. More details on the volume surrogates may be found in description of another indicators - TrueVolumeSurrogate and OnBalanceVolumeSurrogate (algorithm of the latter is used internally in MACDAD for AD and OBV calculation before they procee

GIVE A LOOK TO MY OTHER PRODUCTS ! 100 % PER MONTH PROFIT---- MY NEW SIGNAL HERE -------> https://www.mql5.com/en/signals/2162238?source=Site+Signals+My# Double MA Cross Alert,is a cool indicator that notificate you directly on your telephone or email when 2 Moving average ( you choose the parameters ) crosses. This is very important when you want to know a change of trend and you can't stay in front of your pc! The indicator give you the alert just when the next bar opens ,so give you a more

Automatic Fibonacci Tool Fibonacci retracements is a popular instrument used by technical analysts to determine potential Support and Resistance areas. In technical analysis, this tool is created by taking two extreme points (usually a peak and a minimum) on the chart and dividing the vertical distance by the key Fibonacci coefficients equal to 23.6%, 38.2%, 50%, 61.8%, and 100%. Our Automatic Fibonacci Tool is programmed to make thigs easier. Using this tool, there is no need to explicitly set

The indicator measures the accumulated balance of aggression.
The formula is as follows: Accumulated = Previous Candle Accumulated + Purchase Volume - Sales Volume. Know our products
*** Did you like the product? Then, help us doing review in the " Reviews " tab.
The indicator sends information to your email or cell phone when the accumulated balance changes direction. Example : Accumulated seller becomes a buyer.
Note : It is recommended to use the default configuration and VPS

The indicator measures the balance of aggression.
The formula is as follows: Aggression = Purchase Volume - Sales Volume.
Note : It is rec ommended to use the default configuration and VPS values. It does not work in Forex.
Meet Our Products
Parameters : Numbers of days prior to the current one for calculation; Volume Divider e; Enables calculation of the current candle; Histogram Line style and; Size; Line Line style and; Size;
Follow us on our website to check the next new
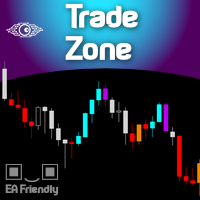
For those who are fans of Bill William's strategy, here it is the Trade Zone indicator filled with alerts and a better coloring system and EA ready (BUY & SELL buffers). And for those who don't know Bill Williams work, search Amazon for the title " Trading Chaos: Maximize Profits with Proven Technical Techniques ". This indicator internally uses the widely known Awesome Oscillator along with the Accelerator indicator, and when both are aligned it lights up the candles signaling a probable strong

根据高开低收价格确定反转点位,画出的极点折线。 The pole polyline is drawn according to the high opening and low closing price to determine the reversal point.
参数(Args):
1.周期数(Period)。参与界限计算的K柱数量。 2.界限(Divide)。计算方式包括: t1,顺高低价 (Buy min H,Sell max L) t2,逆高低价 (Buy min L,Sell max H) t3,收盘价 (Buy min C,Sell max C) t4,开盘价 (Buy min O,Sell max O) t5,高开低收价的一半 (HOLC/2) t6,高开低收价的一半+1 (HOLC/2+1) t7,高开低收价的一半+2 (HOLC/2+2) 3.跨越界限使用的价格(Price)。包括收盘价(C)和高低价(HL) 4.偏移(

Upgraded - Stars added to indentify Areas you can scale in to compound on your entry when buying or selling version 2.4 Upgraded Notifications and alerts added version 2.3 *The indicator is suitable for all pairs fromm Deriv pairs (Vix,jump,boom & crash indices) , Currencies, cryptos , stocks(USA100, USA30 ), and metals like gold etc. How does it work?
Increasing the period make it more stable hence will only focus on important entry points However lowering the period will mean the indica

This indicator calculates Correlation among currency pairs (Selected by user) to find the least and/or most correlated symbols in real time. Correlation ranges from -100% to +100%, where -100% represents currencies moving in opposite directions (negative correlation) and +100% represents currencies moving in the same direction.
Note The Correlation more than 80 (Adjustable) between two currency pairs, Shows that they are quite similar in the kind of movement and side. The Correlation less than
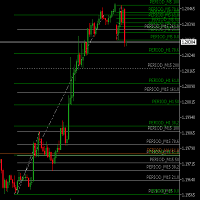
Sets and Updates Fibo-Retracemnet-Levels for Multi Timeframes. Helps to Find TradeZones combined over Multi-Timeframes. M1 M5 M15 H1 H4 D1 are analyzed and shown. Color Changes as soon 161 and 261 Retracements are reached to visualize possible Targets/ TakeProfit Zones . No Settings for Indicator available . Fibonacci retracements are set using a fixed Logic.

Profit Loss Meter For the serious trader this fun easy to use indicator allows you to measure Profit and Loss of current, closed or future trades on your forex account chart. It measures Currency Pairs And Indices plus estimates margin levels at the trade close point. The Profit/Loss indicator is based on MT5 native Crosshair instrument. TO ACTIVATED USE "HOT KEYS" ctrl+f just as you would for activating the Crosshair. left click and hold then drag in the direction in which you would like to m

Here I present you this awesome indicator I made. This is a nique combination witch puts you in the same level as MM's. So you can surf a lot of waves and identify the rally time, breakouts, and the perfect time to get in the market. ----
The SSL Channel is a great all-rounder based on 2 Simple Moving Averages, one of recent Highs, one of recent Lows. The calculation prints a channel on the chart consisting of 2 lines. This strategy gives a Long signal when price closes above the top of the
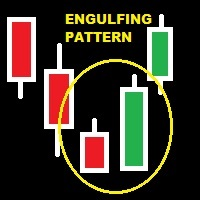
GIVE A LOOK TO MY OTHER PRODUCTS ! 100 % PER MONTH PROFIT---- MY NEW SIGNAL HERE -------> https://www.mql5.com/en/signals/2162238?source=Site+Signals+My# There are patterns that are more affidable then others.One of the most important is the engulfing pattern .It is very helpful to understand if there is a change of trend. This indicator find for you affidable engulfing patterns and send you an alert when a pattern is completely formed . To make this alert indicator more reliable,there is a
For those who are fans of the traditional MACD ( Moving Average Convergece/Divergence ) indicator, here it is a way faster indicator that could be very useful for intraday trading. Of course it could be used in higher timeframes, with the proper settings. Here at Minions Labs we always encourage traders to calibrate every single indicator you have to extract and distill every drop of good information it has for you. And this is the case with this speedy friend... This Zero Lag MACD could be used
MetaTrader Market - Handelsroboter und technische Indikatoren stehen Ihnen direkt im Kundenterminal zur Verfügung.
Das MQL5.community Zahlungssystem wurde für die Services der MetaTrader Plattform entwickelt und steht allen registrierten Nutzern der MQL5.com Webseite zur Verfügung. Man kann Geldmittel durch WebMoney, PayPal und Bankkarten einzahlen und sich auszahlen lassen.
Sie verpassen Handelsmöglichkeiten:
- Freie Handelsapplikationen
- Über 8.000 Signale zum Kopieren
- Wirtschaftsnachrichten für die Lage an den Finanzmärkte
Registrierung
Einloggen
Wenn Sie kein Benutzerkonto haben, registrieren Sie sich
Erlauben Sie die Verwendung von Cookies, um sich auf der Website MQL5.com anzumelden.
Bitte aktivieren Sie die notwendige Einstellung in Ihrem Browser, da Sie sich sonst nicht einloggen können.