Handelsroboter und Indikatoren für den MetaTrader 4 - 16

This indicator is not only for trading but also for learning, thanks to it, you can learn to identify trend, support and resistance.
You've probably heard about the Dow trend theory, where higher highs and higher lows indicate an uptrend, and lower highs and lower lows indicate a downtrend. This indicator determines this trend based on the Dow Theory. You just need to enter a number representing the number of candles between extremes. The optimal solution is the number 3 (H1 TF), unless you
FREE

The Easy Strategy Builder (ESB) is a " Do It Yourself " solution that allows you to create a wide range of the automated trading strategies without any line of codes. This is the world’s easiest method to automate your strategies that can be used in STP, ECN and FIFO brokers. No drag and drop is needed. Just by set conditions of your trading strategy and change settings on desired values and let it work in your account. ESB has hundreds of modules to define unlimited possibilities of strategi

High End algorithm, Super Intelligent Strategy for you. WinWiFi Fund Ai Robot is a safe system for Forex and Crypto currencies trading. Developed exclusively for the XAUUSD pair(GOLD), any currency pairs and any broker. Try now!
The Ai Robot is designed to operate in the XAUUSD (GOLD) and any currencies market, entering only when there are high probabilities of success and certain unique conditions. The Ai Robot is based on a robust, profitable strategy and NO MARTINGALE. No more indicator.
KT Murrey Math robot incorporates a trading strategy that explicitly trades the price bars that crossed above or below a Murrey Math level. Entries: A buy order is placed when a bar closes above a Murrey Math level. A sell order is placed when a bar closes below a Murrey math level. Exits: EA places the stop-loss and take-profit always at the subsequent Murrey Math levels.
MT5 Version is available here https://www.mql5.com/en/market/product/45406
Features
This EA combines a simple Murrey
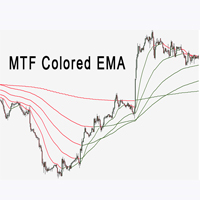
Der Multi Time Frame EMA-Indikator ist eine große Hilfe bei der Bestimmung der Trendrichtung. Es kann eine hervorragende Ergänzung zu Ihrer bestehenden Strategie oder eine neue Grundlage sein. Wir Menschen können bessere Entscheidungen treffen, wenn wir visuell besser sehen. Daher haben wir es so gestaltet, dass es unterschiedliche Farben für Aufwärtstrends und Abwärtstrends anzeigt. Jeder kann dies so anpassen, wie es für ihn am besten funktioniert. Wir können den Ema-Indikator für alle Zeiträu
FREE

High End algorithm, Super Intelligent Strategy for you. Ava Ai Robot is a safe system for Gold, Forex, Crypto currencies, CFD trading. Developed exclusively for the XAUUSD pair(Gold), any CFD pairs and any broker using same time zone. Try now!
The Ai Robot is designed to operate in the XAUUSD (Gold) and any CFD market, entering only when there are high probabilities of success and certain unique conditions. The Ai Robot is based on a robust, profitable strategy and NO MARTINGALE. No more in

How the Indicator Works:
This is a Multi-timeframe MA multimeter indicator which studies if price is above or below a particular EMA range and shows Red/Green/Yellow signals. Red: Price Below EMA range Green: Price above range Yellow: Price within range
Indicator Properties:
EMA Settings: - Default Period is 200. You can change all MA Settings like Period, MA Method (SMA, EMA, etc) or MA Applied Price (Close, Open, etc).
- EMA Range list is a comma separated value list for different timefr
FREE

What is the Volume Weighted Average Price (VWAP)? The volume weighted average price (VWAP) is a trading benchmark used by traders that gives the average price an instrument has traded at throughout the day, based on both volume and price. It is important because it provides traders with insight into both the trend and value of the instrument.
What is the Difference between VWAP and AVWAP? While VWAP is having as starting point the beggining of the day,week,month etc. in the AVWAP you can pla

GTAS S-Trend is a momentum indicator that helps to determine trends using combination of MACD, RSI and moving averages. This indicator was created by Bernard Prats Desclaux, proprietary trader and ex-hedge fund manager, founder of E-Winvest.
Description The indicator oscillates between -65 and +65 with a neutral zone between -25 and +25 around a 0 equilibrium line. S-Trend between -25 and +25 indicates congestion zones with a bullish bias between 0 and +25, and a bearish bias between 0 and -25
FREE

The Breakout Indicator That Has Been Proven & Tested! Breakout Analyzer uses an advanced algorithm based on high probability price patterns. Each trade is analyzed on the statistics panel to help you evaluate the best breakout setups.
Bonus Strategy 1
Breakout Analyzer with Volume Critical Watch Video: (Click Here)
Bonus Strategy 2
Breakout Analyzer with Strength Meter
Watch Video: (Click Here)
Features Universal compatibility to different trading systems Analyzes statistics of breako

Der R Inside Bar Indikator für Metatrader 4 bietet einfach zu verwendende Preisausbruchsniveaus basierend auf Inside Bars.
Es funktioniert mit reiner Preisaktion und wird überhaupt nicht neu gezeichnet und erscheint im Hauptfenster des MT4-Charts in Form von zwei farbigen horizontalen Linien über und unter der eigentlichen inneren Leiste.
Die grüne horizontale Linie fungiert als Widerstand und die rote Linie als Unterstützung.
Long- und Short-Trade-Idee Eröffnen Sie eine Kauforder, wenn d
FREE

大家睇住冬令夏令時間呀~
MEDIAN = (High + Low)/2 TYPICAL = (High + Low + Close)/3 WEIGHTED = (High + Low + Close + Open)/4
--------------------- 附上自己用緊的 Setting, 不代表是最好的, 還需大家反饋 附上真倉紀錄, 全部EA入市, 但出市我成日手動, 但手動的效果欠佳, 應該信EA的... 附上今日2024/2/23的Cap圖, 16727.44追升, 16819.28手動平左, 高位~16895, 有進步空間的 --------------------- Min distance 係咩 ? Check time同Ordertime相距的距離 原意係, 兩個價差唔多即係冇方向, 就唔開單 用呢個最少距離可以只做大單邊 Checktime恆指16000 最少距離10000 <- 100點 Ordertime 16100以上/15900以下先會開 其他都當佢橫行唔玩 --------------------- -Check time means

This indicator presents an alternative approach to identify Market Structure. The logic used is derived from learning material created by DaveTeaches (on X)
When quantifying Market Structure, it is common to use fractal highs and lows to identify "significant" swing pivots. When price closes through these pivots, we may identify a Market Structure Shift (MSS) for reversals or a Break of Structure (BOS) for continuations. The main difference with this "protected" logic is in how we determine

This is a powerful system for binary options and intraday trading. The indicator neither repaints, nor changes its readings. Binary Reverse is designed to determine the points where the price reverses. The indicator fixes both reversals and roll-backs considerably expanding your analytical capabilities. It not only clearly shows correction and reversal points, but also tracks the overall trend dynamics.
Trading recommendations Coincidence of two signals (arrow and cross) is a strong entry sign

The indicator helps to determine the potential for price movement within the day and on a trend. For calculations, the average price movement on the instrument is used. If you have a problem setting TP, the indicator allows you not to overestimate your expectations. For volatile instruments, the SL position can also be taken into account. If the entry was in the right place, the risk / reward ratio will prompt a profitable level for profit taking. There is a reset button at the bottom of the sc
FREE

Geschwindigkeitswiderstandslinien sind ein leistungsfähiges Werkzeug zur Bestimmung von Trend- und Widerstandslinien. Der Indikator baut Linien mit extremen Grafiken und speziellen mathematischen Formeln. Der Indikator kann verwendet werden, um die Trendrichtung und die Umkehrpunkte zu bestimmen.
<---------------------------->
Parameter des Indikators:
"Depth of search" - die Tiefe (in Bars) der Suche nach den Extremen des Graphen "Back step of search" - der Mindestabstand (in Bars) zwisc
FREE

Candle Breakout EA is a trading tool for traders using the high and low breakout strategy of a previous candle. The EA waits till the price is higher than the previous candle's maximum or below the previous candle's minimum, and later opens a certain order (you can choose which type of order to open when the extremes are broken). This type of trading is well suited for classic strategies such as day trading on daily charts, breaking the morning candle on Monday, impulse trading, etc. The Expert

This is a modified Fractals indicator. It works similar the original Bill Williams' indicator, and is additionally enhanced with the possibility to change the top radius, in contrast to the standard radius of 2 bar. Simply put, the indicator checks the top and if it is the minimum/maximum in this radius, such a top is marked by an arrow. Advantages Adjustable radius. Use for drawing support and resistance levels. Use for drawing trend channels. Use within the classical Bill Williams' strategy or
FREE
First of all, it is worth highlighting here that this Trading Indicator is Non Repainting, Non Redrawing and Non Lagging, which makes it ideal for manual trading. Never repaint and recalculate Once an arrow appears it never disappears, the signal comes at the opening of the new candle You will now be more profitable with this indicator You can do swing trading or scalping trading The indicator helps you identify the trend Can be optimized across all pairs and time frames Blue arrow is for buyin
FREE
Strategy Master is a 5-in-1 EA, offering a choice of 5 distinct strategies within a single expert advisor. You can activate one to five strategies simultaneously and customize your trading by enabling or disabling filters to validate entries. These five strategies encompass a range of approaches, including three technical strategies (Moving Average, Bollinger Bands, and Ichimoku), a renowned price action strategy (Breakout), and a time-based strategy (SendOrder at Time). We understand that mar

A powerful trend analysis tool for traders of all levels Super Trend Analyzer is a technical analysis tool that uses the Relative Strength Index (RSI) and Moving Average (MA) indicators to identify trends in the market. It is a versatile tool that can be used by traders of all levels of experience.
How does it work An uptrend begins when the main trend line and the auxiliary trend line cross from below and the lower minor oscillator is on the rise. A downtrend begins when the main trend line a
FREE

Make grid trading safe again | Built by a grid trader >> for grid traders.
Walkthrough Video <== Get Grid Rescue up and running in 5 minutes This is MT4 version, click here for BlueSwift GridRescue MT5 (settings and logics are same in both versions) BlueSwift Grid Rescue MT4 is a risk management utility EA (used together with other grid trading experts) that can help you trade aggressive grid systems with manageable drawdown, therefore reduce substanstially margin call risk as w
#forex #sharemarket #trading Disclaimer :- My videos, presentations, and writings are strictly for educational purposes and should not be considered investment advice. I cannot guarantee the accuracy of any information provided. It is essential to conduct your own research and consult a qualified financial advisor before making any investment decisions. I bear no responsibility for any financial losses or negative outcomes resulting from the use of my content. Please exercise caution and seek
FREE

Monitors the current trend, gives signals for an uptrend, downtrend and weakening of the current trend. Colors the situation on the market with the appropriate color. Tool - any. Timeframe - any. Advantages The indicator does not repaint its signals. There are alert signals. Easy to use. Flexible settings. Suitable for trading any financial instruments. Settings Name Description Fast parameter The value of the fast parameter in the indicator (Should be less than the slow one). Slow parameter The
FREE

Indikator zur Bestimmung von Flat und Trend. Wenn der Preis unter einem der beiden Histogramme und zwei Linien (rot und blau) liegt, ist dies eine Verkaufszone. Beim Kauf dieser Version des Indikators, MT4-Version für ein echtes und ein Demo-Konto - als Geschenk (zum Erhalten, schreiben Sie mir eine private Nachricht)! Wenn der Preis über einem der beiden Histogramme und zwei Linien (rot und blau) liegt, ist dies eine Kaufzone. MT4-Version: https://www.mql5.com/en/market/product/3793 Wenn der

A trend indicator showing the strength of bulls and bears in a trading range.
Consists of two lines:
The green line is a balanced overbought/oversold condition. The red line is the direction of trading activity. Does not redraw calculations.
Can be used on all Symbols/Instruments/Time Frames.
Easy to use and set up.
How to use the indicator and what it determines.
The basic rule is to follow the direction of the red line:
if it crosses the green line from the bottom up, the market i
FREE

With this system you can spot high-probability trades in direction of strong trends. You can profit from stop hunt moves initiated by the smart money!
Important Information How you can maximize the potential of the scanner, please read here: www.mql5.com/en/blogs/post/718109 Please read also the blog about the usage of the indicator: Professional Trading With Strong Momentum This FREE Version of the indicator works only on EURUSD and GBPUSD. The full version of the indicator can be found here:
FREE
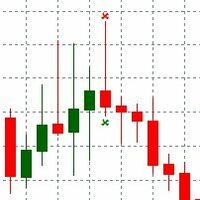
PinBar indicator is an Indicator identifies price reversal, pattern and timely identifies that price trend is changed. The Trend change is immediately identified over the chart. Alert is send over the Chart and Email address. Indicator generated Signal Price is displayed over the chart near the PinBar. Please make sure to use on Higher time frames if you are swing trader. for day traders who want to use M30 or M15 time frames, Take profit should be kept minimal. Lower than M15 is not recommende
FREE

FZR indicator determines fractal zigzag reversal pattern of all the time frames of the chosen symbol and shows the information in the Info label. Indicator draws the detected pattern in the chosen time frame and also you can select in the menu to draw the trend line according to FZR peaks. What it is FZR? See the first picture in the screenshots. As you can see for every peak of FZR the AO indicator must cross zero line. FZR indicator determines the trend direction.
How to use FZR for trading?
FREE

The Investment Castle Chances indicator will show signals on the chart for entering a buy or sell trade. There are 2 types of signals for each direction as follows: Buy / Sell (Orange colored candlesticks) Strong Buy (Green colored candlesticks) / Strong Sell (Red colored candlesticks) You may place a buy trade once you see the Buy arrow or vise versa, or you might prefer to wait for a further confirmation “Strong Buy” / “Strong Sell”. This indicator works best with the high time frames H1, H
FREE
Thomas DeMark Relative Retracement uses an objective and consistent approach to Fibonacci Trading by establishing a minimum of three reference points which may provide support or resistance in the market. A great tool for anticipating continued price trends and/or price exhaustions!
Bullish levels are calculated once a potential price low has occurred. This low is compared to previous price action to locate an earlier price low which is equal or lower than the current low. The intervening high
FREE
Or DBD%. The indicator consists of colored tape that shows trading signals depending on two Bermaui Deviation Oscillator (BD%) and two moving averages. Bermaui Deviation Percent is a volatility index that measures volatility in percent rather than points. The idea of BD% is to make an index depending on Classic Standard Deviation (CSD) that moves between 0 and 100 percent. Important Information
DBD% expert advisor example: https://www.mql5.com/en/blogs/post/731145
If you want to know mor
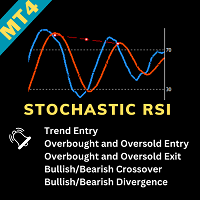
Stochastic RSI Indicator - Master the Art of Timing Elevate your trading game with the "Stochastic RSI Indicator." This powerful tool marries the Stochastic oscillator with the Relative Strength Index (RSI), offering precise insights into market dynamics. It's your key to mastering the art of timing in trading. About the Indicator : The Stochastic RSI Indicator combines two robust indicators - Stochastic and RSI - to provide traders with an exceptional tool for identifying entry and exit points
FREE
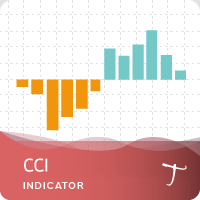
28 symbols, multi-time frame powerful Dashboard for the full market view Customizable Buy/Sell alerts, push alerts, email alerts, and visual on-screen alerts. Marked buy/sell signals Two color trend histogram. The commodity channel index (CCI) is an oscillator originally introduced by Donald Lambert in 1980. CCI measures current price level relative to an average price level over a given period of time. CCI is high when prices are above the average price, and low when the prices are below the a
FREE

Sirr Smart AI Express 3 for MT4 EA is an automated and easy to use expert advisor that has the Stochastic indicator working in combination with RSI and MACD filters built in. We have spent a lot of time testing many expert advisors . After years of testing and development, the result is an dynamic EA that is very active with trades and capital management. Our product is also fully compatible with PipFinite Trend Indicator PRO as well. The EA has been designed for trading with the popular symb
FREE

This is a smooth and responsive accelerometer which reveals the market trend and strength. [ Installation Guide | Update Guide | Troubleshooting | FAQ | All Products ]
Two moving averages indicate trend direction The histogram represents strength of the price movement It draws buy and sell zones as colored vertical lines Should be used as a confirmation indicator Customizable line widths and colors It implements alerts of all kinds This indicator is similar to MACD but aims to react faster t
FREE
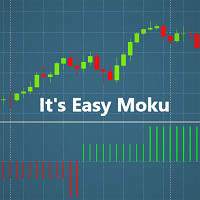
Introduction:
Welcome dear Users, This indicator has been developed in order to help traders who are daily struggling to find a strategy . I have always been acctracted by Ichimoku Strategy, however took me sometime figure out how it does work. Easy Moku makes Ichimoku Simple!
Aspect:
Easy Moku shows 2 principal ICHIMOKU signals: kijun sen/tenken sen sen crossover Span A Span B + Kijun sen/tenken sen Get Rid of all the Ichimoku Lines!
On the Mt4 Chart the Easy Moku paints an Histog
FREE

This indicator uses a different approach from the previous version to get it's trendlines. This method is derived from Orchard Forex, and the process of making the indicator is demonstrated in there video https://www.youtube.com/watch?v=mEaiurw56wY&t=1425s .
The basic idea behind this indicator is it draws a tangent line on the highest levels and lowest levels of the bars used for calculation, while ensuring that the lines don't intersect with the bars in review (alittle confusing? I kno
FREE

Pipfinite creates unique, high quality and affordable trading tools. Our tools may or may not work for you, so we strongly suggest to try the Demo Version for MT4 first. Please test the indicator prior to purchasing to determine if it works for you. We want your good reviews, so hurry up and test it for free...we hope you will find it useful.
Combo Energy Beam with Swing Control Strategy: Confirm swing pullback signals Watch Video: (Click Here) Energy Beam with Trend Laser Strategy: Confirm Tr

ClickDrag zeichnet Linien und verschiebt Objekte im Diagramm auf einfache Weise.
Klicken und dann ziehen, um eine Trendlinie zu zeichnen.
Durch horizontales Bewegen der Maus wird eine Kurslinie gezeichnet.
Wenn Sie die Maus vertikal bewegen, wird eine Datumslinie gezeichnet.
Vorhandene Linien und Objekte können durch Klicken und Ziehen verschoben werden.
Zeigt den Preis und die Zeitdifferenz zwischen dem Start- und Endpunkt an.
Nach dem Start Klicken&Ziehen,
Schütteln
FREE

Mit diesem Skript können Sie beliebige Zeichnungsobjekte wie Trendlinien, Fibonachi-Retracements usw. in einen oder mehrere andere Charts kopieren.
Standardmäßig kopiert das Skript alle Objekte auf dem aktuellen Chart, d. h. dem Chart, auf den das Skript angewendet wurde, in jeden anderen Chart mit demselben aktuell geladenen Symbol.
Einstellungen
ZielZeitrahmen Wenn es auf etwas anderes als PERIOD_CURRENT eingestellt ist, kopiert es die Objekte in jeden offenen Chart mit demselben Symbol
FREE

MT5-Version | Valable ZigZag-Indikator | FAQ
Die Elliott-Wellen-Theorie ist eine Interpretation der Vorgänge auf den Finanzmärkten, die auf dem visuellen Modell der Wellen auf den Kurscharts beruht. Nach dieser Theorie können wir genau wissen, welcher Trend am Markt gerade vorherrscht, aufwärts oder abwärts. Der Valable ZigZag-Indikator zeigt die Wellenstruktur des Marktes an und gibt die Richtung des aktuellen Haupttrends auf dem aktuellen Zeitrahmen an. Zu Ihrer Bequemlichkeit zeigt der T

Volatility Limit Trend Indicator (VLT), an original indicator by this developer, is a trend indicator based on setting a fixed volatility limit as a percentage of price. Volatile price is allowed to wander between two channel lines defining the fixed volatility about a central line. The price crossing one of the channel lines defines an exceeding of the allowed volatility, and ushering in one of two situation : either a continuation or a reversal of trend. The first buffer of the indicator (not
FREE

The indicator shows the Fibonaccia golden ratio levels and the price balance line Has three different sensitivity options Allows you to visually navigate what state the market is in and where trend reversals are possible Works on all timeframes, on any currency pairs, metals and cryptocurrencies Can be used when working with binary options Distinctive features Based on the golden Fibonacci value; Determines the balance line of price equilibrium Has three different sensitivity settings; Simple an
FREE

There are only a limited number of copies left, priced at 390 USD . After that, the price will be raised to 500 USD. All backtests were done with a modelling quality of 99.90%. The EA can trade on 7 currency pairs. To trade, you will need an ECN, RAW, STP or NDD account, which charges commissions and fees but gives a small spread. To trade you need the correct name of the currency pair without prefix and suffix and extra dot, otherwise you need to change the name of the currency pair in the
Download the free version here.
A Full Concept of BUY/SELL Scalping Strategy Trend detection is one of the basic challenges of every trader. Finding a way to tell when to enter a trade is very important, timing is a game changer, not too early and not too late. Sometimes, due to not knowing the market conditions, the trader closes his positions with a small profit or allows the losses to grow, these are the mistakes that novice traders make. Indicator Trend Whipper is a complete trading st
FREE

MACD (short for Moving Average Convergence/Divergence) is one of the most famous and oldest indicators ever created and is widely used among beginners . However, there is a newer version of the MACD that is named Impulse MACD which have less false signals than the standard MACD. Classic MACD helps us to identify potential trends by displaying crossovers between two lines. If MACD line crosses above the Signal line it shows us that the market is potentially up trending and that it would be a go

Expert description
Algorithm optimized for Nasdaq trading The Expert Advisor is based on the constant maintenance of long positions with daily profit taking, if there is any, and temporary interruption of work during the implementation of prolonged corrections The Expert Advisor's trading principle is based on the historical volatility of the traded asset. The values of the Correction Size (InpMaxMinusForMarginCallShort) and Maximum Fall (InpMaxMinusForMarginCallLong) are set manually.
Recom
FREE

McS Super Trend -This is one of the most popular classic trend indicators. It has a simple setting, allows you to work not only with the trend, but also displays the stop loss level, which is calculated by this indicator. Benefits:
Instruments: Currency pairs , stocks, commodities, indices, cryptocurrencies. Timeframe: М15 and higher. Trading time: Around the clock. Shows the direction of the current trend. Calculates the stop loss. It can be used when working with trading. Three types of no
FREE

Dies ist die ENGLISCHE Version. Um die PORTUGIESISCHE VERSION zu kaufen, gehen Sie zu: https://www.mql5.com/pt/market/product/58513 LASSEN SIE LordEA KOSTENLOS INSTALLIEREN UND AUF IHREM KONTO FUNKTIONIEREN, FRAGEN SIE MICH PER PRIVATE NACHRICHT. Der LordEA-Spezialist ist ein Roboter für Meta Trader mit dem Ziel, mit den eigenen Trends und Strategien des Roboters zu arbeiten.
Wir verwenden standardmäßig Methoden zur Distanzierung und Art des geometrischen Loses, bei denen der Roboter anhand

Expert description
The Expert Advisor's trading system is based on entry and exit at a certain deviation of the asset price from the moving average value. The Expert Advisor has a number of parameters, by manipulating which you can implement different trading systems and also get different results when trading on different assets, keep this in mind when setting up an Expert Advisor and do not use standard settings on all instruments and time frames.
Recommendations for use
The EA working t
FREE
The work of the utility is directed at opening new market orders, maintaining them, transferring the unprofitable orders into profit using an internal loss handling algorithm, trend filtering and various types of trailing stop and take profit. Suitable for any instruments and timeframes. The algorithm works separately for buys and sells, which allows simultaneously working in both directions as well. For the event when the additional orders opened by the utility do not become profitable, a Stop
This indicator analyzes in parallel price charts for multiple currency pairs on all timeframes and notifies you as soon as a double tops or double bottoms pattern has been identified.
Definition Double Top / Double Bottom pattern Double Top is a trend reversal pattern which are made up of two consecutive peaks that are more and less equal with a trough in-between. This pattern is a clear illustration of a battle between buyers and sellers. The buyers are attempting to push the security but are
Tipu Parabolic SAR Panel is the modified version of the original Parabolic SAR indicator published by MetaQuotes here . Dashboard Panel (multi symbol) version for this indicator is available here .
Features An easy to use Panel that shows the Parabolic SAR trend and signals of selected timeframe. Customizable Buy/Sell alerts, push alerts, email alerts, or visual on-screen alerts. Customizable Panel. The panel can be moved to any place on the chart or minimized to allow more space. To enable th
FREE

DEMO-Version von GoldSuperTrendEA Die Demoversion funktioniert nur im Backtesting.
TestGoldSuperTrendEA verwendet eine Strategie, die RSI und gleitenden Durchschnitt kombiniert.
Eine hohe Gewinnquote und ein hoher Gewinnfaktor machen diesen Expert Advisor sehr profitabel.
Es wurde für das XAUUSD-Paar entwickelt.
Einrichtung und Tipps:
Ich empfehle die Verwendung eines Guthabens von 1500 $ und eines anfänglichen Lots von von 0,05 mit einer Hebelwirkung von 1:100
Niedrige Zeitrahm
FREE

Dieser Expertenberater implementiert das ursprüngliche Handelssystem von Dennis und Eckhardt, das allgemein als The Turtle Trader bekannt ist. Es handelt genau wie die ursprünglichen Turtles und kann von erfahrenen Tradern verwendet werden, um Trends in auf- oder absteigenden Märkten zu erfassen. [ Installationsanleitung | Update-Anleitung | Fehlerbehebung | FAQ | Alle Produkte ] Einfach zu bedienen und zu überwachen Vollständig konfigurierbare Strategieeinstellungen Voll konfigurierbare Handel

Flow Trend BLACK FRIDAY: 50% DISCONT > OLD PRICE 100$ > NOW 50$
Flow trend is designed to detect the market trend with special calculation and a combination of Bolinger band and statistical moving period
to detect the market trend without frequency change and fault.
This indicator is designed with simple parameters to use fast and easy and helpful tools to trade in a pure direction and set your SL/TP with this indicator cloud system.
FREE

BeST_Gann Swing Oscillator is an MT4 indicator that is based on the corresponding work of Robert Krausz who introduced it in the book “ A.W.D Gann Treasure Discovered ” .
The Gann Swing Oscillator is a range-bounding technical indicator that oscillates between +1 and -1 and thus it describes the market swings.
Generally when the market is in an upswing, the Gann Swing Oscillator describes it as 2 higher highs with the value of +1 while after an upswing, the downswing is expected.
Also the do

Based on famous and useful indicator - Super Trend, we add some features to make this Indicator much easier to use and powerful. Ease to identify the trend of any chart. Suitable for both Scalping & Swing Better to use in the trending market be careful in sideway market, it might provide some fake signals Setting: ATR Multiplier ATR Period ATR Max Bars (Max 10.000) Show UP/DOWN node Nodes size Show Pull-back signals Pull-back filter ratio Period of MA1 Mode of MA1 Period of MA2 Mode of MA2 A
FREE

Basic Fibonacci Calculation Indicator
shows Trend, Stoploss, Profit 1,2,3, will show you your daily Highs and your Daily Lows , it will also show you where it expects the price to move to. best time frame is H1 or higher .
For a better system that also includes my Non-repaint Indicator please check out my paid Fibo Indicator https://www.mql5.com/en/market/product/82323
FREE

Big summer sale. Save up to 40% on my products. Supply & Demand dashboard - save 10$! The Netsrac Supply&Demand Dashboard shows you at a glance where relevant zones are located on your favorite assets. Open your chart directly from the dashboard and trade zones that really matter. Features
Finds the next relevant supply and demand zone and displays the distance to this zone (in pips) Finds and displays the zones in three different timeframes Calculates a trend indicator for the current and past

Leo Trend is a signal indicator that shows the market entry points, as well as the trend direction and flat on the chart in the form of arrows and lines. Leo Trend will be useful both for beginners creating a trading strategy, and for professionals to integrate into ready-made trading systems. Leo Trend works without redrawing and without significant delays. The operation of the indicator is demonstrated in the video. In addition, you can test this indicator in the strategy tester free of charge
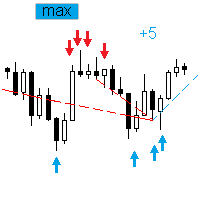
The Expert Advisor trades the signals from an artificial neural network with one hidden layer. Presence of a signal is checked at the closing of the specified period. MAIN PARAMETERS Net option - setting the order grid. When placing a market (not pending, Pending order offset=0 ) order according to a signal, the grid order is set. The following direction are available: follow the trend , against the treand and both directions . The number of placed orders is taken from the ...maximum deals with

Welcome to the trading world with Trend Candle Pumper – your reliable buddy in the financial markets! Trend Candle Pumper is a smart trading bot designed for those who want to dive into the investment scene without being experts in trading. How it Works: Trend Candle Pumper uses advanced artificial intelligence algorithms to analyze trends in financial markets. But what's a trend? Simply put, a trend is the overall direction an asset's price is moving. Our bot keeps an eye on this direction and

Are You Better than Monkey? Prove it...
The trade of this EA is based on random output with customizable lot size (use martingale or not), stop-loss, and take-profit levels. Easy to use and Simple Great for benchmarking tests against other EAs or manual trade. Works for ECN/Non-ECN brokers and 2-3-4-5 digit symbols Support us by open My recommended broker. Exness Tickmill robot monkey uses Adx trend filter for fair game no-trade unfavorable market ( you can turn off set adx = 0) . EA starts
FREE

Broken Trends is an indicator for scalpers and intraday traders. The indicator selects and displays trend levels on the chart in the real time mode. The indicator reacts to price momentum: it starts searching for the trends as soon as the momentum amplitude exceeds the threshold set in a special parameter. The indicator can also play a sound when the price crosses the current trend line. In normal mode, the indicator shows only one (last found) upward and one downward trend, but there is an adva
FREE

Check my p a id tools they work perfect please r ate Adjustable PIN BAR indicator is usefull tool alowing to search for pin bars you wish to find on the price chart, it has 2 parameters to filter out what type of pin bars you wish to search for: 1) MinTailProc 75% (default) which means to show pin bars that has minimum size of the Nose (Tail) as 75% of full candle size. If Upper Nose (Tail) size of the candle is minimum 75% of the candle size fully than candle is painted in RED. If Lower Nose
FREE

This indicator helps you to scan symbols which are in the Market Watch window and filter out a trend according to RSI.
The relative strength index (RSI) is a technical indicator used in the analysis of financial markets. It is intended to chart the current and historical strength or weakness of a stock or market based on the closing prices of a recent trading period. The indicator should not be confused with relative strength. The RSI is classified as a momentum oscillator, measuring the veloc
FREE

Anzeige der Sonarmechanik. Kontaktieren Sie mich nach dem Kauf, um die SonarHistogram-Leistungsbilanzanzeige kostenlos zu erhalten! Der Sonar Mechanic-Indikator ist ein wirklich funktionierender Indikator, denn er arbeitet mit drei Algorithmen des Autors, die Trend- und Gegentrendsignale für den Markteintritt korrekt identifizieren. Der Indikator funktioniert für alle Vermögenswerte und Zeitrahmen. Indikatoren-Leitfaden: https://www.mql5.com/en/blogs/post/750128 Bei Gold und Währungspaar

This tools is design to easily forecast the projection of the current trend through the inputs of Zigzag and get out of the market when the trend do not the ability to maintain it's volatility to go further... the indicator gets the initial and final price from the value of zigzag automatically by adjusting the intdepth of zigzag. You can also switch from Projection to Extension from the inputs tab of indicator.
FREE
Der MetaTrader Market ist eine einzigartige Plattform für den Verkauf von Robotern und technischen Indikatoren.
Das Merkblatt für Nutzer der MQL5.community informiert Sie über weitere Möglichkeiten: nur bei uns können Trader Handelssignale kopieren, Programme bei Freiberuflern bestellen, Zahlungen über das Handelssystem automatisch tätigen sowie das MQL5 Cloud Network nutzen.
Sie verpassen Handelsmöglichkeiten:
- Freie Handelsapplikationen
- Über 8.000 Signale zum Kopieren
- Wirtschaftsnachrichten für die Lage an den Finanzmärkte
Registrierung
Einloggen
Wenn Sie kein Benutzerkonto haben, registrieren Sie sich
Erlauben Sie die Verwendung von Cookies, um sich auf der Website MQL5.com anzumelden.
Bitte aktivieren Sie die notwendige Einstellung in Ihrem Browser, da Sie sich sonst nicht einloggen können.