Technische Indikatoren für den MetaTrader 4 - 5

BeST_Fibonacci Retracement Lines is an MT4 Indicator that by default is based on common Fibonacci levels but it can also draw any 3 desired levels of Retracement or Support of a trending move. It can be used to identify pullback points but also additionally as a kind of a Trailing Stop . BeST_Fibonacci Retracement Lines indicator: • by default draws 38.2%, 50% and 61.8% Retracement Levels of the current price move defined using the Highest High (HH) and Lowest Low (LL) of a desired Look Back Pe

Indicator FiboZag - transfer the indicator to the chart and the Fibonacci levels will be built automatically on the last ZigZag turn. The main advantage lies in the correct construction of Fibonacci levels and markup of price levels. Simple, visual and effective use. The indicator is not redrawn and does not lag. Works on all currency pairs and on all timeframes.

Channels + S & R Indicator (CSRI)
Indicator draws 3 channels (Large, Medium, Small) within bars’ range of current timeframe and pair / instrument. It can identify Support and Resistance levels within any chosen channel. Additionally Fibonacci levels can be drawn for Large Channel. All lines and levels can be customized by color and width.
Identify Support and Resistance Levels for any Channel:
IdentifySupportAndResistanceLevels - Identify Support and Resistance Levels IdentifySRforChannel –

Fibonacci-Erweiterung und Retracement-Analyse-Tool
Fibonacci-Retracing- und Extended-Line-Tools für die MT4-Plattform, ideal für Trader, die die und den Golden Section-Handel nutzen
Hauptmerkmale:
1. Sie können mehrere Sätze von Fibonacci-Retracements direkt zeichnen, und die Beziehung zwischen wichtigen Rückkehrpunkten ist auf einen Blick ersichtlich.
2. Kann Fibonacci-Erweiterungen zeichnen
3. Das Fibonacci-Foldback und die Verlängerung der Linie können nach links und nach rechts zu

Wir stellen Ihnen den technischen Indikator Fibo Channels Ultimate vor, ein leistungsstarkes Tool, das Ihre Fibonacci-Handelsstrategie revolutionieren soll. Mit seiner erweiterten Funktionalität zeichnet dieser Indikator automatisch alle vergangenen Fibonacci-Kanäle in Ihrem Diagramm ein und spart Ihnen so Zeit und Mühe. Was Fibo Channels Ultimate auszeichnet, sind seine außergewöhnlichen Anpassungsmöglichkeiten, die es professionellen Händlern ermöglichen, jedes gewünschte Fibonacci-Level z

Strategy Builder
Mit dem Strategy Builder -Indikator können Sie klassische und individuelle Strategien erstellen, ohne das Diagramm mit einer großen Anzahl von Indikatoren zu laden und ohne viele verschiedene Indikatoren zu verfolgen, um das wahre Signal zu identifizieren. Strategy Builder zeigt Signale in Form von Pfeilen auf 30 Standardindikatoren an, 23 Indikatoren zeigen klassische und versteckte Divergenz, Empfangen von Signalen von Fibonacci-Levels, horizontal, Trendlinien und Rechteck.

Introduction Professional traders use pivot points as support/resistance levels or as an indicator of a trend. Basically, a pivot point are areas at which the direction of price movement can possibly change. What makes pivot points so popular is their objectivity as they are recalculated each time the price moves further. The pivot points indicator implements 5 popular pivot points calculation and drawing: Standard – The most basic and popular type of the pivots, each point serve as an indica

Wir stellen den DFP Reconnoiter Ultimate vor, einen technischen Indikator, der speziell für Händler der täglichen Fibonacci-Pivot-Strategie entwickelt wurde. Dieser Indikator umfasst Standard-Fibonacci-Retracements, tägliche Pivot-Levels, Candlestick-Muster, ATR- und ADR-Levels, um Umkehr- und Ausstiegsbereiche zu identifizieren, was zu zeitlich gut abgestimmten Einstiegen führt. Wichtige Fibonacci-Retracement-Level von 38,2 %, 50,0 % oder 61,8 % werden in Verbindung mit dem täglichen ze

KT Auto Fibo draws Fibonacci retracement levels based on the ongoing trend direction. The Highs and Lows are automatically selected using the Maximum and Minimum points available on the chart. You can zoom in/out and scroll to adjust the Fibonacci levels accordingly.
Modes
Auto: It draws the Fibonacci levels automatically based on the chart area. Manual: It draws the Fibonacci levels only one time. After that, you can change the anchor points manually.
Usage: Helps to predict the future pr

MOVING AVERAGE BANDS / MA BANDS: This is an very simple Indicator but very powerful in identifying trend reversal.The calculation of moving Average bands consist of defining the range of bars and the multiplier we use. -To find range of n bars we used the values of moving average high and low values of n bars. -Then we used individual multiplier for individual bands. -The multiplier we defining can be based on your style say for example some needs moving average fibonacci bands or dynamic fibona

Most of those who trade in Forex are aware of the Elliott Wave Analysis System. So what is this wave analysis: This is the study and analysis of price, and not its derivatives (various indicators); The ability to determine price targets using Fibonacci tools (Elliott waves are closely related to Fibonacci numbers). You can get a clear picture of the market at all time scales; With EWA, it is possible to build a trading system with a clear description of the inputs and outputs. For simplicity, t

the zigzag indicator draws lines on the chart from the highest point to the lowest
There are built-in fibonacci levels
built-in sound alert
the indicator highlights trends on small timeframes with a thin line and trends highlights with a coarse line
Fibonacci levels can be turned on and off in the settings settings are very simple and clear
the same sound alert can be turned on and off, you can change the colors of the lines.

FairyFibo can generate as many as 70 different BUY signals and 70 different SELL signals solely based on Price Action and Fibonacci levels. The idea is to catch as many as Swing High's and Swing Low's but with the consideration of the current trend mind. This indicator can be also used for Binary Options Trading as most of the time price tends to follow the signal direction immediately. Most of the strategies are already optimized for different time frames and different market conditions. While

Basierend auf MACD-Indikatorwellen mit Standardparametern
Wendet Fibonacci-Werte auf die letzten beiden MACD-Wellen an, jeweils positiv und negativ,
wenn der MACD-Indikator im Moment keine negative Welle mehr hat - die Farbe ist grün,
wenn der MACD-Indikator im Moment keine positive Welle mehr hat - die Farbe ist rot.
Das Wave-Abschlusskriterium sind zwei Ticks mit unterschiedlichem MACD-Zeichen.
Wendet Trendlinien auf die letzten vier MACD-Wellen an. Arbeitet gut mit dem Experten zus

Dieser Indikator zeichnet Ebenen, die sehr "Adamant" und stark sind.
Diese Levels sind ein starkes Preisverwerfungslevel für ein Leben und werden niemals neu gestrichen.
Um alle meine Logikebenen in Ihr Handelssystem zu integrieren, sind 6-monatige Abonnements aller Logikebenen zum Preis von 1 Monat erhältlich.
Hoffe das wird hilfreich sein.
Haftungsausschluss: Wenn Sie nach einem schicken, farbenfrohen und auffälligen Indikator suchen, bleiben Sie bitte fern.
Kein Trader
Zunächst möchte ich mich bei Ihnen allen für den großen Erfolg von "Adamant Levels Logic A" bedanken.
Weitere Details zu Logik A finden Sie unter dem folgenden Link:
https://www.mql5.com/de/market/product/36082
Ich bin zuversichtlich, dass dieser Indikator "Adamant Levels Logic B" auch nach Ihrem Erfolg eine wichtige Rolle in Ihrem erfolgreichen Handelsträger spielen wird.
Einführung in Adamant Levels:
Haftungsausschluss: Wenn Sie nach einem schicken, farbenfrohen und auffäl
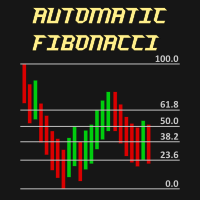
Automatic Fibonacci is an indicator for automatic Fibonacci Levels drawing. It is fully customizable by user. User can also select different Fibobonacci Levels by user settings or can use multiple Automatic Fibonacci indicator in one chart.
All details can be found >>HERE<<
Instructions Move Indicator to the chart (simply drag and drop) When pop up window appears select desired settings. Confirm settings and enjoy the Automatic Fibonacci indicator.
Features Any chart Any time-frame C
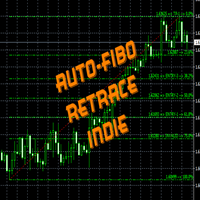
FiboRetrace Indie is a custom indicator created for those using Fibonacci indicator for trading. It enables the traders to use it independently and without limitations. This is created as an automated Fibonacci custom indicator that automatically plots itself when a trader attaches it to his chart, it will scan the chart and locate the recent trend direction either upward trend or downtrend and plot itself the way it should be. So there is no hassles looking for trend direction by the users, thi
Provides maximum revenue from trends.
You can receive signals from Zigzag, Front Fibonacci Retracement, Back Fibonacci Retracement and Stochastic Oscillator indicators. You can run these indicators in the background. It will give you a warning at the levels you set. You can change all levels from the settings. Designed to help you get the most out of trends. Fibo Level : 38.2 / 61.8 / 76.4 Stochastic : 20 / 80

After the purchase, the current year free indicator, please contact me for your version
As a bonus to the purchase, 3 months access to https://www.mql5.com/en/market/product/78772?source=Unknown%3Ahttps%3A%2F%2Fwww.mql5.com%2Fen%2Fmarket%2Fmy
Fibonacci retracement This indicator is based on use of Fibonacci retracement. I use Fibonacci levels for last year for important levels, where market stops and turns. These levels are important Price Action levels and market respect them. I do not us
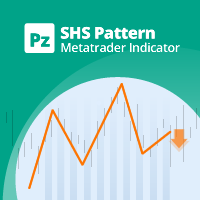
Ein Kopf-Schulter-Muster ist eine Diagrammformation, die einer Grundlinie mit drei Spitzen ähnelt, wobei die beiden äußeren in der Höhe nahe beieinander liegen und die mittlere am höchsten ist. Es prognostiziert eine zinsbullische Trendumkehr und gilt als eines der zuverlässigsten Trendumkehrmuster. Es ist eines von mehreren Topmustern, die mit unterschiedlicher Genauigkeit signalisieren, dass ein Trend sich seinem Ende nähert. [ Installationsanleitung | Update-Anleitung | Fehlerbehebung | FAQ
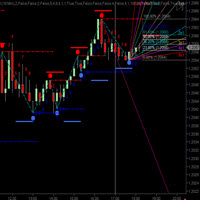
CycleTraderPro CycleWave Indicator besteht aus 9 Indikatoren in 1.
Es verwendet die CycleTraderPro-Indikatoren und -Muster, um Zyklen und mehr in Echtzeit zu identifizieren.
Die 9 Teile von CycleWave:
Zeichnet Cycle Bands und bestätigt Cycle High / Lows in Echtzeit nach jedem erfolgreichen Cycle-High oder -Low.
Diagramme Cycle Wave Price-Fenster über und unter jedem Balken mit einem geänderten% -Bereich des vorherigen Balkens.
Zeichnet das Fibonacci-Retracement automatisch

Golden Chip provides Basic Market Structure, Fibonacci, supply and Demand Zones. Letting you identify when a sell off point is approaching or whne a buy opportunity is arriving. The awesome thing about Golden Chip is that, you will see rejection levels or continuation before ANYBODY ! This indicator moves directly with price and lines up perfectly with the Chart. Some indicators would lag but NOT this one ! Golden Chip is amazing for Clean chart (Naked Chart). GOLDEN CHIP IS ONLY ON METATRADER (
Fibonacci ZigArcs MT4 Indicator A Signals filter with breakout + 3 S/R levels Zigzag tops and bottoms auto draw and update
the mt4 native fibonacci arcs.
The zigzag parameter can be changed by the user.
The Arcs color can be changed by the user.
This trend map provides the view of
the 360 fibo range with levels as filters and targets
To have this map around the price in a graph,
gives a safe trade, without get lost with trends,
or be trapped by false signals from indicators

The SuperZigZag indicator is a signal indicator that is used to form trend lines connecting the main peaks and bases on the price chart. It graphically displays the most significant reversals and kickbacks of the market. Also among the objectives of this tool - cutting off noise that interferes with the consideration of the most significant movements.
Unlike most other technical indicators, ZigZag does not predict the future behavior of prices, but only reflects their behavior in the past. But

DERZEIT 26% REDUZIERT!
Dieser Indikator ist eine super Kombination unserer beiden Hauptindikatoren ( Advanced Currency Strength 28 & Advanced Currency IMPULSE with ALERT ). Er zeigt Währungsstärkewerte für TICK-UNITS und Alarmsignale für 28 Forex-Paare an. Es können 11 verschiedene Tick-Units verwendet werden. Diese sind 1, 2, 3, 4, 5, 6, 10, 12, 15, 20, und 30 Sekunden. Der Tick-Unit-Balken im Unterfenster wird angezeigt und nach links verschoben, wenn mindestens 1 Tick innerhalb des Seku

Niubility RSI and Fibo The RSI will send an alert when the RSI value of the price gets to the level specified in the settings.
The input of the indicator can allow for change of RSI period, overbought and oversold.
The RSI will work for multi timeframe.
The RSI will scan different pairs.
This Fibo is designed to draw a Fibonacci retracement, using as a basis the ZigZag indicator.
Description:
'up' word means up trend.
'down' word means down trend.
' -- ' word means no trend

ZigZag with backlight Fibonacci levels. The indicator has the ability to set any number of levels, the signals of the intersection of which can be sent to your mobile device email, as well as viewed via alerts. The indicator is designed to perform wave analysis, search for harmonic petterns, as well as search for other technical analysis figures. The indicator is designed to work in the MetaTrader 4 terminal and is ported from the version for MetaTrader 5: https://www.mql5.com/en/market/product/

Ace Supply Demand Zone Indicator The concept of supply demand relies on the quantity mismatching between buying and selling volumes in the financial market. Supply and demand zone can provide the good entry and exit. A zone is easier to trade than a line. The supply demand zone can provide the detailed trading plan and the risk management. Its ability to predict market direction is high. There are two distinctive points about Ace Supply Demand Zone Indicator. Ace Supply Demand Zone indicator was

Support and Resistance is a very important reference for trading. This indicator provides customized support and resistance levels, automatic draw line and play music functions. In addition to the custom RS, the default RS includes Pivot Point, Fibonacci, integer Price, MA, Bollinger Bands. Pivot Point is a resistance and support system. It has been widely used at froex,stocks, futures, treasury bonds and indexes. It is an effective support resistance analysis system. Fibonacci also known as t

FIBO DASHBOARD This dashboard lists down multi currency Fibonacci level whenever price hit the level. It draws a Fibonacci Retracement based on daily time frame. It draws arrows, sends pop-up alert and phone notification whenever price crosses Fibonacci levels. This tool is useful for users who trade with Fibonacci. INPUT ON Alert: set to true will pop-up alert whenever arrow appears. ON Push: set to true will send phone notification whenever arrow appears. ON Email:set to true will send email

This indicator is for those trading Engulf Candles – Bearish and Bullish. It can also be used in conjunction with another trading system. What it does is that you can use it to measure a candle for a Risk Reward 1: 1 for an easily attainable target. When attached to a chart, it picks on any current candle on the chart but if you want to use it with another candle, you will have to change the ‘0’ default value for current candle in the parameter setting to any value to get the candle position beg

Launch promotion For a limited time only: 30$ instead of 157$ Summary Shows multiple Fibonacci retracements, projections and expansions ratios at a glance Description A Fibonacci confluence level is a price zone where Fibonacci retracements, projections and expansions meet closely when measuring a swing This technique is used by intermediate and advanced traders to detect possible reversal zones Tired of manually drawing the same Fibonacci ratios for the same X, A, B, C points to eventually f

Unser Ziel ist es, einen zugänglichen und qualitativ hochwertigen Service zu bieten und Marktteilnehmern, Händlern und Analysten gleichermaßen die dringend benötigten Werkzeuge für fundierte, zeitnahe Handelsentscheidungen zu ermöglichen.
Der optimierteste, äußerst robuste und benutzerfreundlichste DYJ-Trend-Analyst-Indikator.
Der DYJ Trend-Analyst versucht, bullische und bärische Kräfte auf dem Markt zu messen, indem er zwei separate Messgrößen verwendet, eine für jede Art von Richtungsdru

KT Round Numbers plots the round number levels which are also commonly known as psychological levels in the Forex world. In the context of Forex trading, round number levels are those levels in which there are two or more zeroes at the end. They are named as 00 levels on the chart.
Some traders also consider the halfway points as a valid round number level. They are named as 50 levels on the chart.
Use of round number levels in trading Round number levels work as strong support and resistan

Despite the popularity of inside bar pattern among the traders, using it as a standalone signal doesn't provide any edge in the market.
KT Inside Bar Advanced indicator solves this problem by combining the classic inside bar pattern with the "ECE" cycle and Fibonacci extensions. Using this indicator in place of our classic inside bar indicator will provide a tremendous advantage and edge in the market.
What is the ECE cycle?
In financial markets, the price never moves in a straight line bu
ZoneFinder is an indicator panel that presents an interactive, multi-timeframe visualisation of trend direction and strength. Trend strength and direction is measured using a modified ADX indicator based on smoothed DI+ and DI- values. High probability trading zones are identified using Fibonacci retracements. Where such zones are found, they are marked on the chart together with a proposed Fibonacci extension target.

mql5 version: https://www.mql5.com/en/market/product/44815 Simple indicator to calculate profit on fibonacci retracement levels with fixed lot size, or calculate lot size on fibonacci levels with fixed profit. Add to chart and move trend line to set the fibonacci retracement levels. Works similar as default fibonacci retracement line study in Metatrader. Inputs Fixed - select what value will be fix, lot or profit Fixed value - value that will be fix on all levels Levels - levels for which to ca
X Trendline X Trendline-indicator for determining the direction of the trend movement
The X Trendline indicator has its own unique formula for calculating the direction of price movement.
This indicator is suitable for both beginners and experienced traders.
The indicator can be used as an excellent filter for your trading system. You can also define where to enter and exit a position.
For those who want to use this indicator in their expert Advisor, there are three buffers from which

WOLFE WAVE PATTERNs First discovered by Bille Wolfe . The wolfe wave is a 5 wave price action pattern that is formed by supply and demand in a market and the fight to reach equilibrium in the market . The entry spot of the pattern is defined by the breakout of the trend created by wave 1 and wave 3 . This pattern forms in any market where there is supply and demand thus it can also be used to trade commodities and stocks. Wolfe Waves are reversal patterns that usually carry a low risk margin. P
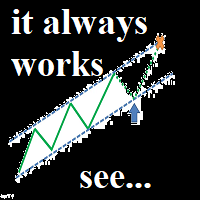
My new system... This is not a regular channel. Who is it for: - For people who want to understand the market. Tested and used in the real market (I use and not just encodes)
Important !!! The system requires thinking.
Only for real traders. If you are looking for a holy grail - please don't bother me.
Is it possible? Trading has never been so easy. A combination of fibonacci and an intelligent channel plus levels of support and resistance. Setting out a channel is now very easy.

This indicator provides the technical overview using following tools: Pivot Points Technical Indicators Moving Averages Pivot Points are calculated using five different methods: Classic Fibonacci Camarilla Woodie DeMark With the technical indicator , you can find the trading signals using the combination of different indicators. It supports the following technical indicators: RSI Stochastic Stochastic RSI MACD ADX CCI ATR Ultimate Oscillator ROC Bull/Bear Power Moving Averages is used to find th

Contact us for any custom order, CodeYourTrade.com .
This indicator is used to calculate the pivot points using 5 different methods: Classic Fibonacci Camarilla Woodie DeMark After you attached the indicator to a chart it will show the following information on the chart: Pivot points levels of the current chart using different methods. Indicator Setting Pivot Point Calculator Show Pivot Point Calculator: Show all pivot points on chart Pivot Points Timeframe: It tells which time is used to ca

Fibonacci indicator based on fractal.This software can automatically draw the golden section proportional line of two trend lines, and mark all the recent high and low prices.And the percentage value of volatility is a multi-cycle, multi-currency oscillation indicator.It is very effective for traders to find support and resistance lines and find entry and exit points near them.

Als Forex-Händler verstehen Sie den Wert der Fibonacci- Handelsstrategie in der technischen Analyse. Das manuelle Zeichnen und Anpassen der Fibonacci-Werte kann jedoch zeitaufwändig sein. Hier kommt der Fibonacci Of Yesterday Ultimate- Indikator ins Spiel. Er wurde speziell für Händler entwickelt, die die Fibonacci-Strategie basierend auf der Preisentwicklung des Vortages anwenden, wodurch Sie Zeit und Mühe sparen. Dieser innovative Indikator identifiziert automatisch Einstiegs-, Stop-Lo

TrendWavePattern an another way to trade with a harmonic pattern, a maestro classic pattern . I made some improvements and combinations with my own strategy. Trend direction, buy-sell signal ,hi-low area and pivot line. These will be helpful for trader to read the current market condition. So it is not blindly following the pattern itself but also following other informations from the market. Readable chart appearance . Designed to be user friendly even you are a new trader. BUY-SELL zone, Ta
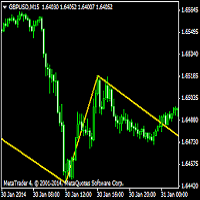
The Zig Zag indicator plots points on the chart whenever prices reverse by a percentage greater than a pre-chosen variable. Straight lines are then drawn, connecting these points. The indicator is used to help identify price trends. It eliminates random price fluctuations and attempts to show trend changes. L'indicateur Zig Zag peut être utilisé pour filtrer les mouvements de prix ... 1 Minute Indicators Used: RSI (30 / 70) Fibonacci (1 - 0.784)

Fibonacci fast drawing tool with 4 outstanding features 1. Quick action by clicking on the candle 2. Draw the bottom of the selection exactly 3. Include Standard Fibo levels and display prices at levels 4. Draw extended fibo to identify the price zone after break out
Please see video clip below for more details. Free download link of FiboCandleClick indicator inside youtube.

Pivots MT4 - Простой и удобный индикатор уровней pivot , рассчитывает уровни по методам Classic , Fibonacci , DeMark , Camarilla , WooDie , Central Pivot Range . Индикатор выгодно отличается следующим
Рассчитывает уровни pivot по методам Classic , Fibonacci , DeMark , Camarilla , WooDie , Central Pivot Range ; Выводит на графике текущие уровни и уровни на предыдущих периодах; Выводит на графике выбранные метод и период, названия уровней и их ценовые значения. Параметры Pivot Method - Вып

El Fibonacci automatico de Grupo Bazan Inversores, permite al usuario que lo utiliza, ver desplegado de manera automatica los niveles Fibonacci de los periodos que el mismo usuario haya seleccionado.
Esto permimte que el usuario no tenga que seleccionar el Fibonacci de la plataforma de metatrader 4 para colocar manualmente la figura, pudiendose concentrar exclusivamente en su analisis u operativa.
TrendRange Indicator works on M1, M5, M15, M30, H1 and H4 timeframes. It indicates real market trend, support and resistance levels. In other words, it confirms trade directions. Scalpers especially, Intraday, swing, intermediate and long term traders will especially find this indicator useful. It uses customized show/hide buttons namely: "DRAW", "HILO", and "LEVEL" lines crossings and histograms ("AWOS" for Awesome Oscillator, "BUBE" for Bull Power and Bear Power & "GATO" for Gator Oscilla

All in One package includes the Oscillator Predictor , MACD Predictor , Thrust Scanner and Advanced Fibonacci indicators which are mandatory for applying Dinapoli trade plans.
Please visit below links for detailed explanations of indicators. Advanced Fibonacci Indicator => https://www.mql5.com/en/market/product/52834 Thrust Scanner Indicator => https://www.mql5.com/en/market/product/52830 Overbought /Oversold Predictor indicator => https://www.mql5.com/en/market/product/52621
Macd

Introduction to Fibonacci Volatility Indicator Volatility indicator can help you to detect any statistical advantage for your trading. Especially, if you are trading with Price Action and Price Patterns, then we recommend to use the Volatility indicator together with your strategy. Especically, Fibonacci Volatility indicator combines the market volatiltiy with Fibonacci Analysis to provide you more advanced volatiltiy indicator. Main Features Fibonacci Volatility in Z score Configuration Mode Fi

The Squat is a function of the range of a given price bar and the volume, or TIC volume, that occurs while that range is being created. The basic idea is that high volume and little price movement indicate substantial support or resistance. The idea behind the approach to this indicator is to first look for likely Fibonacci support and resistance and then see if Squat manifests when that point is reached. The indicator determines one of the high probability patterns of DiNapoli. It does not re

The indicator is the advanced form of the MetaTrader 4 standard Fibonacci tool. It is unique and very reasonable for serious Fibonacci traders. Key Features Drawing of Fibonacci retracement and expansion levels in a few seconds by using hotkeys. Auto adjusting of retracement levels once the market makes new highs/lows. Ability to edit/remove any retracement & expansion levels on chart. Auto snap to exact high and low of bars while plotting on chart. Getting very clear charts even though many ret

FTU-Fibonacci
Dieser Indikator zieht Fib-Niveaus für Retracement-Niveaus aus der Preisaktion
Merkmale:
Mehrere Fibo-Stufen einstellbar Ändern Sie Farbe und Anzahl der Balken aus dem Bereich
2 Zeilen für 50-Balken-Verlauf, 2 Zeilen für 20-Balken-Verlauf, beide zeigen 38 und 61 Fib-Niveaus
Verwendung:
Der Zweck besteht darin, das Preis-Retracement zu untersuchen oder zu messen Ändern Sie die Farbe und die Anzahl der Balken aus dem Bereich. Verwenden Sie sie für jeden Zeitrahme
Automatically draws Fibonacci levels, basen on the last closed bar of the specified time frame. My #1 Utility : includes 65+ functions | Contact me if you have any questions helps to see potential reversal levels; patterns formed near the levels have more potential; significantly saves time spent on manual level plotting; Adjustable parameters:
The time frame used to plot the levels; Personalization of Fibonacci levels: main correction levels + extension levels; Line color, line width an

The falcon indicator works based on the innovative falcon strategy before me, as I used special numbers for the Moving Release indicator and the Bollinger Band, in addition to many indicators for filtering the signal, some numbers from the Nine Square and the Fibonacci numbers, where the results were impressive. We also have a free version for a month in the video description on Youtube download link Thanks

We know for sure that The Fibonacci sequence is a science used to calculate or estimate target distances.
How does this indicator work? 1. Tell the spread status 2. Tell me the current price 3. Indicate whether the candlestick status is bullish or bearish on each time frame. 4. Indicates the status of the past 2 candles 5. Tell Pivot Point 6. Tell the Fibonacci sequence. 7.The Fibonacci measurement can be set. 8. Pivot can be set backward. 9. Look at support and resistance.
Suitable for 1.

Chỉ báo tự động rút ra mức thoái lui fibonacci của tháng và năm. Draw from the same or under the same same or on the same of the tree before that. https://www.mql5.com/en/charts/12730171/audusd-pro-d1-axicorp-financial-services Màu đỏ là tháng fibonacci Màu vàng là tuần fibonacci White color is fibonacci date Red color is fibonacci month Yellow color is fibonacci tuần White color is fibonacci date Red color is fibonacci month Yellow color is fibonacci tuần White color is fibonacci date

Breakout Sniper draw trendlines by using improved fractals and plots the breakout and reversal points.
NO REPAINT AUTOMATED TRENDLINES MULTI TIMEFRAME
*** SINCE THE STRATEGY TESTER OF MT4 PALTFORM DOES NOR SUPPORT, YOU NEED TO TEST "CURRENT TIMEFRAME" INPUTS ONLY.*** A trendline is a line drawn over pivot highs or under pivot lows to show the prevailing direction of price . Trend lines are a visual representation of support and resistance in any time frame. They show direction and sp

Fibonacci Channel
What is a Fibonacci Channel? The Fibonacci channel is a technical analysis tool that is used to estimate support and resistance levels based on the Fibonacci numbers. It is a variation of the Fibonacci retracement tool, except with the channel the lines run diagonally rather than horizontally. It can be applied to both short-term and long-term trends, as well as to uptrend and downtrends. Lines are drawn at 23.6, 38.2, 50, 61.8, 78.6, 100, 161.8, 200, 261.8, 361.8 and 423.6

The IndicatorPivot indicator is suitable for using forex trading strategies designed for intraday trading. "IndicatorPivot" displays on the price chart of a currency pair the Pivot level (average price for the current day) and the three closest support and resistance levels, calculated based on Fibonacci levels. The "Indicator Pivot" indicator uses Fibonacci levels to solve the problem of building support and resistance levels in Forex trading. This indicator is very easy to understand and to ap

The reason why many traders new to using the Fibonacci retracement tool find it hard to effectively use it is because they are having trouble identifying swing points that are significant enough to be considered.
Main Features Show Fibonacci number with LL to HH in multitimeframe
Show 23.6,38.2,50,61.8,78.6,88.6,100,112.8,127.2,141.4,161.8,200,224,261.8,314,361.8 and 423 of Fibonacci number
Easy to use with simple interface. Real time information for the Fibonacci number .
Settings Global

This indicator watch the Fibonacci retracement for levels and timeframes selected by the trader. In the workload of day trading, having your eyes on all the timeframes to validate some information, for Fibonacci traders, is really time consuming and requires constant focus. With this in mind, this tool allows you to have your attention on other trading details while this one monitors the retracements of each timeframe in real time. In the charts, this indicator data (retracement %, age of the r
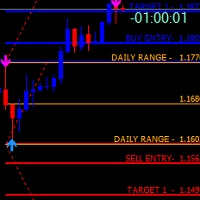
FiboZZ Trade Panel is trade assistants designed for manual trading and include account information panel with automatic drawing of ZigZag Extreme Arrows , Daily Fibonacci Extension with 3 levels for targets. You can use it with the following tow strategies or to use the indicators to create your own strategies. The information panel shows you: -Today and Yesterday Profits, -Balance, -Last Profit, -Last Open Lot Size, -All Open Buy/Sell Position and total lots , -Free Margin Level, -Equity, -24 h
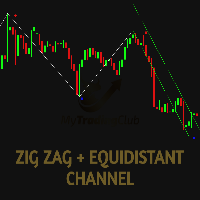
The MTC Equidistant Channel indicator is a helping tool for the traders who use: The supports and resistances lines; The trends; Fibonacci levels; It's a combination between the ZigZag indicator and the Equidistant chanel, It helps to detect the break-outs in many strategies and shows the possible entry points. The indicator capabilities : Drawing the Equidistant chanel automatically on the ZigZag indicator. The possibility of changing the ZigZag indicator settings. The indicator works on all ti
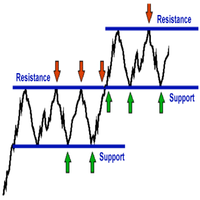
Are you tired of drawing Support & Resistance levels for all charts of the same Symbol while doing Multi-Timeframe analysis? Well, if you are a Price Action trader then this indicator will solve your problem. Draw on 1 Timeframe and it will auto-sync with other charts of the same Symbol. You can draw rectangles, lines, and eclipse. It will give an alert when touched/break on line. It work's on all Timeframes.
Major Update Added:: 1}triangle 2}Fibonacci Retracement 3}Text Lable 4}Up/Down Arrow

The indicator builds a graphical analysis based on the Fibonacci theory.
Fibo Fan is used for the analysis of the impulses and corrections of the movement.
Reversal lines (2 lines at the base of the Fibonacci fan) are used to analyze the direction of movements.
The indicator displays the of 4 the target line in each direction.
The indicator takes into account market volatility.
If the price is above the reversal lines, it makes sense to consider buying, if lower, then selling.
You can op

Fibonacci calculator is used with Elliot Waves, it can generate remarkable results. A trader could use these levels or ratios to find high probability trades with very small stop loss. You may also use these ratios to find Elliott Waves extensions and to book profit near those levels. For Elliot Wave experts, Fibonacci calculator is a highly useful tool that can assist them in calculating Fibonacci extension and retracement levels for the market price. The indicator proves itself as a useful one
Der MetaTrader Market ist die beste Plattform für den Verkauf von Handelsroboter und technischen Indikatoren.
Sie brauchen nur ein gefragtes Programm für die MetaTrader Plattform schreiben und schön gestalten sowie eine Beschreibung hinzufügen. Wir helfen Ihnen, das Produkt im Market Service zu veröffentlichen, wo Millionen von MetaTrader Benutzern es kaufen können. Konzentrieren Sie sich auf dem Wesentlichen - schreiben Sie Programme für Autotrading.
Sie verpassen Handelsmöglichkeiten:
- Freie Handelsapplikationen
- Über 8.000 Signale zum Kopieren
- Wirtschaftsnachrichten für die Lage an den Finanzmärkte
Registrierung
Einloggen
Wenn Sie kein Benutzerkonto haben, registrieren Sie sich
Erlauben Sie die Verwendung von Cookies, um sich auf der Website MQL5.com anzumelden.
Bitte aktivieren Sie die notwendige Einstellung in Ihrem Browser, da Sie sich sonst nicht einloggen können.