Can should should show lines and arrows when conditions meet .
The goal of the Trend Line Theory strategy is to find out if a breakout is valid by evaluating:
a) The trend
b) The number of pullback - swings
c) The relative swing length
d) The swing retracement percentage
To do that, let’s see how we can use trendlines to target the end of a retracement and enter in the direction of the larger trend.
The basic logic in price action analysis is that the stronger a move is the more likely the price will continue to move in that direction.
The same holds true of pullbacks during a trend.
The stronger a pullback is the more likely it is that it will turn into a full blown reversal at the end. And, conversely, the weaker a pullback is the more likely it will be just a retracement and the more likely that the original trend will resume.
And this is where John Hill’s Trend Line Theory will help us, namely in determining the strength or weakness of a pullback.
Note that in order to use this strategy there needs to be what John calls a complex pullback, which is just a pullback with at least 3 swings in it.
In essence, the strategy consists of drawing two trendlines and then analyzing how they interact with each other and with price.
Those 2 trendlines are the 0-2 and the 0-4 line, as John calls them.
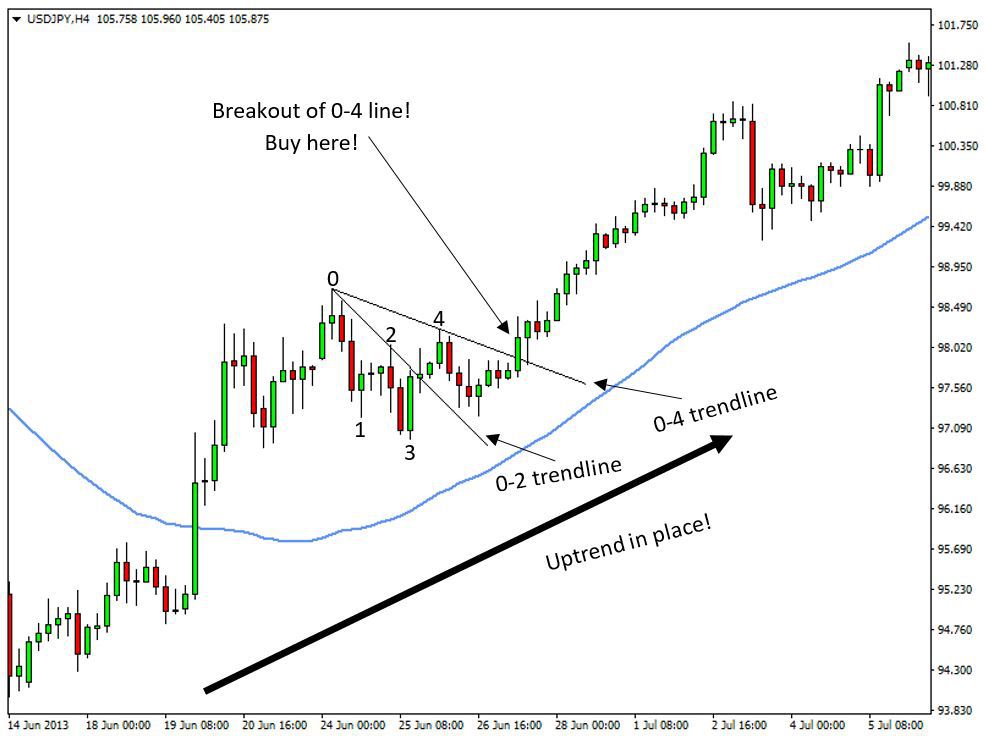
• Point 0 is always the starting point of the pullback. So, that would be the high in an uptrend and the low in a downtrend.
• Point 1 is the ending point of the first swing inside of the pullback.
• Point 2 is the ending point of the second swing inside of the pullback.
• Point 3 is the ending point of the third swing inside of the pullback.
• Point 4 is the ending point of the fourth swing inside of the pullback.
Now, to get the 0-2 and 0-4 line all we need to do is connect the respective points inside of the pullback. It doesn’t matter which swing point is higher or lower, just connect the 0-2 and the 0-4 points.
So, after drawing the two lines we can get a sense of the strength of the pullback by analyzing the trendlines.
If line 0-4 is steeper then the pullback has momentum and may turn into a complete reversal of the larger trend. Don’t enter on the breakout of line 0-4.
If line 0-2 is steeper then the pullback is weak and the larger trend is more likely to resume. Enter on the breakout of the 0-4 line in the direction of the larger trend.
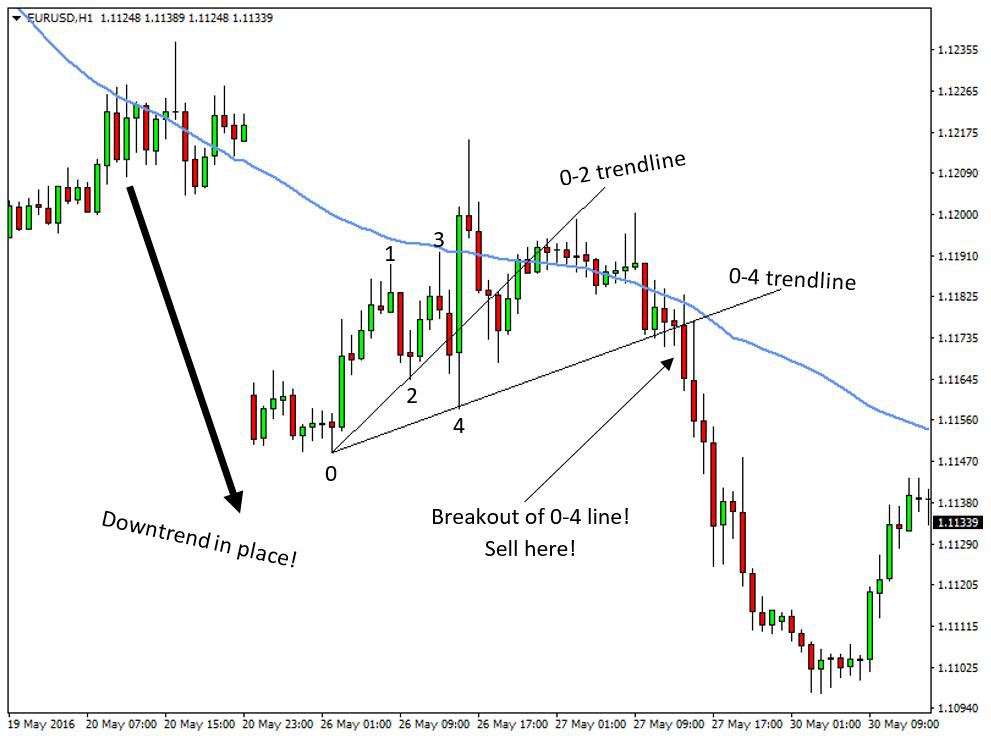
Let’s look at a few examples so that you can better understand this strategy. First an example of the trendline theory in a downtrend on the EUR/USD pair.
To determine the trend on this chart, we are using a 50-period simple moving average represented with the blue line. The price is clearly below of the MA for most of the time and the MA is sloping down indicating strength of the larger trend.
• The start of the pullback is the swing low of the initial down move on the left and it’s marked with the number 0 on the chart.
• In line with John Hill’s trend line theory, the first swing high inside of the pullback is marked with number 1 on the chart
• The first swing low inside of the pullback is marked with number 2 on the chart
• The second swing high inside of the pullback is marked with number 3 on the chart
• The second swing low inside of the pullback is marked with number 4 on the chart
Ähnliche Aufträge
Hi, I would like to commission an Expert Advisor (EA) for MetaTrader 5 (MT5) based on the Smart Money Concepts (LuxAlgo) indicator, which is available in the MQL5 Market. Below are the detailed specifications for the EA: 1. General Parameters & Symbol Trading Asset: Gold (XAUUSD) Timeframe: 5-Minute (M5) Indicator Integration: Integration with "Smart Money Concepts (LuxAlgo - Smart Money Concepts)" via
i have indicator for Trading View, also copy for NT, i need someone to improve and check the NT version (indicator is simple is volume density koncept)…. when i put same settings on TV version and NT version i have diffrerent results, but this can be because diffrent market data or fact that TV sending tick info in blocks , not tick by tick like NT8 on both. I(ndicator base on counting volume) so besied that is it
Please may someone assist me with the indicator attached, it has a SERIOUS BUG issue in the sense that when I load it, and activate the template (attached as well) MT4 ALWAYS freezes and then eventually disconnects automatically, ALL THE TIME. It even gets worse to an extent that after disconnecting a number of times mt4 ends up not loading anymore, UNTIL I remove the indicator. Please I WILL NEED A DEMO (FOR A DAY)
A trending candle followed by a smaller trending candle which is the second candle with no 5EMA The 3rd candle is a reversal candle in which it and it's immidiate previous candle must be at least 70% of each other's body or equal body, with no 5EMA touch the 3rd candle candle is followed immediately by the 4th candle which is the signal candle in which it and the 1st cabdle must be also at least 70% of
An mt5 add on indicator like gainalgo style to show entrance and exit areas for gold silver and Btc scalping. It will be used to make trading more easy for beginners
I have the Fisher Indicator shown below the chart. I need an alert added for when the Fisher Indicator hits the 50 point at the end of each period. GBPUSD and EURUSD 4H charts are provided and I can provide additional
Hello here, I need someone who can work on pinescript and also with Renko charts. My entries for my strategy would be based on stop orders Kindly let me know if you can work on this for me and i will send necessary file and quote in the chat
Freelance Task — EA Recovery Layer Hello. I have a ready-made MQL5 EA. The signals, SL/TP and lot calculation should essentially not be touched. I need a recovery system added. I am not a programmer — below is how the robot should behave. What stays Entry only from an EA signal. Stop-loss is not a new signal. Trailing is already built into my EA — recovery does not implement its own trailing. If trailing is disabled
# SNRZ BOT — SESSION PROGRESS LOG Last updated: 2026-09-16 (local late-evening session) ## SAN BOT (new — cloned from SNRZ) - `MQL5\Experts\AutomatedOrderBot_SAN.mq5` / `.ex5` — v1.0, compiled 0 errors/0 warnings - Signal source: custom indicator "SAN" (InpSANName, buy buf 0 / sell buf 1, target bar 1), same SNRZ-style read, MA fallback if missing - Magic number 234567 (separate from SNRZ 123456 so both bots can run
Should be as it but no alarms, also we need to add a deep search so he can see all the preves candles and a memory function so its not slowing down the indicator. for higher time frames daily 4h 1h around 365 days and for lower time frames we do up to 20k bars but both flexible so i can change it later. the memory is important so the indicator is not always recalculating everything when a new candle shows especially
 Alle Aufträge
 Regeln