Nguyen Thanh Trieu
Nguyen Thanh Trieu
  • Software Developer - Algorithmic Trading 在 Independent Trading Tools Developer
  • 越南
  • 14703
4.7 (29)
  • 信息
1 年
经验
20
产品
11
演示版
3
工作
0
信号
0
订阅者
Software Developer - Algorithmic Trading 在 Independent Trading Tools Developer
我是一名软件开发者,也是一名交易员。我为 MetaTrader 5 开发实用的交易工具,这些工具我自己每天也在用。

方向主要包括市场结构、价格行为逻辑、风险可视化,以及各类自定义指标和实用工具。

我看重干净的代码、稳定的执行和清晰的图表。每款产品只解决一个具体问题,不承诺收益。

我始终认为,工具的作用是帮你更快看清行情、做出判断,而不是替你做决定。

所有产品都由我本人独立开发、测试和维护。如果你有自己的交易想法,或需要定制开发,欢迎私信我聊聊。
Nguyen Thanh Trieu 已发布产品

Candle Strength Momentum 是一款适用于 MT5 的振荡指标,通过两条独立曲线显示每根 K 线的买入压力和卖出压力,并按 Tick 成交量加权。它适合阅读价格行为、希望比较当前 K 线买卖双方力量,而不想在图表上叠加多个指标的交易者。 与多数对历史价格取平均的振荡指标不同,本指标单独评估每根 K 线:收盘价在区间中的位置、实体大小,以及相对前一根收盘价的移动幅度。结果是两条 0 至 100 的曲线:买入压力(青色)和卖出压力(红色),并提供可选的图表工具。 主要功能 功能 作用 图表显示 压力曲线 按 Tick 成交量和趋势因子加权,分别计算每根 K 线的买入和卖出得分。 独立窗口中的 Buy、Sell 曲线,以及 Buy、Sell、Delta 数值和斜率箭头。 Power Cloud 比较指定数量 K 线的平滑买入压力和卖出压力。 主图 K 线背景着色;颜色表示占优方向,透明度表示 Delta,并提供三种反应速度。 方向标签 使用可编辑阈值(默认 15 和 5)将 Delta 分为 STRONG、WEAK 或 NEUTRAL。 显示百分比和当前 K

Nguyen Thanh Trieu
Nguyen Thanh Trieu
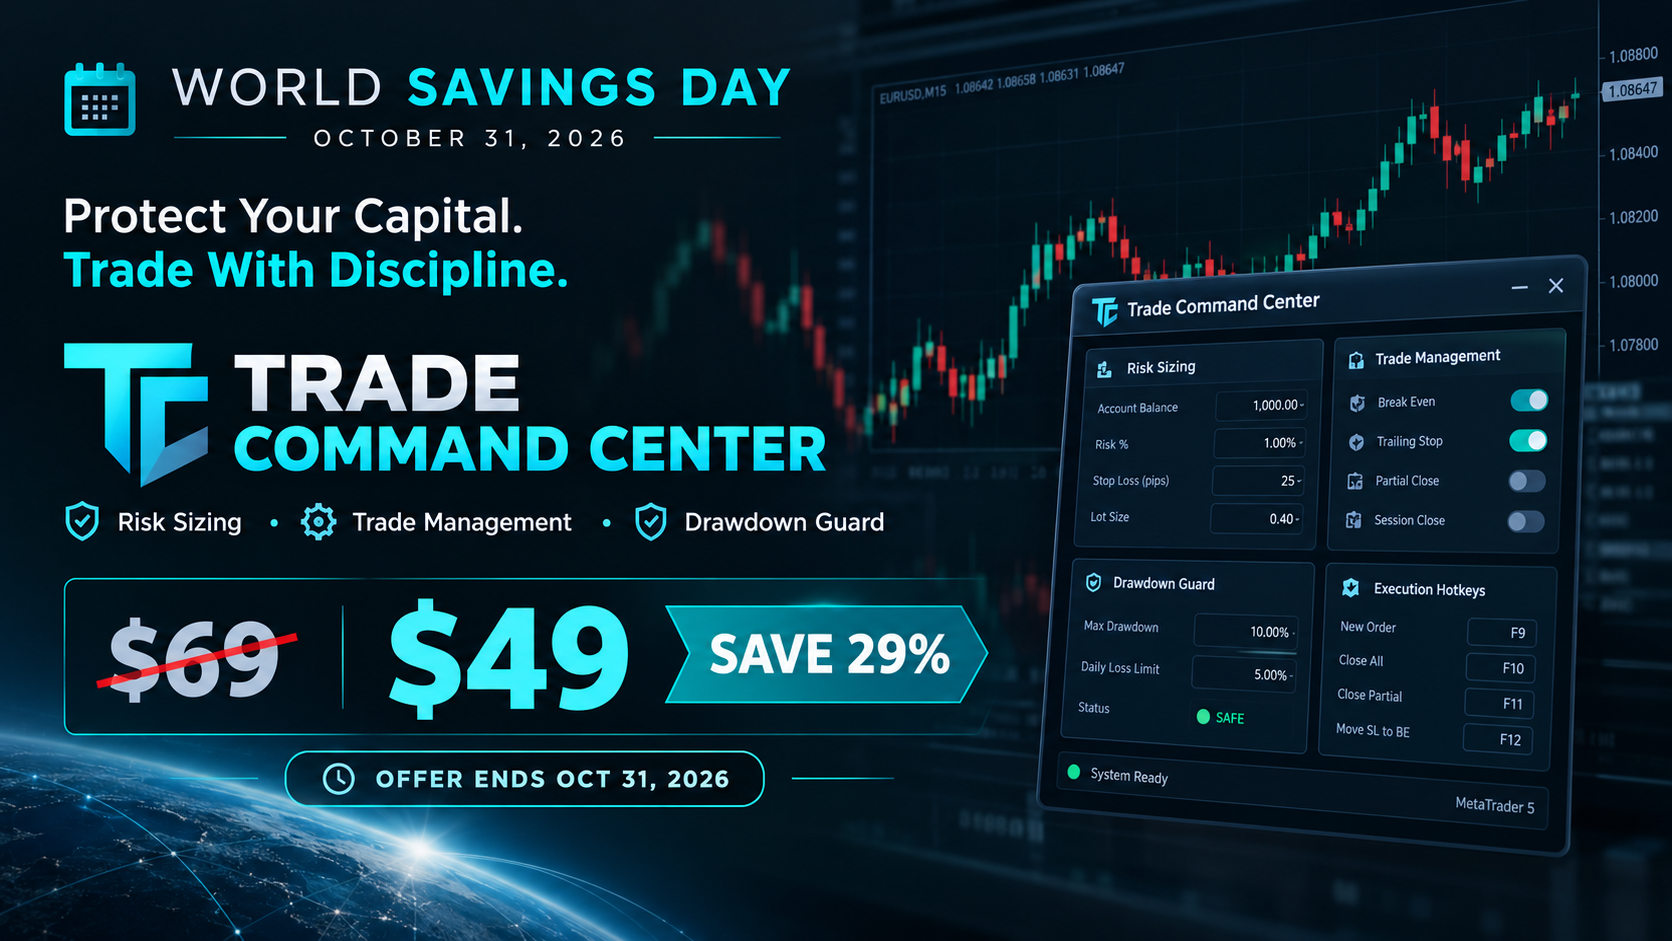
🌍 **World Savings Day: Protect Your Capital for $49**

A trader's first responsibility is not to make more money. It's to manage risk before pressing Buy or Sell. 🎯

Every trader knows the feeling.

You find a setup. The market starts moving. You rush to calculate your lot size, adjust your stop loss, or manage an open position. One small mistake can turn a well-planned trade into an avoidable loss. ⚠️

And when you're trading under strict prop firm drawdown limits, a single bad decision can cost you far more than one trade.

That's why this World Savings Day, I want to focus on something every trader should value: **capital preservation and disciplined execution.** 🛡️

💰 **Special Offer: $49 Instead of $69**

For a limited time, Trade Command Center for MetaTrader 5 will be available for **$49 instead of $69**, saving you $20.

📅 The offer runs through **October 31, 2026**.

⚙️ **What Can Trade Command Center Help You With?**

✅ Risk-based lot size calculation directly on the chart.

✅ One-click trade execution and customizable hotkeys.

✅ Break-even, partial take-profit and trailing-stop management.

✅ Daily loss limits, drawdown monitoring and exposure controls.

✅ Trade management tools for manual traders and prop firm challenges.

No tool can eliminate market risk or guarantee trading results. You still make the decisions. The goal is to help you execute your plan more consistently and reduce avoidable operational mistakes.

Remember: **Your next winning trade is never guaranteed. Your risk management process is something you can prepare in advance.** 🧠

This World Savings Day, invest in a more disciplined trading process. Protect your capital. Respect your rules. Trade with a plan.

🔥 **Special Price: $49 until October 31, 2026.**

👉 Get Trade Command Center on the MQL5 Market:
https://www.mql5.com/en/market/product/164935
Nguyen Thanh Trieu 已发布产品

Trading in volatile markets often creates uncertainty between genuine trend continuation and false breakouts. When price moves quickly, monitoring multiple standard deviation bands manually can clutter execution timing. Double Bollinger Bands Channel Alert provides a structured two-band framework to identify trend momentum zones and pullback continuation levels with clarity. What it shows: Outer Bands (Deviation 2.0) = Volatility boundaries highlighting strong trend expansion. Inner Bands

Nguyen Thanh Trieu 已发布产品

在没有成交量数据的情况下交易会使您对市场的衰竭视而不见。价格趋势可能看起来很强,但底层成交量往往在反转前就已经干涸。 CSO Volume Delta 绘制了看涨和看跌分笔成交量的净差值。它以EMA为基准,打印出清晰的直方图。您可以看到买盘在阻力位何时衰退,或者卖盘在支撑位何时消亡。 该工具提供了对市场参与度的直接解读,帮您避免在趋势末期入场。 这是一个独立的工具,也是 Candle Strength Oscillator 完整版的免费配套工具。 工作原理 成交量基准线: 使用动态EMA过滤正常的市场噪音。 方向直方图: 绿柱显示多余的买入量。红柱显示多余的卖出量。 反转信号: 当差值达到极端阈值时,在直方图上绘制箭头。 需要完整的动能指标套装吗? 在此查看 Candle Strength Oscillator 主指标 。

Nguyen Thanh Trieu 已发布产品

Candle Strength Momentum 是一款 MT5 振荡指标,以两条独立的线显示每根 K 线的买入压力和卖出压力,并按 tick 成交量加权。 大多数振荡指标是对过去的价格取平均。本指标则对每根 K 线单独评分:收盘位置在其波动区间中的哪个位置、实体有多大,以及相对上一根收盘价的变动幅度。您无需在图表上叠加多个指标,就能比较当前 K 线上买方和卖方的力量。 线条的计算方式 每根 K 线都会得到一个买入分数和一个卖出分数。两者都按该 K 线的 tick 成交量相对于近期平均值进行加权,再由趋势因子调整。趋势因子默认使用 ADX,也可选择 EMA 斜率或 OBV。最终得到两条 0 到 100 的线:Buy Pressure(青色)和 Sell Pressure(红色)。 如何解读 Buy 在 Sell 之上,表示该 K 线上买方占优;Sell 在 Buy 之上,表示卖方占优。 两线之间的差距就是 Delta。方向标签会根据可自行修改的 Delta 阈值(默认 15 和 5)显示 STRONG、WEAK 或 NEUTRAL。 差距收窄表示压力减弱,差距扩大表示压力增强。

Nguyen Thanh Trieu 已发布产品

在快速波动的市场中,价格极值点(High/Low)通常构成关键的执行边界,手动下单与止损调整往往存在显著的延迟。 The Overseer 作为一个持续的多时间框架监控系统,能够自动计算基于波动率调整的极值水平,并精确管理挂单与持仓。 "全天候持续守护。设定您的参数,让严谨的逻辑在 24/5 市场中守护您的执行。" 系统监控内容 本系统在多个时间框架下持续扫描市场状况: 价格极值 (Price Extrema): 识别在可配置 K 线周期(H3、M1、D1 等)内的最高价与最低价。 波动率 (ATR): 利用 M15 或指定周期上的 ATR 指标值计算动态挂单间距。 趋势方向 (Trend Direction): 评估 H4、H6、H12、D1、W1 和 MN1 上的多时间框架方向一致性。 点差与时间过滤: 实时监控点差是否超过上限,并执行服务器时间交易窗口限制。 触发时的执行逻辑 当市场状况符合配置规则时: 挂单执行: 在距离极值点基于波动率调整的位置自动摆放或修改 BuyStop 与 SellStop 挂单。 持仓保护: 当达到预设盈利目标时自动触发保本止损

Nguyen Thanh Trieu
Nguyen Thanh Trieu
Trade Command Center is Leveling Up - And You're Going to Love This ❤️

Hey Trader,

If you've ever:

😤 Closed a trade too early because you couldn't watch the screen all day...

😴 Woke up to a blown stop because the market moved while you were asleep...

😰 Stared at your charts for hours at a specific time just to open or close a position...

📉 Missed a perfect setup because you had to step away for lunch, a meeting, or just 10 minutes of fresh air...

Then the next update of Trade Command Center is built especially for you.

________________________________

⏰ Let Time Work FOR You
Imagine this: You set your trading session hours - say 9:00 AM to 5:00 PM. Then you walk away.

Trade Command Center now has a built-in Time Manager that:
- Opens positions automatically when a new session starts
- Closes everything when the session ends - so you're never left holding a trade at 2 AM
- Cancels pending orders that have been waiting too long
- Respects your timezone, your schedule, your life

No more "I forgot to close before dinner." No more "I'll just take a quick nap" that turns into 3 hours. No more babysitting.

This isn't just a feature. It's peace of mind.

________________________________

What Else is Coming?

More ways to protect your profits:
- New trailing stop styles - let the market tell you where to trail, not a random guess
- Virtual SL/TP - hide your real stops from brokers who hunt them
- 10 partial profit levels - not just 5. More room to breathe.

More ways to manage risk:
- New risk modes - % Equity, % Free Margin, and more ways to calculate your lot size
- Lot limit - set a cap on how much you're willing to risk total

More control, less effort:
- 25+ hotkeys for the pros who love speed
- Position menu - right-click any trade for options like "Close 50%", "Trail Me", "Breakeven Now"
- Screenshots that save your trade data automatically

And for our global family:
- 10 languages - because trading has no borders

________________________________

From One Trader to Another

We built Trade Command Center to make your trading life easier.

Not flashier. Not more complicated. Just easier.

Every feature in this update was chosen because we've been there. We know the feeling of watching P/L slowly evaporate because we couldn't act in time. We know the frustration of setting alarms at 3 AM just to close a trade.

This update is for the trader who wants to trade better - and sleep better.

Stay tuned. Launch date coming soon.

Your charts will thank you 🎯

- The Trade Command Center Team

👉 https://www.mql5.com/en/market/product/164935
Nguyen Thanh Trieu
Nguyen Thanh Trieu
Hello traders,

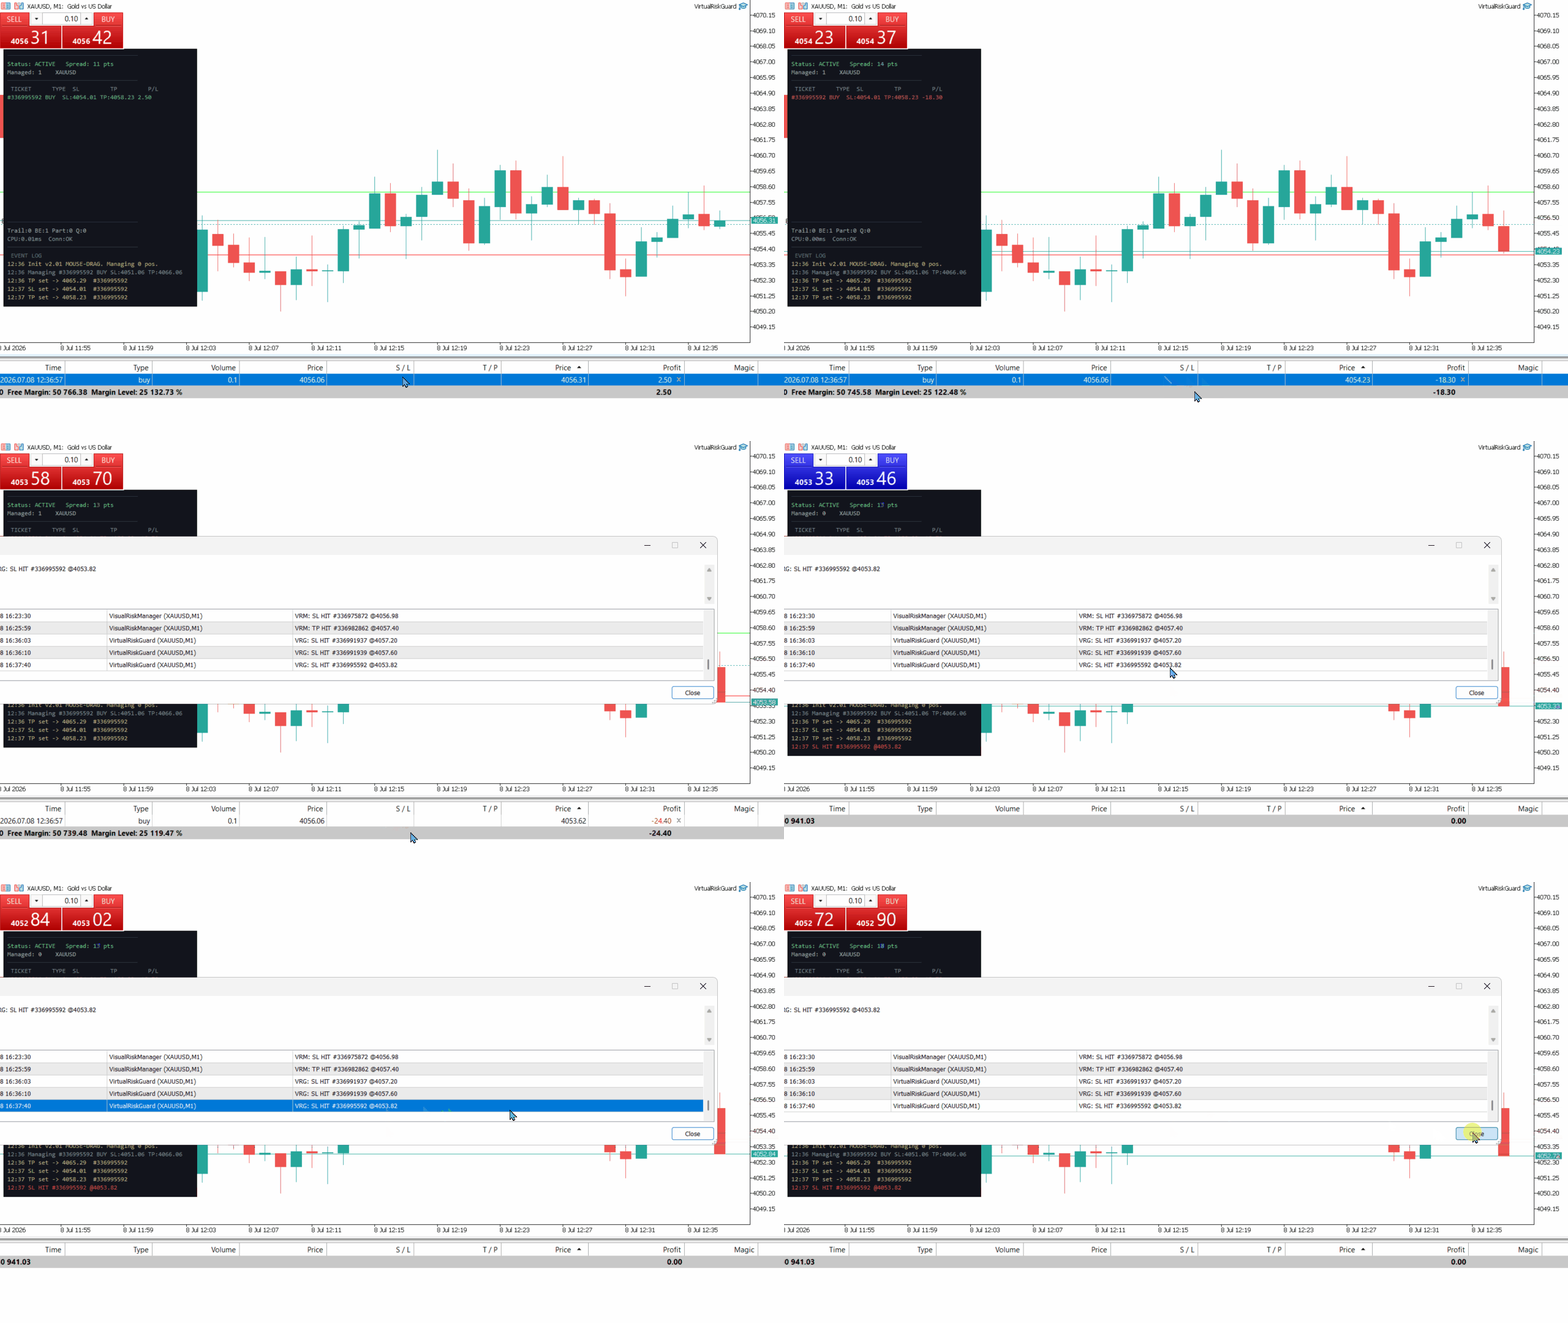
I'm excited to announce the release of Virtual Risk Guard — a professional client-side risk management utility for MetaTrader 5.

When your SL and TP levels are placed openly on the broker's server, they are completely visible and highly vulnerable to stop hunts or artificial spread widening during volatile sessions. Virtual Risk Guard eliminates this exposure by keeping your exit levels purely internal in terminal RAM and executing instant market close orders only when the exact price threshold is reached.

Key Features & Architecture:

1. Interactive Chart Control (True Mouse-Drag)

Seamless Management: Effortlessly adjust your hidden SL/TP levels directly on the chart using standard mouse drag-and-drop.
Smart Hover & UI States: Features interactive line highlighting, automatic chart-scroll locking during active drags, and real-time floating price tags.


2. Multi-Dimension Risk Sizing

Flexible calculation modes to define your virtual distances based on: Points, Pips, Exact Price, ATR Multipliers, Risk % of Balance, or fixed Dollar Amounts.


3. Advanced Multi-Stage Exits

Staged Partial Closes: 3 customizable partial close stages to lock in profits early.
4-Tier TP Ladder: Advanced scale-out matrix with integrated automatic Breakeven triggers per tier.
Smart Breakeven: Protect capital with fully adjustable trigger distances and point offsets.
5 Trailing Stop Modes: Choose between Fixed, ATR-based, Percent, Step, or Continuous trailing.


4. Bulletproof Fail-Safe Filters

Spread Guard: Prevents premature or unwanted triggers caused by malicious or sudden spread spikes.
News Lockout & Session Filters: Restrict execution or safe-keep positions during high-impact news windows or specific sessions including Asian, London, NY, or Custom hours.
High-Frequency Execution: Built-in automatic retry loop with millisecond delay processing and a dedicated emergency bypass mode.


Technical Specifications:

100% Invisible to Brokers: All protection lines are calculated locally on your side.
Real-Time On-Chart Dashboard: Monitor active tickets, floating P/L, terminal connection status, and precise CPU execution latency.
Live Event Logger: An embedded on-chart event log keeps you updated on every background script action.
Omni-Channel Alerts: Instant alerts via terminal Popups, Sounds, Mobile Push notifications, and Emails.
Universal Compatibility: Filter by current symbol only or manage positions globally across your account.


Currently available at a special launch price.

The price will increase as new features are added in future updates.

Product page:

https://www.mql5.com/en/market/product/184826

Thank you for your time, and feel free to ask any questions or drop your feature requests below!
Nguyen Thanh Trieu
Nguyen Thanh Trieu
Hello traders,

I'm excited to announce the release of Gold Entropy Confluence Matrix —
a professional confluence indicator for MetaTrader 5.

Unlike single-strategy indicators that rely on one signal source, this
tool combines 8 independent analytical modules into a unified confluence
score (0–100%). A signal is only generated when multiple engines agree
simultaneously, dramatically reducing false positives.

Architecture overview:

Layer 1 — Raw Indicators
→ Information Entropy, Hurst Exponent, Momentum, Volatility Regime

Layer 2 — Sub-Signal Evaluation
→ Entropy/Regime/Trend/Momentum/Volatility signals evaluated

Layer 3 — Confluence Scoring
→ Weighted score from all sub-signals (0–100%)

Layer 4 — Final Signal Decision
→ Arrow signals fire only at 9/9 validation

Technical specifications:
• Zero repainting — all calculations on confirmed (closed) bars
• No lookahead — no future data used
• Works on all symbols — XAUUSD, BTCUSD, US30, forex pairs, indices
• 3 signal modes — Conservative / Balanced / Aggressive
• Full dashboard with real-time component breakdown
• Smart alert system — popup, sound, push notifications
• Chart on/off toggle via hotkey

Currently available at a special launch price.
The price will increase as new features are added in future updates.

Product page:
https://www.mql5.com/en/market/product/184589

Thank you for your time, and feel free to ask any questions.
Nguyen Thanh Trieu
Install PropFirm Risk Guard Demo Download Trial version: PropFirm Risk Guard Demo MT5 3.51 - download PropFirm Risk Guard Full Version - purchase on MQL5 Market Important Notice: This Trial version provides 100% full trading functionality, but it is restricted to Demo/Contest accounts only...
Nguyen Thanh Trieu 已发布产品

Session Box And Timer 日内交易需要监控各大交易时段之间的过渡,然而手动重叠时间表容易出现计算错误。若没有清晰的标记,前一时段的关键价格水平和流动性区域很容易被忽略。 Session Box And Timer 直接在您的图表上直观显示交易时段、波动趋势和倒计时器。 它显示什么: - 时段框(Session Boxes): 代表亚洲、伦敦和纽约时段的彩色矩形,标签中会显示自动计算的点数范围(pip range)。 - 亚洲时段区间水平: 亚洲时段最高价和最低价的投影向右延伸为水平线,作为日内突破的参考。 - 前一日最高价/最低价 (PDH/PDL): 标记前一天最高和最低边界 landlords 的虚线水平线。 - 时段周期线和倒计时标签: 在即将开盘的时段画出垂直线,显示距离下一时段开盘的精确剩余倒计时时间(时:分:秒)。 - 波动率热力图 (Volatility Heatmap): 图表底部的连续多色块状指标,显示过去20天的历史每小时波动率。 - 仪表板面板 (Dashboard Panel):

Nguyen Thanh Trieu 已发布产品

Confluence Bias Map 将关键的市场指标整合为一个单一的实时评分,以支持您的交易分析。 在分析图表时,单独查看多个独立的指标(均线、MACD、ADX、RSI、Stochastic、布林带、MFI、ATR)往往会导致信号冲突和决策瘫痪。在没有结构化方法的情况下,对比不同时间框架的趋势、动能、波动率和成交量很难定义真实的市场偏向。 Confluence Bias Map 通过将这 4 个核心市场维度跨 3 个时间框架整合为一个单一的实时评分,解决了这一问题。 它显示的内容: 圆环仪表盘 (Donut Gauge): 在仪表盘中心显示 0 到 100 的综合汇聚评分 (Confluence Score)。 类别拆解: 显示趋势(基于 EMA、MACD、ADX)、动能(基于 RSI、Stochastic)、波动率(基于布林带)和成交量(基于 MFI)的各自平均评分。 时间框架扫描: 显示 3 个时间框架的独立评分和实时进度条:当前图表周期以及两个更高周期(例如 M15、M30、H1)。 历史实证: 直接在面板上计算并显示信号触发(评分 >= 75 或 <= 25 在

123