|
no
esperienza
|
23
prodotti
|
7
versioni demo
|
|
3
lavori
|
0
segnali
|
0
iscritti
|
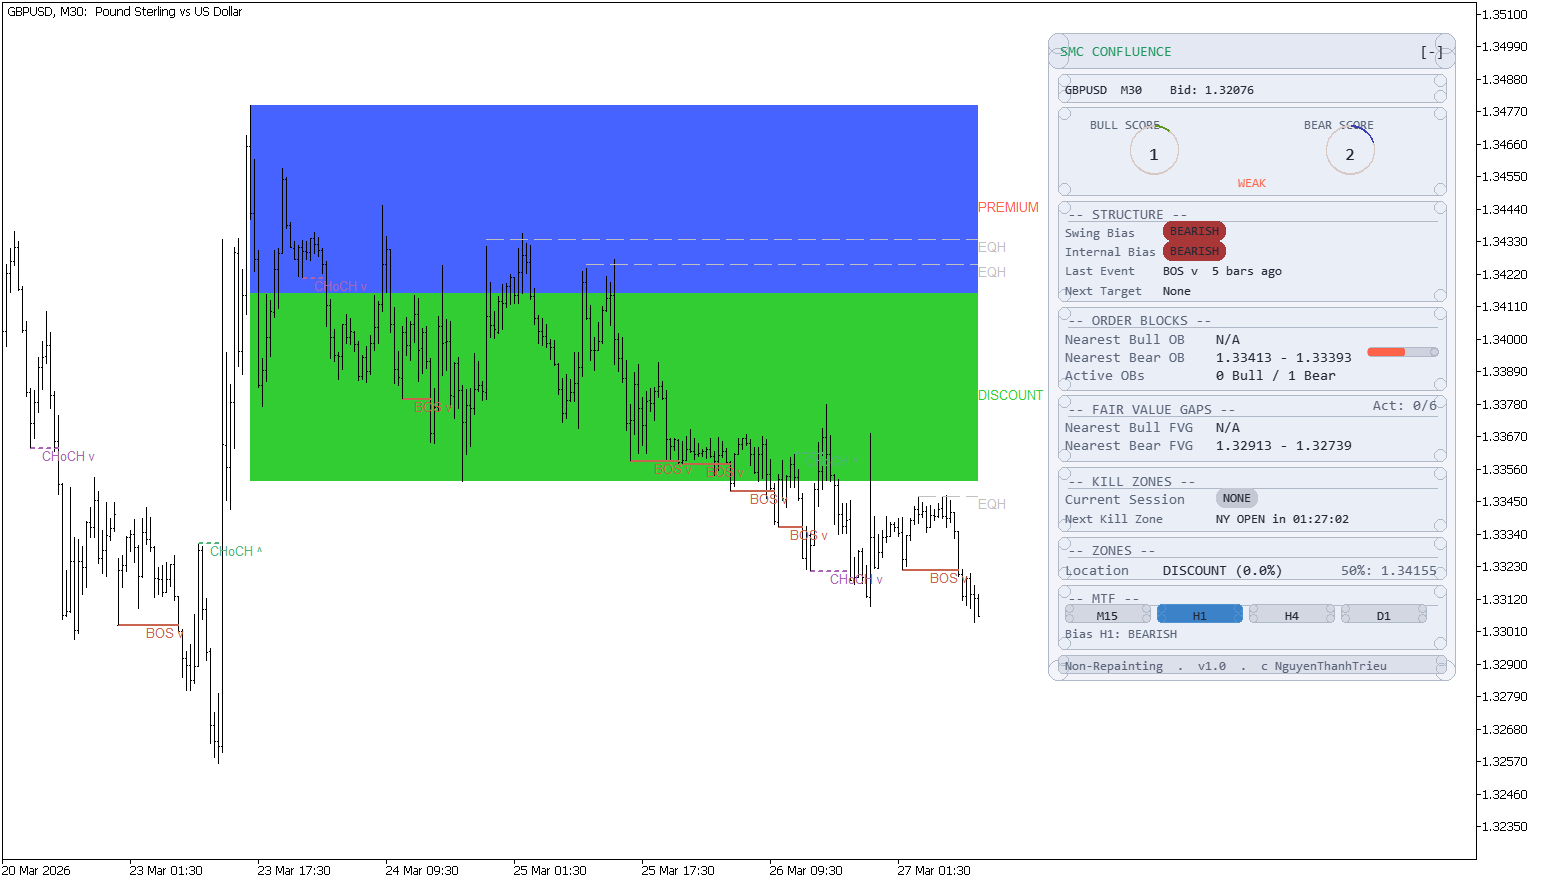
I am a software developer and trader focused on building practical trading tools for MetaTrader 5.
My work is centered on:
- Market structure analysis
- Price action logic
- Risk visualization
- Custom indicators and utilities
I prioritize code quality, execution stability, and clear visual presentation.
Each product is designed to solve a specific trading problem, not to promise results.
I believe trading tools should support decision-making, not replace it.
All products are developed, tested, and maintained personally.
I am also available for freelance custom projects. If you have a specific trading idea or need a tailored solution, feel free to message me to discuss how we can work together.