Nguyen Thanh Trieu / 个人资料
- 信息
|
不
经验
|
22
产品
|
9
演示版
|
|
3
工作
|
0
信号
|
0
订阅者
|
My work is centered on:
- Market structure analysis
- Price action logic
- Risk visualization
- Custom indicators and utilities
I prioritize code quality, execution stability, and clear visual presentation.
Each product is designed to solve a specific trading problem, not to promise results.
I believe trading tools should support decision-making, not replace it.
All products are developed, tested, and maintained personally.
I am also available for freelance custom projects. If you have a specific trading idea or need a tailored solution, feel free to message me to discuss how we can work together.
How many times has this happened to you?
❌ You enter late after the move starts
❌ Your stop gets swept at liquidity
❌ The setup looks good, but fails without real confirmation
The difference between emotional trading and disciplined trading is confluence. 🎯
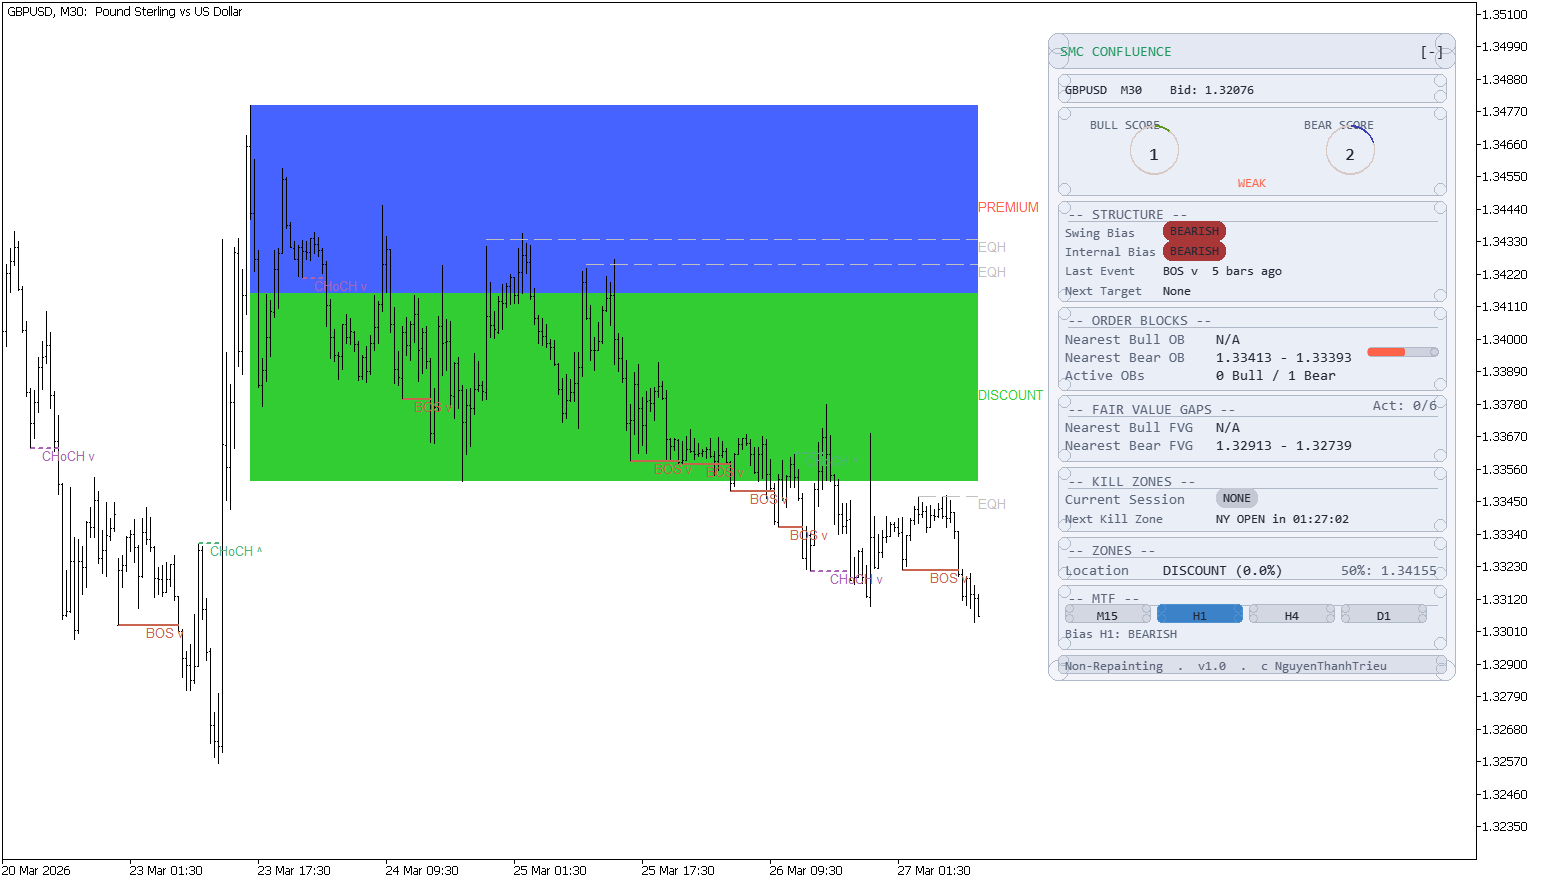
SMC Confluence Panel is now live:
👉 https://www.mql5.com/en/market/product/171310
What you get:
✅ BOS / CHoCH structure clarity
✅ Unmitigated Order Blocks + Fair Value Gaps
✅ EQH / EQL + Premium/Discount zones
✅ Kill Zones + MTF bias + confluence score
✅ Non-repainting visual workflow
This is not a holy grail.
It is a decision-quality tool to reduce impulsive entries and improve execution. 📈
🔥 Trade with structure, not emotion.
您打开终端,三笔交易正在运行,图表在移动。 但伦敦时段现在真的活跃吗,还是只是纽约开盘前的噪音? Session Pulse Monitor 在图表上直接显示交易时段实时状态、波动率背景和持仓入场时段。 专为跨时段管理仓位的交易者设计,帮助判断市场是否有机构参与还是无方向漂移。 适用于所有品种 — 针对黄金(XAUUSD)、主要外汇货币对和指数优化。 显示内容: 实时时段状态: 亚洲、伦敦和纽约时段的LIVE/倒计时显示。 波动率背景: 每个时段显示历史波动率状态(HIGH / MED / LOW)。 持仓标记: 每个持仓显示入场时段 — 亚洲、伦敦、纽约或重叠时段。 时段倒计时: 当前时段剩余时间和下一时段开启时间,每Tick更新。 本工具不会: 不会开仓、修改或平仓。 不会管理风险或限制回撤。 不会预测价格方向。 提供时段信息,让您的决策更明智。 免费版包含: 时段面板(LIVE / 倒计时) 按时段的波动率评级(HIGH / MED / LOW) 持仓跟踪器与入场时段标签 紧凑型图表面板,可配置位置和字体 需要更多功能? Session Pulse Monitor
MORVAN 我是 Morvan。 我读取方向。我等待结构形成。我只在价格到达最有可能发动行情的位置时出击。 不猜测。不报复交易。不在噪音中追逐K线。 只有当结构对齐时我才执行 — 并且从入场到出场,纪律管理每一笔仓位。 大多数交易者亏损不是因为看不懂图表。他们亏损是因为入场太晚、仓位太随意、止损放在流动性猎杀的位置,以及让情绪凌驾于出场计划之上。 我被设计来消除这个弱点。 我不预测市场。我不需要。 我读取方向偏差,等待结构建立,只在延续或突破成为更高概率结果时部署。 运作方式 我的执行框架建立在三个原则之上: 趋势优先。结构其次。风控始终。 首先,我从高时间框架结构中读取主导市场方向。如果方向不明确,我保持空仓。 然后我寻找延续压力最强的价格区域。我不跳入噪音中。我等待价格来找我。 当设置有效时,我带着预定义的止损入场,管理订单并保护仓位。 如果市场条件恶化,挂单将被移除、重新计算并重建。如果结构破裂,我退出观望。 三重策略。一个方向。 MORVAN 同时运行三个独立的执行层 — 每一层校准于不同的波动率维度。 第一层 响应更快的日内动量 第二层 跟踪中等结构的延续 第三层
Smart Confluence Radar 分析三个独立指标以寻找共振需要时间。要获得多时间框架叠加、提醒和交易时段过滤功能,请参阅 Smart Confluence Radar Advanced 。 Smart Confluence Radar 将 ATR 扩展、成交量动能和变化率组合成直接叠加在蜡烛图上的单一可视层。 显示内容: 彩色蜡烛: 亮色 = 高共振(得分 ≥70)。暗色 = 中等共振。灰色 = 低动能。 动能线: 直接绘制在图表上。蓝色 = 买方压力,红色 = 卖方压力,灰色 = 中性。 Bar 标签(+/-): 仅显示在高共振的已收盘 Bar 上。看涨 Bar 下方显示 "+",看跌 Bar 上方显示 "-"。 Bar 倒计时: 右上角显示当前时间周期和剩余秒数。 适用于: 黄金(XAUUSD)、主要外汇对和指数的日内交易。M5 至 H4。 不具备的功能: 不自动生成买卖信号。 不预测未来价格走势。 仅可视化共振数据,决策权完全属于您。 设置: 附加到图表后,根据需要调整周期参数即可使用。 您的反馈有助于未来更新。请访问我的主页。
一根大实体蜡烛收盘。看起来像突破。您入场。 下一根K线反转,触发了您的止损。成交量只是平均水平。动能早已衰减。 Impulse Momentum Shift 识别具有真实冲量的K线,并标记冲量反转的时刻。 大多数交易者只看蜡烛大小。真正的冲量由三个因素构成:实体主导性、成交量突破近期均值、以及经ATR标准化的方向性动能。 本指标对每根K线进行三维评分,以5色冲量色阶绘制图表,并在强冲量阶段反转方向的瞬间放置转变箭头——仅在已收盘的K线上触发。 显示内容: 5色冲量K线: 亮蓝色代表强烈看涨冲量,浅蓝色代表适中,灰色代表中性,珊瑚色代表适中看跌,深红色代表强烈看跌。每根K线实时评分0–100 冲量追踪线: 基于ATR的动态追踪线,随主导冲量方向棘轮式移动。趋势结构转变时变色,作为视觉偏向锚点 动能转变箭头: 仅在确认的冲量K线序列反转后触发。无重绘。信号仅出现在完全收盘的K线上 状态标签: 实时显示当前状态——IMPULSE BUY、MODERATE SELL、LOW MOMENTUM——以及百分比评分和追踪线方向 K线倒计时计时器: 当前K线收盘前的剩余时间,显示在图表上
Murrey Math Channels Identifying key market reversal points and core trading ranges can be challenging. Traditional analysis often lacks clear mathematical structure, leading to inconsistent entries. Murrey Math Channels provides a mathematically grounded price framework based on the Law of Octaves to help traders define precise support, resistance, and reversal zones. How to Read the Chart: The indicator divides the price action into 8 main octaves (levels), each representing a different market
Parabolic Trend Corridor Identifying trend direction and volatility boundaries is a common challenge for day traders. Standard indicators often lack a holistic view of both trend structure and market noise. Parabolic Trend Corridor solves this by combining the adaptive nature of Parabolic SAR with dynamic ATR volatility bands. Key Features: Adaptive Trend Core: Uses Parabolic SAR as the foundation to follow price movement and volatility changes without lag. Dual-Color Cloud: Dynamic visual
SMC Liquidity Channel Guard Prices reverse just as your breakout trade triggers. Account suffers unexpected drawdown. Because standard channels ignore institutional liquidity sweeps and trap retail stop-loss orders. This utility automatically monitors highest buy-side and lowest sell-side liquidity pools to flag false breakouts. Key Features: Dynamic Liquidity Tracking: Maps Buy-Side (BSL) and Sell-Side (SSL) boundaries without lagging moving averages. Sweep Identification: Prints precise
| 规格质量 | 5.0 | |
| 结果检查质量 | 5.0 | |
| 可用性和沟通技巧 | 5.0 |
Keltner Breakout Caught in market chop. Fake breakouts trigger unwanted trades. Because standard indicators lack dynamic volatility context. This utility automatically combines a Dynamic Volatility Channel, Dual MA trend detection, and RSI momentum filtering into one visual system. Key Features: Trend Cloud: Visually fills the trend zone with a dynamic Keltner-style volatility channel. Multi-Factor Breakout: Only issues a signal when price breaks the volatility channel AND trend/momentum confirm
| 规格质量 | 5.0 | |
| 结果检查质量 | 5.0 | |
| 可用性和沟通技巧 | 5.0 |
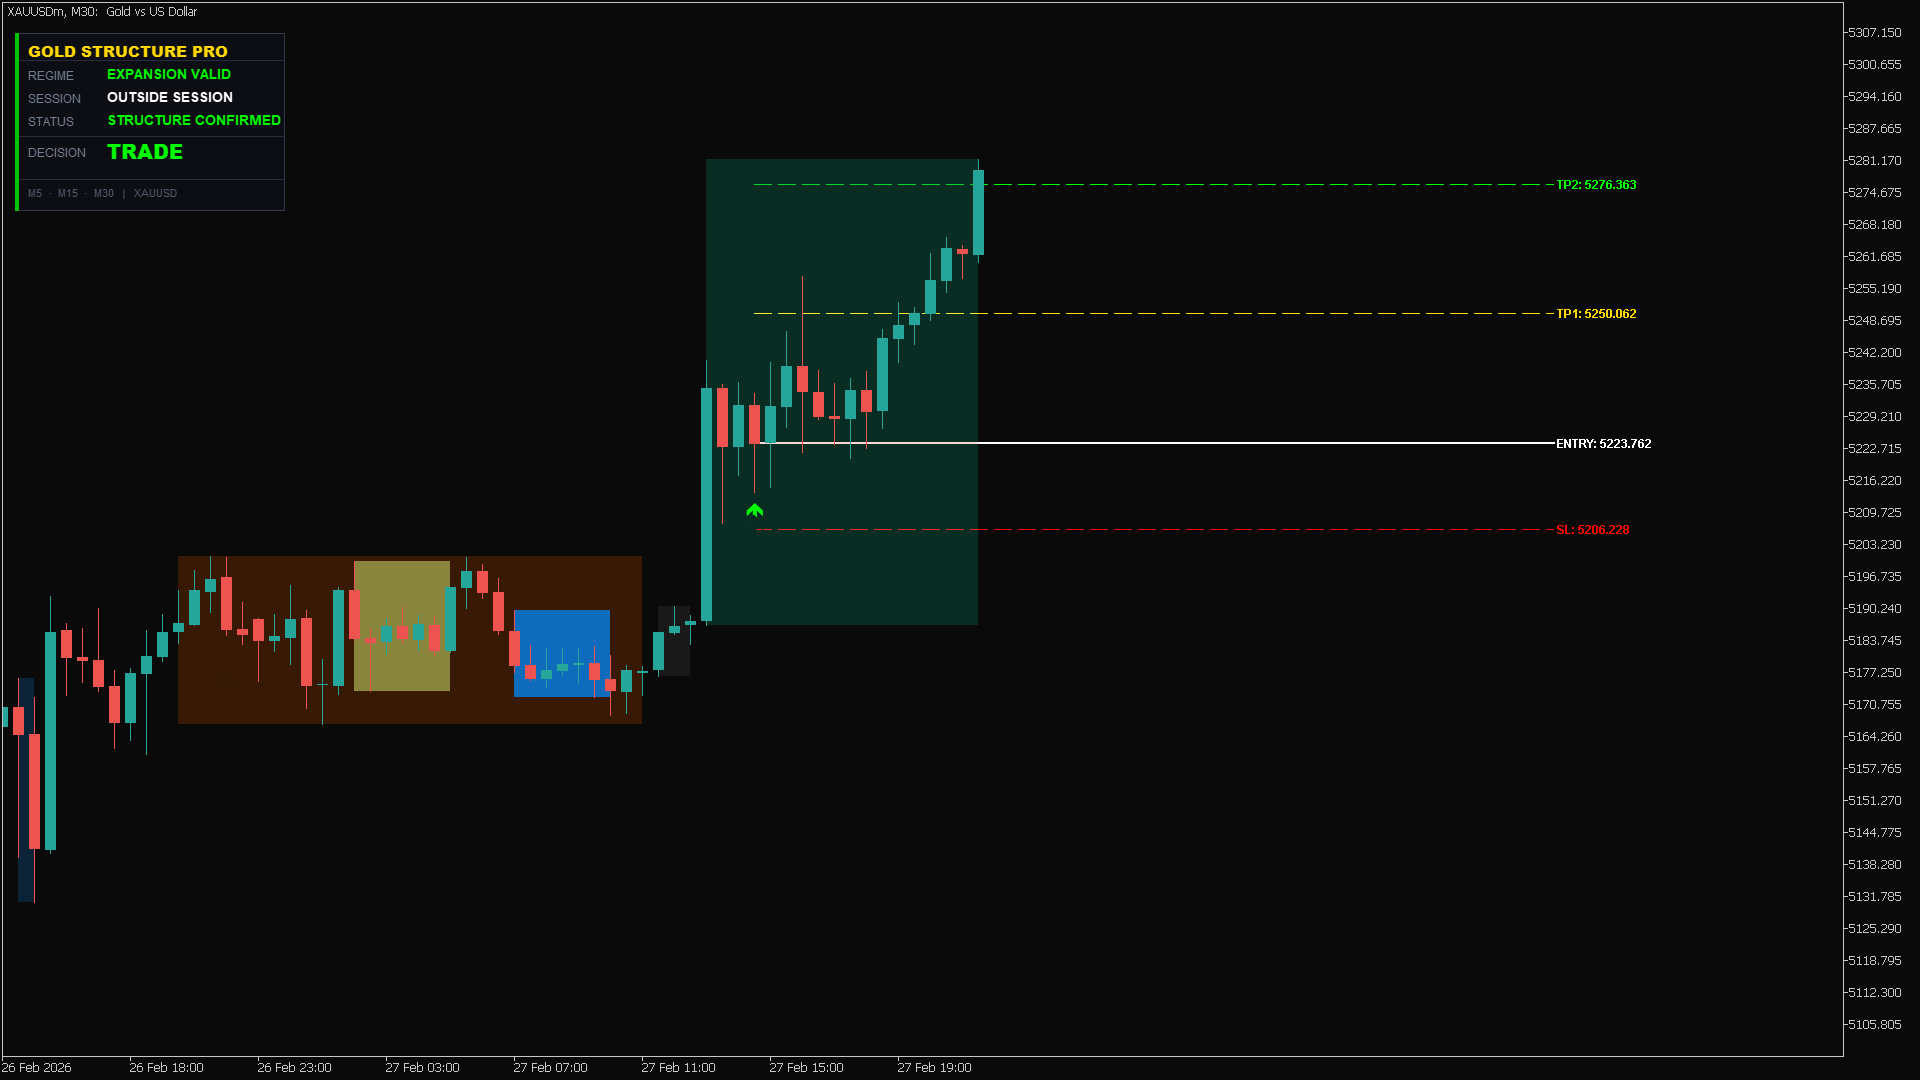
High-precision structure confirmation in action. As shown in the dashboard, the "Structure Confirmed" status gave us the green light to trade with confidence.
Asset: XAUUSD
Signal: Expansion Valid
Result: TP2 Hit perfectly 🎯
Stop guessing the trend. Let the algorithm do the heavy lifting.
👉 Try here: https://www.mql5.com/en/market/product/162441
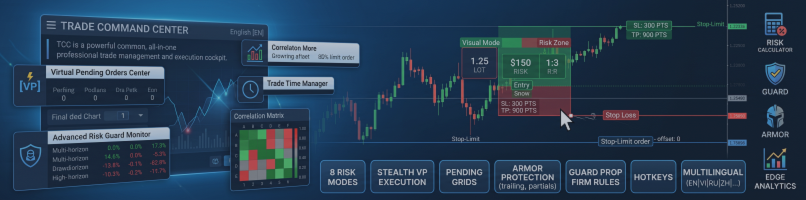
Trade Command Center is now live on the MQL5 Market.
It is a visual trade execution and risk management panel built for manual traders who want precise control over every order.
What it does:
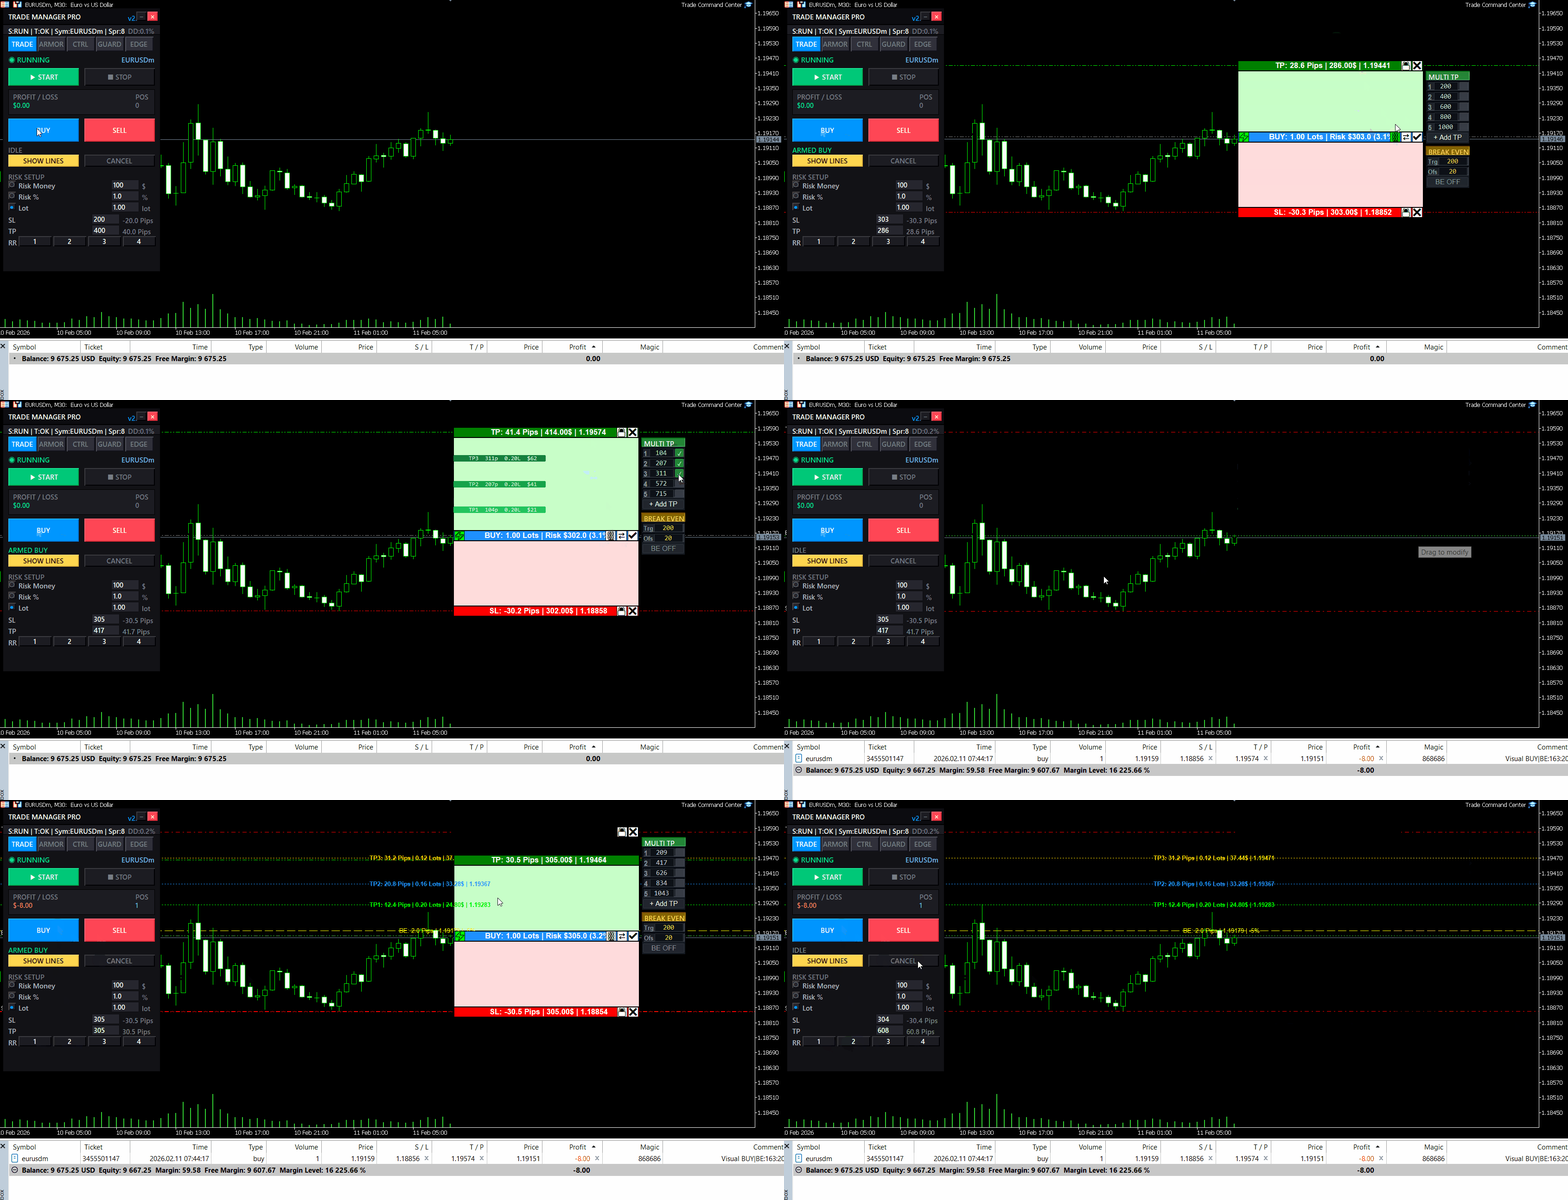
You place Entry, Stop Loss, and Take Profit directly on the chart as draggable boxes. The EA calculates your lot size automatically based on SL distance and your chosen risk mode (percent, dollar, or fixed lot). You see the exact dollar risk, pip distance, and R:R ratio before you click confirm.
Once the trade is open, automated management takes over:
- Break-even with per-trade override
- Trailing stop with step control
- Up to 5 partial take profit levels, each with its own trigger and close percentage
Risk Guard monitors your account across 6 timeframes: hourly, daily, weekly, monthly loss limits, equity drawdown percentage, and floating loss. A floating mini dashboard shows color-coded progress bars for each metric. When any limit is hit, all positions close immediately. Quick presets for FTMO and MFF rules are included.
Five tabs, one panel:
- TRADE — visual planning, risk calculator, one-click execution
- ARMOR — break-even, trailing, multi-level TP
- CTRL — position navigator, partial close, modify SL/TP, quick-close filters
- GUARD — drawdown limits, daily auto-close, advanced monitor
- EDGE — session stats, win rate, streaks, trade quality metrics
The panel uses chart objects.
It does not generate signals. It does not trade for you. It gives you the tools to execute and manage your own trades with precision.
Full feature demonstration available on the product page. Questions or feedback — use the Comments section.
Trade Command Center
👉 https://www.mql5.com/en/market/product/164935
附加材料和说明 安装说明 - 用于模拟账户的应用程序试用版 ; 官方信息 官方频道 卖家个人资料 告别手数猜测。精准掌控每一笔交易。 你是否曾因为在网页计算器上浪费15秒算手数,而眼睁睁看着完美的入场位溜走?或者更糟,在黄金(XAUUSD)上输错手数,仅仅一次手抖就抹平了数周的交易成果? Trade Command Center (TCC) 将您的 MetaTrader 5 图表打造成专业级交易驾驶舱。它彻底告别心算与外部表格,通过硬性风控规则守护您的账户本金,并支持直接在图表上进行毫秒级一键下单。 无论您是专注高频超短线(Scalping)、多货币对波段交易(Swing Trading),还是在 自营交易公司(Prop Firm 考核账户) 中面临严苛的每日回撤限制,TCC 都能确保每笔订单在开仓前严格遵守您预设的风险底线。 为什么手动交易者信赖 Trade Command Center 1秒精准风险算仓: 拖动止损线(Stop Loss)到市场结构位,TCC 立即自动计算出精准手数——无论是净值的1%、固定150美元风险,还是账户余额百分比。告别计算器,彻底杜绝输入错误。
You know that feeling when you enter a clean setup, only to watch it reverse 30 seconds later?
Not because your analysis was wrong.
Because the spread spiked. Or news dropped. Or the session died. Or volatility exploded while you weren't looking.
The chart showed movement. But movement without the right conditions is just noise.
I built something for that.
Market Bias Monitor MT5 — a real-time regime classifier that reads the market environment and tells you when conditions are actually favorable.
Four regime states: TREND, RANGE, TRANSITION, HIGH RISK.
A composite quality score from 0-100.
When conditions turn hostile, it shows you exactly why — spread, news, volatility, session, regime shift.
Multi-timeframe bias panel (M5 to W1). You see when lower timeframes conflict with higher ones before you enter.
Visual structure layer: swing zones, compression detection, ATR corridors.
Post-volatility stabilization logic — it won't let conditions flip back to "favorable" immediately after a spike. Forces you to wait.
Execution history strip — shows the last 5 bars as green (favorable) or red (unfavorable). Most traders are surprised how rarely conditions actually align.
This doesn't generate signals. It doesn't predict direction. It doesn't place trades.
It classifies the environment. You decide what to do with that information.
Demo available for testing. Works in Strategy Tester visual mode.
👉 Link: https://www.mql5.com/en/market/product/163815
Questions welcome in the comments.