Trend Line Map Pro MT5
- 指标
- STE S.S.COMPANY
- 版本: 6.20
- 更新: 13 一月 2023
- 激活: 10
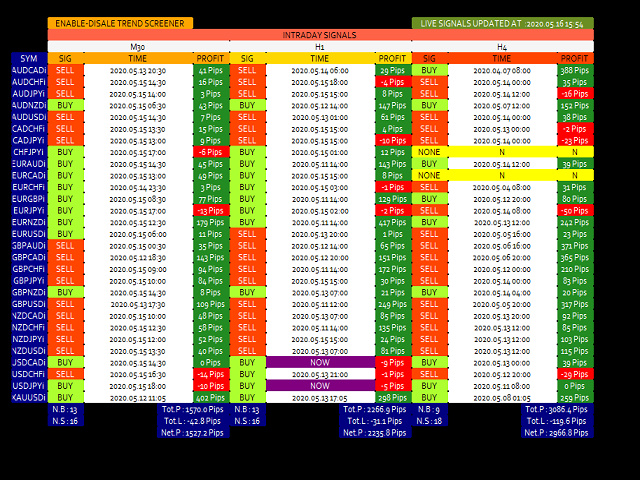
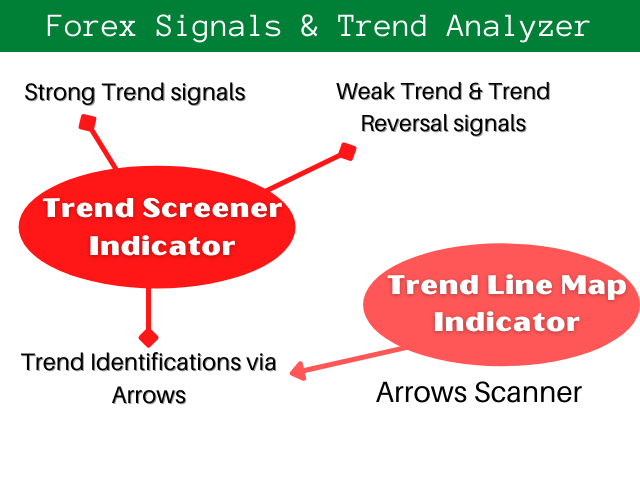
趋势线图指标是趋势筛选器指标的插件。它用作趋势筛选器(趋势线信号)生成的所有信号的扫描仪。
它是基于趋势筛选器指标的趋势线扫描仪。如果您没有 Trend Screener Pro Indicator,Trend Line Map Pro 将无法使用。
It's a Trend Line Scanner based on Trend Screener Indicator. If you don't have Trend Screener Pro Indicator, the Trend Line Map Pro will not work.
通过访问我们的 MQL5 博客,您可以下载趋势线图指标的免费版本。购买前试用,不受 Metatrader Tester 限制。 : 点击这里
1. 容易获得的优势
- 根据货币和时间范围显示买入和卖出信号。
- 评估自图表中出现箭头以来价格上涨或下跌的点数。 (趋势筛选指标箭头)
- 显示信号的时序。
- 获取多时间范围和多货币警报以购买和出售警报。
2. 如何使用趋势线图
如何显示买卖信号仪表板?
如果您有任何问题或需要帮助,请通过私信联系我。
作者
SAYADI ACHREF,金融科技软件工程师,Finansya 创始人。


I would like to thank Sayadi for the support he gave me regarding my doubts regarding his trading system. He was very attentive and simply a fantastic guy. As for the indicators, they are incredibly accurate. I am very satisfied with everything. I recommend him to everyone! I appreciate your work, Sayad.