Trend Line Map Pro MT5
- 지표
- STE S.S.COMPANY
- 버전: 6.20
- 업데이트됨: 13 1월 2023
- 활성화: 10
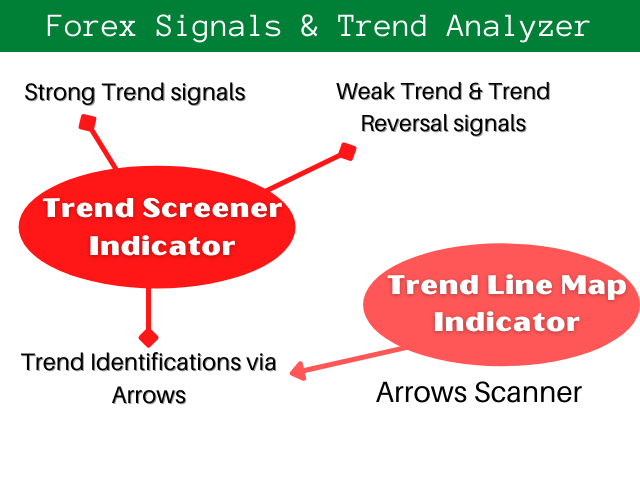
트렌드 라인 맵 표시기는 트렌드 스크리너 표시기의 애드온입니다. Trend screener(Trend Line Signals)에 의해 생성된 모든 신호에 대한 스캐너로 작동합니다.
Trend Screener Indicator 기반의 Trend Line Scanner입니다. Trend Screener Pro 표시기가 없으면 Trend Line Map Pro가 작동하지 않습니다.
It's a Trend Line Scanner based on Trend Screener Indicator. If you don't have Trend Screener Pro Indicator, the Trend Line Map Pro will not work.
MQL5 블로그에 액세스하여 추세선 지도 표시기의 무료 버전을 다운로드할 수 있습니다. Metatrader Tester 제한 없이 구매하기 전에 사용해 보십시오. : 여기를 클릭하세요
1. 쉽게 얻을 수 있는 이점
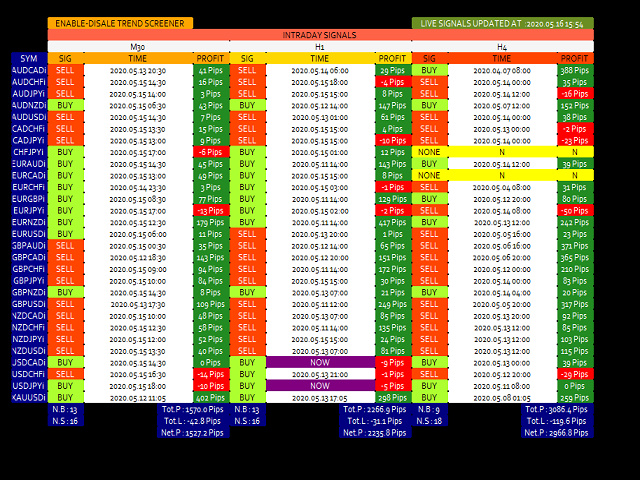
- 통화 및 시간 프레임을 기반으로 매수 및 매도 신호를 표시합니다.
- 차트에 화살표가 나타난 이후 가격이 몇 핍 증가 또는 감소했는지 평가하십시오. ( 트렌드 스크리너 표시기 화살표 )
- 신호의 타이밍을 표시합니다.
- 구매 및 판매 알림에 대한 다중 기간 및 다중 통화 알림 받기.
2. 추세선 맵 사용 방법
매수-매도 신호 대시보드를 표시하는 방법은 무엇입니까?
질문이 있거나 도움이 필요하면 비공개 메시지를 통해 저에게 연락하십시오.
작가
SAYADI ACHREF, 핀테크 소프트웨어 엔지니어이자 Finansya..


I would like to thank Sayadi for the support he gave me regarding my doubts regarding his trading system. He was very attentive and simply a fantastic guy. As for the indicators, they are incredibly accurate. I am very satisfied with everything. I recommend him to everyone! I appreciate your work, Sayad.