• Genel bakış
  • İncelemeler (6)
  • Yorumlar (3)
  • Yenilikler

Trend Line Map Pro MT5

5

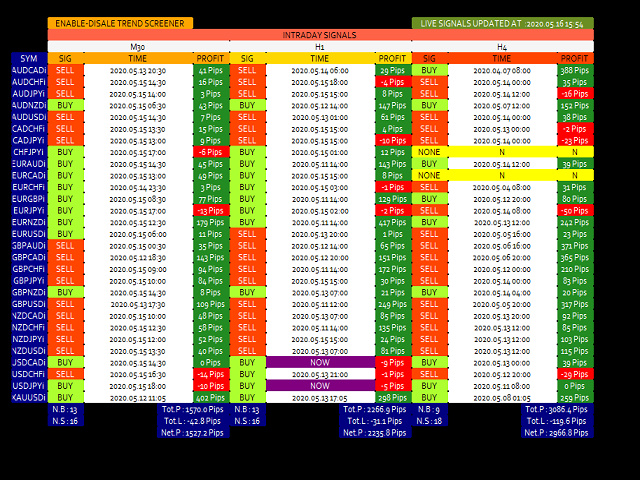
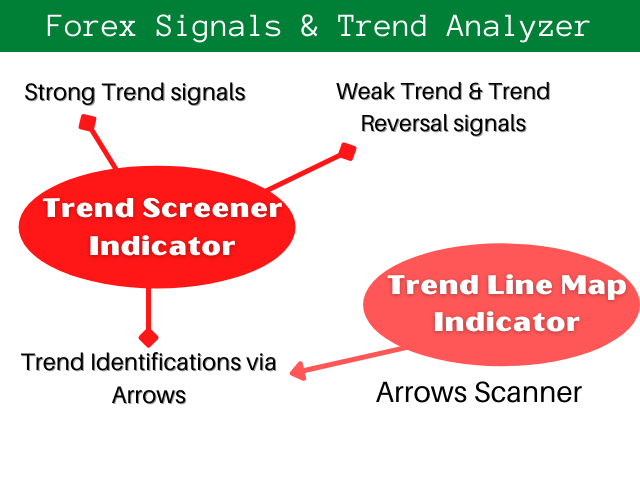
Trend Line Map indicator is an addons for Trend Screener Indicator. It's working as a scanner for all signals generated by Trend screener ( Trend Line Signals ) .

It's a Trend Line Scanner based on Trend Screener Indicator.  If you don't have Trend Screener Pro Indicator,  the Trend Line Map Pro will not work. 


LIMITED TIME OFFER : Trend Line Map Indicator is available for only 50 $ and lifetime. ( Original price 125$ )

By accessing to our MQL5 Blog,  you can find all our premium indicators with analysis examples : Click Here


1. Advantages You Get Easy

  • Display Buy and Sell signals based on Currencies and Time Frames.
  • Evaluate how many pips the price increased or decreased since the arrows appeared in the chart. ( Trend Screener Indicators Arrows )
  • Display the timing of signals.
  • Getting a multi-timeframe and multi-currencies  Alerts to buy and sell alerts.

2. How to use Trend Line Map

All Trend Line Map documentations ( Instructions ) and strategy details are available in this post in our MQL5 Blog : Click Here.


3. Tips to improve indicator calculation performance

1. Ensure that you download the data of the pairs that you will analyze.
2. Set the Update Frequency to 60 seconds. ( Default 20 seconds )
3. The maximum number of pairs to monitor should be more than 12 pairs to have a maximum performance of the trend performance calculation.
4. Attach indicator to H1 timeframe.


4. Contact

If you have some questions or if you need help, Contact me via Private Message.


Author

SAYADI ACHREF , fintech software engineer and founder of Finansya.

İncelemeler 6
T.J.Sch_318798
156
T.J.Sch_318798 2023.03.02 18:33 
 

This indicator is excellent. It greatly helps you to identify great teading oportunities & trend predictor helps correctly predict the trend and avoid traps. The service provided by Sayadi is amazing. This & trend predictor are excellent choice for having great - safe trading.

pdev
550
pdev 2023.02.06 08:35 
 

Great indicator and an indispensable add-on for trend screener indicator. Very helpful and responsive seller

Maungfortrading
229
Maungfortrading 2022.02.08 14:15 
 

Best Indicator !!

Önerilen ürünler
Noize Absorption Index - is the manual trading system that measures the difference of pressure between bears forces and bulls forces. Green line - is a noize free index that showing curent situation. Zero value of index shows totally choppy/flat market.Values above zero level shows how powerfull bullish wave is and values below zero measures bearish forces.Up arrow appears on bearish market when it's ready to reverse, dn arrow appears on weak bullish market, as a result of reverse expectation.
199 USD
"The trend is your friend" is one of the best known sayings in investing, because capturing large trendy price movements can be extremely profitable. However, trading with the trend is often easier said than done, because many indicators are based on price reversals not trends. These aren't very effective at identifying trendy periods, or predicting whether trends will continue. We developed the Trendiness Index to help address this problem by indicating the strength and direction of price trend
49 USD
Laguerre SuperTrend Clouds   adds an Adaptive Laguerre averaging algorithm and alerts to the widely popular SuperTrend indicator. As the name suggests,   Laguerre SuperTrend Clouds (LSC)   is a trending indicator which works best in trendy (not choppy) markets. The SuperTrend is an extremely popular indicator for intraday and daily trading, and can be used on any timeframe. Incorporating Laguerre's equation to this can facilitate more robust trend detection and smoother filters. The LSC uses the
30 USD
Premium seviye, %80'den fazla doğru tahmin doğruluğuna sahip benzersiz bir göstergedir! Bu gösterge en iyi Ticaret Uzmanları tarafından iki aydan uzun süredir test edilmiştir! Yazarın göstergesini başka hiçbir yerde bulamazsınız! Ekran görüntülerinden bu aracın doğruluğunu kendiniz görebilirsiniz! 1, sona erme süresi 1 mum olan ikili opsiyon ticareti için harikadır. 2 tüm döviz çiftleri, hisse senetleri, emtialar, kripto para birimleri üzerinde çalışır Talimatlar: Kırmızı ok görün
1 100 USD
Alpha Binary Pro
Rafael Alejandro Rey Alves
1 (1)
The Alpha Binary Pro indicator is intended to work in different scenarios. This indicator uses a combination of technical indicators to detect buy or sell opportunities. The indicator works with any currency pair, stocks, cryptocurrencies and synthetic indices. The indicated can be used for both traditional trading and binary options. The indicator works with any time frame, from M1 to MN. When the blue arrow is pointing upwards this indicates that the signal is to buy. When the red
30 USD
The Gann Box (or Gann Square) is a market analysis method based on the "Mathematical formula for market predictions" article by W.D. Gann. This indicator can plot three models of Squares: 90, 52(104), 144. There are six variants of grids and two variants of arcs. You can plot multiple squares on one chart simultaneously. Parameters Square — selection of a square model: 90 — square of 90 (or square of nine); 52 (104) — square of 52 (or 104); 144 — universal square of 144; 144 (full) — "full"
52 USD
Perfect Sniper
Ignacio Agustin Mene Franco
Perfect Sniper! is a triple indicator with support resistance detection, downtrend channel, uptrend channel Bands included! where he hunts the rebounds in the red lines for sale, in the green lines mark purchase, in the lower bands that are the breaks gives another second entry either buy or sell, perfect to take advantage of the double entrance, It is used in any temporality, It is used to scalp and long on h1 or h4 to D1. It works for Forex markets, All pairs. It is used for the synthetic inde
100 USD
Trend Fibonacci is a unique indicator that combines a power of Fibonacci sequences and ranges. How to read: - There are three zones --> red, gold and green - Red candlestick = downtrend - Green candlestick = uptrend   - Gold candlestick = no established trend Inputs: Per = number of bars used for calculations FirstRatio = first Fibonacci ratio (Or use any ratio you want) SecondRatio = second Fibonacci ratio (Or use any ratio you want) !! IF YOU PURCHASE THE INDICATOR, CONTACT ME FOR
47 USD
An indicator of pattern #31 ("Long Island") from Encyclopedia of Chart Patterns by Thomas N. Bulkowski. The second gap is in the opposite direction. Parameters: Alerts - show alert when an arrow appears   Push - send a push notification when an arrow appears (requires configuration in the terminal) GapSize - minimum gap size in points ArrowType - a symbol from 1 to 17 ArrowVShift - vertical shift of arrows in points   ShowLevels - show levels ColUp - color of an upward line ColDn - color of a
30 USD
Tunafish EA
Ismaele Daniele Lodetti
Tunafish EA is the most efficient EA on my profile. I spent a lot of time and effort to make this software sophisticated with possibilities of high potential returns while keeping the drawdown below 25%. The algorithms of the robot provide investors of any level of training with an investment opportunity that is both safe and aggressive. Tunafish EA imitating the work of the brain, capable of learning and adapting to changing conditions and predicting situations. When applied to trading in fina
69 USD
Bu indikatör, her sipariş için önceden belirlediğiniz TP ve SL Değerlerini (o para biriminde) grafiklerde (işlem/sipariş satırına kapalı) gösterecek ve her sipariş için kar ve zararınızı tahmin etmenize çok yardımcı olacaktır. Ayrıca size PIP değerlerini de gösterir. gösterilen format "Kâr veya Zararımızın Döviz Değerleri / PIP değerlerimiz" şeklindedir. TP Değeri Yeşil Renkte ve SL Değeri Kırmızı Renkte gösterilecektir. Herhangi bir sorunuz veya daha fazla bilgi için lütfen fxlife.asia@hotma
99 USD
This Indicator comes handy for everyone who uses Support and Resistance zones when trading. It will not only show you all major Supp/Res zones on the chart, but it will also notify you in a case of possible entry signal. Thanks to its customization possibilities, it will be the only indicator you will need when it comes down to trading Supp and Resistance zones.  !! If you decide to purchase the product, please contact me for further support and useful tips !! 
57 USD
SBA scalping v75
Umri Azkia Zulkarnaen
ini adalah indikator khusus digunakan untuk trading di binary.com dengan pair volatility 75. indikator ini sangat simpel dan mudah digunakan baik untuk yang sudah profesional atau pun yang baru dalam dunia trading terutama yang baru di market volatility 75.indikator ini lebih bertujuan untuk scalping trader dan menggunakan timeframe M1 sebagai acuan untuk entry. adapun jika ingin mempelajari lebih lanjut bisa menghubungi di telegram  https://t.me/shadowbreakerfx . untuk SOP lengkap silahkan klik
110 USD
Modified Rainbow
Rafael Alejandro Rey Alves
Modified Rainbow   The Modified Rainbow indicator is intended to work in different scenarios. The indicator uses a combination of technical indicators to detect buy or sell opportunities (different Moving Averages and other technical indicators). The indicator works with any currency pair, stocks, cryptocurrencies and synthetic indices. The indicator can be used for both traditional trading and binary options. The indicator works with any time frame, from M1 to MN. When the blue arrow
30 USD
Multi-timeframe trend indicator based on the ADX / ADXWilder indicator with Fibonacci levels The indicator shows trend areas using ADX or ADXWilder indicator data from multiple timeframes. The impulse mode of the indicator allows you to catch the beginning of a trend, and several "Screens" with different timeframes allow you to filter out market noise. Fibonacci levels are added to the price chart, which have flexible settings. How the indicator works: if PDI is greater than NDI, then   it`
35 USD
To get access to MT4 version please click here . - This is the exact conversion from TradingView: "Stochastic Momentum Index" By "UCSgears". - This is a popular version of stochastic oscillator on tradingview. - This is a light-load processing and non-repaint indicator. - Buffers are available for the lines on chart. - You can message in private chat for further changes you need. Thanks for downloading
40 USD
This MT5 indicator has been designed to be used on any currency pair and any time frame . It has the scalper and swing trader in mind.  The indicator looks for short-term high-probability reversals in price and will indicate to you to go long (buy) or short (sell) if you see a green or red arrow next to the current candlestick respectively. The indicator provides the best trading opportunities to you during the active trading hours of London and New York, but it will continue to give signals al
199 USD
Volality Index scalper indicator  Meant for Volality pairs such as Volality 10, 25, 50, 75 and 100 The indicator works on all timeframes from the 1 minute to the monthly timeframe the indicator is non repaint the indicator has 3 entry settings 1 color change on zero cross 2 color change on slope change 3 color change on signal line cross Orange line is your sell signal Blue line is your buy signal.
35 USD
Sayı dizilerinden birine "Orman Yangını Dizisi" denir. En güzel yeni dizilerden biri olarak kabul edildi. Başlıca özelliği, bu dizinin lineer trendlerden, hatta en kısa olanlardan kaçınmasıdır. Bu göstergenin temelini oluşturan bu özelliktir. Bir finansal zaman serisini analiz ederken, bu gösterge tüm olası trend seçeneklerini reddetmeye çalışır. Ve ancak başarısız olursa, bir trendin varlığını tanır ve uygun sinyali verir. Bu yaklaşım, yeni trendlerin başladığı anların doğru bir şekilde belirl
30 USD
Description : Rainbow EA MT5 is a simple Expert advisor based on   Rainbow MT5 indicator witch is based on Moving average with period 34. The indicator is incorporated in the EA, therefore, it is not required for the EA to operate, but if you wish, you can download it from   my product page . The Expert Advisor settings are as follows : Suitable for Timeframes up to H1 The parameters below can be set according to your trading rules. StopLoss ( Stop Loss in pips) TakeProfit ( Take Profit in pi
59 USD
Candlestick Pattern Scanner is a multi-timeframe and multi-symbol dashboard and alert system that checks all timeframes and currency pairs for different candlestick patterns that are formed in them. Scanner is integrated   with support and resistance zones so you can check the candlestick patterns in most important areas of the chart to find breakout and reversal patterns in the price chart. Download demo version   (works on M4,M5,M6,M12,H3,H8 timeframes) Read the full description of scanner par
60 USD
The best time to trade Using this Indicator is when the time reach exactly hour,half,45 minutes,15 minutes and sometimes 5 minutes.. This indicators is helpful to those who trade boom and crash indecies.How to read this indicator first you'll see Blue allow and Red allow all these allows used to indicate or to detect the spike which will happen so the allow happens soon before the spike happen.This indicator works properly only in boom and crash trading thing which you have to consider when
30 USD
Your Trend Friend
Luigi Nunes Labigalini
The trend is your friend! Look at the color of the indicator and trade on that direction. It does not  repaint. After each candle is closed, that's the color of the trend. You can focus on shorter faster trends or major trends, just test what's most suitable for the symbol and timeframe you trade. Simply change the "Length" parameter and the indicator will automatically adapt. You can also change the color, thickness and style of the lines. Download and give it a try! There are big movements
99 USD
Renko Gold
Ignacio Agustin Mene Franco
Renko Gold! clearly indicates the floors and ceilings where it goes from 4 lines, the line below that marks the floor in green confirming with the thinnest line clarifies the purchase entry, the same is for sale, the top line marks the ceiling and the thinnest red line marks the sale, This indicator works for all temporalities! For Forex and Synthetic Indices markets! It also works for crypto markets! Good profit! World Investor.
40 USD
Trend Side - trendi belirlemek için teknik bir gösterge. Birkaç tam teşekküllü ticaret stratejisi kümesidir. Gösterge, gelişmiş bir trend filtreleme sistemi kullanır, istatistiksel bir panele sahiptir, giriş ve çıkış seviyelerini hesaplar ve dinamik Takip Durdurma seviyesini hesaplar. Her tür sembol için uygundur, sinyallerini ve sonuçlarını asla yeniden çizmez. Profesyonel trend ticareti için kapsamlı bir araç. Trend Side göstergesi seti ayrıca Andrews Trend Scanner'ı içerir - çok para birimi
50 USD
Pipfinite creates unique, high quality and affordable trading tools. Our tools may or may not work for you, so we strongly suggest to try the Demo Version for MT4 first. Please test the indicator prior to purchasing to determine if it works for you. We want your good reviews, so hurry up and test it for free...we hope you will find it useful. Combo Energy Beam with Swing Control Strategy: Confirm swing pullback signals Watch Video: (Click Here) Energy Beam with Trend Laser Strategy: Confirm Tr
88 USD
Automatic fibonacci with alerts is an indicator that automatically plots a fibonacci retracement based on the number of bars you select on the BarsToScan setting in the indicator. The fibonacci is automatically updated in real time as new highest and lowest values appear amongst the selected bars. You can select which level values to be displayed in the indicator settings. You can also select the color of the levels thus enabling the trader to be able to attach the indicator several times with d
30 USD
Bu, fiyat etiketleriyle (devre dışı bırakılabilir)   Gelişmiş ZigZag Dinamik   ve/veya   Genişletilmiş Fraktallar   göstergesi ekstremumlarına dayalı destek ve direnç seviyelerinin bir MTF göstergesidir. MTF modu için daha yüksek TF'ler seçilebilir. Varsayılan olarak, seviyeler ZigZag gösterge noktalarına göre oluşturulur. Fraktal gösterge noktaları da ZigZag ile birlikte veya onun yerine kullanılabilir. Kullanımı basitleştirmek ve CPU zamanından tasarruf etmek için, açılışta her çubuk için bir
30 USD
Magic Finger can help you identify trends and trading opportunities clearly. The finger points to the open position signal, and the discoloration line is confirmed by the trend. If you are a day trader, you can choose to trade during a period of active trading, referring to the discoloration line as the basis for the next order, finger signal as a filter. If you are a trend trader, you can choose a period above H1, wait for the appearance of the finger signal in the key price area, and enter
188 USD
No Demand No Supply MT5
Panagiotis Diamantopoulos
No Demand No Supply   This indicator identifies   No Demand –No Supply candles  to your chart and plots volume bars colored according to the signal. It can be applied to all timeframes or to a specific one only. It can also be used as regular volume indicator  with exceptional future of WEIGHTED VOLUME. Furthermore is has an alert notification, sound and email when a signals occurs. The indicator does not repaint but the alert will come on two candles back due to the definition of No Demand No S
80 USD
Bu ürünün alıcıları ayrıca şunları satın alıyor
Top indicator for MT5   providing accurate signals to enter a trade without repainting! It can be applied to any financial assets: forex, cryptocurrencies, metals, stocks, indices .  MT4 version is here It will provide pretty accurate trading signals and tell you when it's best to open a trade and close it. Watch  the video  (6:22) with an example of processing only one signal that paid off the indicator! Most traders improve their trading results during the first trading week with the help of
125 USD
ICT, SMC, SMART MONEY CONCEPTS, SMART MONEY, Smart Money Concept, Support and Resistance, Trend Analysis, Price Action, Market Structure, Order Blocks, BOS/CHoCH,   Momentum Shift, HH/LL/HL/LH,    Fair Value Gap, FVG,  Premium  &   Discount   Zones, Fibonacci Retracement, OTE, Buy Side Liquidity, Sell Side Liquidity, BSL/SSL Taken, Equal Highs & Lows, MTF, Multiple Time Frame, BigBar, HTF OB, HTF Market Structure,  Liquidity Voids, Long Wicks, Candle Timer, Fractals, ZigZag, Time Zone, Market S
63 USD
Advanced Supply Demand MT5
Bernhard Schweigert
4.36 (11)
Herhangi bir Acemi veya Uzman Tüccar için En İyi Çözüm! Bu gösterge benzersiz, yüksek kaliteli ve uygun fiyatlı bir ticaret aracıdır çünkü bir dizi tescilli özelliği ve yeni bir formülü bir araya getirdik. Bu güncelleme ile çift zaman dilimi dilimlerini gösterebileceksiniz. Yalnızca daha yüksek bir TF gösteremeyeceksiniz, aynı zamanda TF grafiğini ve ARTIK daha yüksek TF'yi de gösterebileceksiniz: YUVARLAK BÖLGELERİ GÖSTERMEK. Tüm Arz Talebi tüccarları buna bayılacak. :) Önemli Bilgiler Açıkland
199 USD
Blahtech Supply Demand MT5
Blahtech Limited
4.45 (11)
Supply Demand uses previous price action to identify potential imbalances between buyers and sellers. The key is to identify the better odds zones, not just the untouched ones. Blahtech Supply Demand indicator delivers functionality previously unavailable on any trading platform. This 4-in-1 indicator not only highlights the higher probability zones using a multi-criteria strength engine, but also combines it with multi-timeframe trend analysis, previously confirmed swings and engulfing detecto
142 USD
AW Trend Predictor MT5
Alexander Nechaev
5 (24)
Tek bir sistemde trend ve kırılma seviyelerinin kombinasyonu. Gelişmiş bir gösterge algoritması piyasa gürültüsünü filtreler, trendi, giriş noktalarını ve olası çıkış seviyelerini belirler. Gösterge sinyalleri, sinyal geçmişinin etkinliğini gösteren en uygun enstrümanların seçilmesine izin veren bir istatistiksel modüle kaydedilir. Gösterge Kâr Al ve Zararı Durdur işaretlerini hesaplar. Kılavuz ve talimatlar ->   BURAYA   / MT4 versiyonu ->   BURAYA Gösterge ile nasıl ticaret yapılır: Trend Pre
55 USD
Royal Wave Pro M5
Vahidreza Heidar Gholami
5 (2)
Royal Wave is a Trend-Power oscillator which has been programmed to locate and signal low-risk entry and exit zones. Its core algorithm statistically analyzes the market and generates trading signals for overbought, oversold and low volatile areas. By using a well-designed alerting system, this indicator makes it easier to make proper decisions regarding where to enter and where to exit trades. Features Trend-Power Algorithm Low risk Entry Zones and Exit Zones Predictions for Overbought and Over
129 USD
Matrix Arrow Indicator MT5
Juvenille Emperor Limited
5 (11)
Matrix Arrow Indicator MT5 ,   forex ,   emtialar ,   kripto   para birimleri ,   endeksler ,   hisse senetleri   gibi tüm sembollerde/araçlarda kullanılabilen   %100 yeniden boyamayan   çoklu zaman çerçevesi göstergesini izleyen benzersiz bir 10'u 1 arada trenddir.  Matrix Arrow Indicator MT5 , mevcut eğilimi erken aşamalarında belirleyecek ve aşağıdakiler gibi 10'a kadar standart göstergeden bilgi ve veri toplayacaktır: Ortalama Yönlü Hareket Endeksi (ADX) Emtia Kanal Endeksi (CCI) Klasik Hei
75 USD
Market Profile defines a number of day types that can help the trader to determine market behaviour. A key feature is the Value Area, representing the range of price action where 70% of trading took place. Understanding the Value Area can give traders valuable insight into market direction and establish the higher odds trade. It is an excellent addition to any system you may be using. Blahtech Limited presents their Market Profile indicator for the MetaTrader community. Inspired by Jim Dalton’s
142 USD
Stargogs Spike Catcher
Lorenzo Edward Beukes
5 (6)
Stargogs Spike Catcher V3 This Indicator is Developed To milk the BOOM and CRASH indices . Send me Message if you need any help with the indicator.  CHECK OUT THE STARGOGS SPIKE CATCHER EA/ROBOT V3: CLICK HERE ALSO CHECK OUT SECOND TO NONEFX SPIKE CATCHER:   CLICK HERE STARGOGS SPIKE CATCHER V3 WHATS NEW! Brand New Strategy. This is the Indicator you need for 2023. The Indicator Gives you an Entry at a time when conditions are met and you should use TP & SL. New Trendline that changes color in
100 USD
Royal Scalping Indicator M5
Vahidreza Heidar Gholami
5 (8)
Royal Scalping Indicator is an advanced price adaptive indicator designed to generate high-quality trading signals. Built-in multi-timeframe and multi-currency capabilities make it even more powerful to have configurations based on different symbols and timeframes. This indicator is perfect for scalp trades as well as swing trades. Royal Scalping is not just an indicator, but a trading strategy itself. Features Price Adaptive Trend Detector Algorithm Multi-Timeframe and Multi-Currency Trend Low
149 USD
Introduction to X3 Chart Pattern Scanner X3 Cherart Pattern Scanner is the non-repainting and non-lagging indicator detecting X3 chart patterns including Harmonic pattern, Elliott Wave pattern, X3 patterns, and Japanese Candlestick patterns. Historical patterns match with signal patterns. Hence, you can readily develop the solid trading strategy in your chart. More importantly, this superb pattern scanner can detect the optimal pattern of its kind. In addition, you can switch on and off individu
250 USD
Automated Trendlines MT5
Georgios Kalomoiropoulos
Trend çizgileri, forex ticaretinde en önemli teknik analiz aracıdır. Ne yazık ki, çoğu tüccar onları doğru şekilde çizmez. Otomatik Trend Çizgileri göstergesi, piyasaların trend hareketini görselleştirmenize yardımcı olan ciddi tüccarlar için profesyonel bir araçtır. İki tür Trend Çizgisi, Boğa Trend Çizgisi ve Ayı Trend Çizgisi vardır. Yükseliş trendinde, Forex trend çizgisi, fiyat hareketinin en düşük salınım noktalarından geçer. En az iki "en düşük düşük"ü birleştirmek, bir trend çiz
99 USD
Offer 249 down from 350 for the next 3 copies. then back to 350 $ Are you tired of using outdated indicators that leave you guessing where to set your profit targets? Look no further than the AK CAP Opening Range Breakout Indicator. This powerful tool is backed by a US patent and has already helped countless traders pass funded challenges like FTMO. We use it daily on our prop traders and internal funds, and now it's available to you as well. The calculation behind the indicator is incredibly
249 USD
Auto Order Block with break of structure Detect Break of Structure , Mark Order Block and draw Entry / Stop and Risk to Reward lines when Order block is touch by price with Alert. Trend is Manually set to filter signals in a direction by a button on the chart. Entry / Stop and Risk to Reward lines can also be switch on / off by button on chart. Futures Auto Mark Break of Structure Auto Mark Order block Auto Mark higher time frame Point Of  Interest ( POI ) Popup Alert when BoS , Order block
55 USD
Yeni Nesil Otomatik Arz ve Talep Bölgeleri. Her Grafikte Çalışan Yeni ve Yenilikçi Algoritma. Tüm Bölgeler Piyasanın Fiyat Hareketine Göre Dinamik Olarak Oluşturulmaktadır. İKİ TÜR UYARI --> 1) FİYAT BİR BÖLGEYE ÇIKTIĞINDA 2) YENİ BİR BÖLGE OLUŞTURDUĞUNDA Bir tane daha işe yaramaz gösterge almazsın. Kanıtlanmış Sonuçlarla eksiksiz bir Ticaret Stratejisi elde edersiniz.     Yeni özellikler:     Fiyat Arz/Talep Bölgesine ulaştığında uyarılar     Yeni bir Arz/Talep Bölgesi olu
149 USD
Italo Volume Indicator MT5
Italo Santana Gomes
5 (9)
BUY INDICATOR AND GET EA FOR FREE AS A BONUS + SOME OTHER GIFTS! ITALO VOLUME INDICATOR  is the best volume indicator ever created, and why is that? The Indicator works on all time-frames and assets, indicator built after 6 years of experience on forex and many other markets. You know many volume indicators around the internet are not complete, does not help, and it's difficult to trade, but the Italo Volume Indicator is different , the Italo Volume Indicator shows the wave volume, when market
65 USD
Gösterge Kılavuz  |     Owl Smart Levels stratejisi  | MT4  versiyonu  |  Nasıl kurulur?   |   FAQ Owl Smart Levels Indicator , Bill Williams'ın gelişmiş fraktalları , piyasanın doğru dalga yapısını oluşturan Valable ZigZag ve kesin giriş seviyelerini gösteren Fibonacci seviyeleri gibi popüler piyasa analiz araçlarını içeren tek gösterge içinde eksiksiz bir ticaret sistemidir. pazara ve kar elde edilecek yerlere. Ticaret sisteminin ayrıntılı bir açıklaması için Owl Trend Strategy - Smart Levels
97 USD
PZ Day Trading MT5
PZ TRADING SLU
2.6 (5)
This indicator detects price reversals in a zig-zag fashion, using only price action analysis and a donchian channel. It has been specifically designed for short-term trading, without repainting or backpainting at all. It is a fantastic tool for shrewd traders aiming to increase the timing of their operations. [ Installation Guide | Update Guide | Troubleshooting | FAQ | All Products ] Amazingly easy to trade It provides value on every timeframe It displays suitable SL and TP levels It impl
125 USD
Tired of plotting support and resistance lines? This is a multi-timeframe indicator that detects and plots supports and resistance lines in the chart with the same precision as a human eye would. As price levels are tested over time and its importance increases, the lines become thicker and darker, making price leves easy to glance and evaluate. [ Installation Guide | Update Guide | Troubleshooting | FAQ | All Products ] Boost your technical analysis Customizable timeframe selection Read pri
99 USD
Tricky to find and scarce in frequency, divergences are one of the most reliable trading scenarios. This indicator finds and scans for regular and hidden divergences automatically using your favourite oscillator. [ Installation Guide | Update Guide | Troubleshooting | FAQ | All Products ] Easy to trade Finds regular and hidden divergences Supports many well known oscillators Implements trading signals based on breakouts Displays suitable stop-loss and take-profit levels Configurable oscilla
125 USD
Wolfe Waves are naturally occurring trading patterns present in all financial markets and represent a fight towards an equilibrium price. These patterns can develop over short and long-term time frames and are one of the most reliable predictive reversal patterns in existence, normally preceding strong and long price movements. [ Installation Guide | Update Guide | Troubleshooting | FAQ | All Products ] Clear trading signals Amazingly easy to trade Customizable colors and sizes Implements perfo
99 USD
Relative Cyclicality
Cristian Mihail Pauna
The Relative Cyclicality indicator defines the cycles of any price evolution. This indicator is computed by applying the "Cyclicality" mathematical transformation to the classic Relative Strength Index indicator made by J. Welles Wilder. The Relative Cyclicality defines very good entry and exit trading signals near the minimal and maximal points. It is better than RSI itself due to the unicity of the minimal and maximal points on a specific time interval. The Relative Cyclicality indicator can b
300 USD
The Price Cyclicality indicator defines the cycles of any price evolution. It shows clearly the ascending and descending intervals with asymptotic evolution near the minimal and maximal price values. The Price Cyclicality indicator can be used to generate automated entry signals near the minimal price values. Also, the Price Cyclicality indicator can be used to define limit conditions to generate automated exit signals near the maximal price values. The efficiency of this indicator was proved du
300 USD
Forex BUY and SELL signals from the best Heiken Ashi Smoothed indicator. Draw bullish/bearish bars on the chart. Accurate trend detector. Heiken Ashi Smoothed is a simple MT5 indicator that draws bullish and bearish bars in the chart to reflect the direction of the trend. The indicator consists of orange bearish bars and green bullish bars. When the trend changes its direction, the indicator changes its color. The indicator is a modernization of the traditional Heiken Ashi indicator. Moving Aver
900 USD
Trade system "PAX Multi TMA/HMA 8" for MT5 it is a ready-made trading system for trading on any instrument and any timeframe. An experienced trader on one instrument can get a profit   from 100% to 400% per day . Completely ready for manual trading and use in robots. Not redrawn signals. It is convenient to work on any timeframe. Tested on metals, currency pairs, oil, international stocks, Russian stocks, cryptocurrencies, monetary and cryptocurrency indices. What the trading sy
144 USD
Pivot Prof
Paul Anscombe
4.98 (43)
Our 5 Star Best Seller Beginner or Professional our best selling multi-timeframe Pivot Prof will enhance your trading and bring you great trade opportunities with the Support and Resistance levels that professionals use. Pivot trading is a simple effective method for entering and exiting the market at key levels and has been used by professionals for decades and works on all symbols: Forex, Crypto, Stocks, Indicies etc. Pivot Prof brings premium levels to the trader where the market is most like
69 USD
"The Squeeze indicator attempts to identify periods of consolidation in a market. In general the market is either in a period of quiet consolidation or vertical price discovery. By identifying these calm periods, we have a better opportunity of getting into trades with the potential for larger moves. Once a market enters into a "squeeze," we watch the overall market momentum to help forecast the market direction and await a release of market energy." The Modified TTM Squeeze Indicator is a modi
149 USD
Place price Alerts   on  extended  Rectangles   and   Trendlines -  Risk reward indicator mt5 Extend Rectangles & Trendlines to the right edge Mark your supply demand zones with extended rectangle and draw support resistance lines with extended trendline. Find detailed manuals   here .  Find contacts on my   profile . MT4 Rectangle extender indicator will simplify and make it easier for you to analyze markets and stay notified about important events. When you extend rectangle or trendline the a
59 USD
Predictor PRO MT5
Evgenii Aksenov
5 (1)
A new generation progressive indicator from INFINITY. Predictor PRO uses its own entry and exit calculation strategy. Indicator without redrawing signals! This is very important for real trading. The indicator can be used for any currency pairs, metals, cryptocurrencies or indices. The best time of the H1 chart. Unlike other indicators, Predictor PRO shows shows the Buy/Sell entry point and the Close exit point. Calculating the profit of all signals in points on the panel helps to choose th
75 USD
Use of support and resistance in systematic trading is very subjective. Every trader has their own idea and way to plotting the support and resistance levels on the chart. KT Support and Resistance indicator take out this ambiguity out of the situation and automatically draws support and resistance levels following an algorithmic approach using a unique multi-timeframe analysis. When launched on the chart, It immediately scan the most significant extreme points across all the available timefr
120 USD
Yazarın diğer ürünleri
Trend Screener Pro MT5
STE S.S.COMPANY
4.97 (36)
Trend Göstergesi, Trend Alım Satım ve Filtreleme için Çığır Açan Benzersiz Çözüm, Tüm Önemli Trend Özellikleriyle Tek Bir Araç İçinde Yerleştirildi! Forex, emtialar, kripto para birimleri, endeksler ve hisse senetleri gibi tüm sembollerde/araçlarda kullanılabilen %100 yeniden boyamayan çoklu zaman çerçevesi ve Çoklu para birimi göstergesidir. Trend Screener, grafikte noktalarla ok trend sinyalleri sağlayan etkili bir trend trend göstergesidir. Trend analizörü göstergesinde bulunan özellikler: 1.
50 USD
Trend Screener
STE S.S.COMPANY
4.75 (57)
Trend Göstergesi, Trend Alım Satım ve Filtreleme için Çığır Açan Benzersiz Çözüm, Tüm Önemli Trend Özellikleriyle Tek Bir Araç İçinde Yerleştirildi! Forex, emtialar, kripto para birimleri, endeksler ve hisse senetleri gibi tüm sembollerde/araçlarda kullanılabilen %100 yeniden boyamayan çoklu zaman çerçevesi ve Çoklu para birimi göstergesidir. Trend Screener, grafikte noktalarla ok trend sinyalleri sağlayan etkili bir trend trend göstergesidir. Trend analizörü göstergesinde bulunan özellikler: 1.
50 USD
PR destek veya direnç seviyeleri, bir piyasanın fiyat hareketi tersine döndüğünde ve yön değiştirerek piyasada bir tepe veya dip (dönüş noktası) geride bıraktığında oluşur. Destek ve direnç seviyeleri ticaret aralıklarını ortaya çıkarabilir. Gösterge, gösterge setinde tanımlanan X çubuk miktarına ( Dönem ) dayalı olarak Yüksek Salınım ve Düşük Salınım tanımlar. Not : Fiyat hareket göstergemizi beğendiyseniz, Hepsi Bir Arada Trend Göstergemizi deneyin (Trend Tarayıcı, Trend Çizgisi, Güçlü
FREE
Trend Monitor for MT4
STE S.S.COMPANY
4.44 (54)
Trend Monitor, trend ve volatilite analizörü göstergesini analiz eden özel bir MT4 ( Metatrader 4) göstergesidir. Ayrıca, çoğu döviz çifti ve zaman dilimi için geçerli olan trendin başlangıcını ve sonunu tanımlar. Trend Monitör göstergesi, trend oynaklığını hesaplamak için hareketli ortalama açıya dayalı optimize edilmiş bir formül kullanıyor. İyi ve güvenilir bir destek ve direnç göstergesi mi arıyorsunuz, Hepsi Bir Arada seviye göstergemizi deneyin (Geri Çekme Bölgeleri, Güçlü Destek/Direnç
FREE
Support And Resistance Screener, MetaTrader için tek bir gösterge içinde birden fazla araç sağlayan tek bir Düzey göstergesindedir. Kullanılabilir araçlar şunlardır: 1. Piyasa Yapısı Eleme Aracı. 2. Geri Çekilme Bölgesi Boğa. 3. Geri Çekilme Bölgesi Ayı. 4. Günlük Pivot Noktaları 5. haftalık Pivot Noktaları 6. aylık Pivot Puanları 7. Harmonik Modele ve hacme dayalı Güçlü Destek ve Direnç. 8. Banka Seviyesi Bölgeleri. SINIRLI SÜRELİ TEKLİF : YG Destek ve Direnç Göstergesi sadece 50 $ ve ömür boy
50 USD
Support And Resistance Screener, MetaTrader için tek bir gösterge içinde birden fazla araç sağlayan tek bir Düzey göstergesindedir. Kullanılabilir araçlar şunlardır: 1. Piyasa Yapısı Eleme Aracı. 2. Geri Çekilme Bölgesi Boğa. 3. Geri Çekilme Bölgesi Ayı. 4. Günlük Pivot Noktaları 5. haftalık Pivot Noktaları 6. aylık Pivot Puanları 7. Harmonik Modele ve hacme dayalı Güçlü Destek ve Direnç. 8. Banka Seviyesi Bölgeleri. SINIRLI SÜRELİ TEKLİF : YG Destek ve Direnç Göstergesi sadece 50 $ ve ömür boyu
50 USD
Göstergemiz, aynı anda birden fazla çiftin yayılmasını izlemek için bir yayılma ayırıcı sağlar ve ayrıca bir mum zamanlayıcı geri sayımı, mevcut çubuk kapanmadan ve yeni bir çubuk oluşmadan önce kalan süreyi görüntüler. SINIRLI SÜRELİ TEKLİF: Tüm premium göstergelerimiz sadece 50$ karşılığında mevcuttur, MQL5 blogumuza erişerek premium göstergelerimizin tüm ayrıntılarını bulacaksınız.   Buraya Tıkla. Ana Özellikler Aynı anda yayılan çoklu çiftleri izleyin. Yerel saati değil, sunucu saatini
FREE
Xmaster Formula for MT5
STE S.S.COMPANY
4.25 (8)
Xmaster formül göstergesi trendi analiz eder. Ayrıca, çoğu döviz çifti ve zaman diliminde işe yarayan alım satım sinyalleri üretir. Sonuç olarak, bir volatilite analizörü ve Çoklu zaman çerçevesi analizi ekleyerek Xmaster formülünü daha doğru olacak şekilde optimize ettik. SINIRLI SÜRELİ TEKLİF: Tüm premium göstergelerimiz sadece 50$ karşılığında mevcuttur, MQL5 blogumuza erişerek premium göstergelerimizin tüm ayrıntılarını bulacaksınız.   Buraya Tıkla. Anahtar özellik Gösterge, ana işl
FREE
Trend Line Map Pro
STE S.S.COMPANY
4.69 (13)
Trend Line Map indicator is an addons for Trend Screener Indicator . It's working as a scanner for all signals generated by Trend screener ( Trend Line Signals ) . It's a Trend Line Scanner based on Trend Screener Indicator.  If you don't have Trend Screener Pro Indicator, the Trend Line Map Pro will not work. LIMITED TIME OFFER : Trend Line Map Indicator is available for only 50 $ and lifetime. ( Original price 125$ ) By accessing to our MQL5 Blog,  you can find all our premium indicators w
50 USD
Trend Monitor for MT5
STE S.S.COMPANY
4.44 (18)
Trend Monitor, trend ve volatilite analizörü göstergesini analiz eden özel bir MT4 ( Metatrader 4) göstergesidir. Ayrıca, çoğu döviz çifti ve zaman dilimi için geçerli olan trendin başlangıcını ve sonunu tanımlar. Trend Monitör göstergesi, trend oynaklığını hesaplamak için hareketli ortalama açıya dayalı optimize edilmiş bir formül kullanıyor. İyi ve güvenilir bir destek ve direnç göstergesi mi arıyorsunuz, Hepsi Bir Arada seviye göstergemizi deneyin (Geri Çekme Bölgeleri, Güçlü Destek/Direnç
FREE
Boom ve Crash Spike Detector göstergesi, öncelikli olarak fiyatlardaki Boom ve Crash'i tespit etmek için gelişmiş bir stratejiye dayalı olarak kodlanmıştır. Fiyatlardaki yüksek olasılıklı Boom'ları ve Crash'leri tespit etmek için karmaşık algoritmalar yerleştirildi. Olası Patlama veya kilitlenme aşamalarında uyarı verir: Boom Phase: Fiyat çok hızlı arttığında. Çökme Aşaması: Fiyat çok hızlı düştüğünde. SINIRLI SÜRELİ TEKLİF: Gösterge yalnızca 50 $ ve ömür boyu kullanılabilir. (Orijinal fiyat 1
50 USD
Göstergemiz, aynı anda birden fazla çiftin yayılmasını izlemek için bir yayılma ayırıcı sağlar ve ayrıca bir mum zamanlayıcı geri sayımı, mevcut çubuk kapanmadan ve yeni bir çubuk oluşmadan önce kalan süreyi görüntüler. SINIRLI SÜRELİ TEKLİF: Tüm premium göstergelerimiz sadece 50$ karşılığında mevcuttur, MQL5 blogumuza erişerek premium göstergelerimizin tüm ayrıntılarını bulacaksınız. Buraya Tıkla. Ana Özellikler Aynı anda yayılan çoklu çiftleri izleyin. Yerel saati değil, sunucu saatini iz
FREE
Ortalama Günlük Aralık, belirli sayıda periyot üzerinden ölçülen bir Forex çiftinin ortalama pip aralığını gösterir. Yatırımcılar, ortalama günlük hareketin dışındaki potansiyel fiyat hareketini görselleştirmek için ADR'yi kullanabilir. ADR ortalamanın üzerinde olduğunda, günlük oynaklığın normalden daha yüksek olduğu anlamına gelir, bu da döviz çiftinin normunun ötesine geçebileceği anlamına gelir. ADR Analizörümüz 5 ana özellikten oluşmaktadır: Aralık ( ADR ) Screener: Çoklu para birimi ADR
50 USD
Yüksek Yüksek ve Düşük Alçak modelinin kişisel bir uygulaması. Tüccar piyasaya girmeli veya oluşturduğumuz piyasa yönünde işlem aramalı ve bu Yüksek-Yüksek ve Düşük-Düşük modelini daha doğru olması için optimize etmelidir. Piyasa yapısı temel olarak 2 önemli kalıptan oluşur: Daha Yüksek Yüksek: Fiyat daha yüksek bir seviyeye ulaştığında ve fiyat bu kalıba göre artmaya devam ettiğinde. Düşük Düşük: Fiyat daha düşük bir dip yaptığında ve fiyat bu kalıba göre düşmeye devam ettiğinde. Gösterge,
50 USD
Xmaster formül göstergesi trendi analiz eder. Ayrıca, çoğu döviz çifti ve zaman diliminde işe yarayan alım satım sinyalleri üretir. Sonuç olarak, bir volatilite analizörü ve Çoklu zaman çerçevesi analizi ekleyerek Xmaster formülünü daha doğru olacak şekilde optimize ettik. SINIRLI SÜRELİ TEKLİF: Tüm premium göstergelerimiz sadece 50$ karşılığında mevcuttur, MQL5 blogumuza erişerek premium göstergelerimizin tüm ayrıntılarını bulacaksınız. Buraya Tıkla. Anahtar özellik Gösterge, ana işlem
FREE
A tool that analyzes the trades performance and gives all necessary ratios to analyze accounts history. Trade Analyzer for MT4 has 2 main features :  Display Account Analysis in the main chart with a screener. Generate CSV document with all closed trades performance.  LIMITED TIME OFFER : Trades Analyzer is available for only 50 $ and lifetime. ( Original price 125$ ) Key features Screener to Display Trades Performance. Analyze Trades Per Magic Number, Per Symbol or Per Comments. Export t
50 USD
This indicator is intended to assist in the backtesting process. It can be used to highlight time zone session   based on your time setting   in which you are either asleep or away from your charts, or intraday trading sessions that you want to trade. It will help you to monitor the market move during a period of time. Key features Selecting trading zone time ( Beginning and ending time ) Highlight the trading zone ( Highest High and Lowest low of that specified session ) 100% free indicator
FREE
Boom ve Crash Spike Detector göstergesi, öncelikli olarak fiyatlardaki Boom ve Crash'i tespit etmek için gelişmiş bir stratejiye dayalı olarak kodlanmıştır. Fiyatlardaki yüksek olasılıklı Boom'ları ve Crash'leri tespit etmek için karmaşık algoritmalar yerleştirildi. Olası Patlama veya kilitlenme aşamalarında uyarı verir: Boom Phase: Fiyat çok hızlı arttığında. Çökme Aşaması: Fiyat çok hızlı düştüğünde. SINIRLI SÜRELİ TEKLİF: Gösterge yalnızca 50 $ ve ömür boyu kullanılabilir. (Orijinal fiyat 1
50 USD
This indicator is intended to assist in the backtesting process. It can be used to highlight time zone session based on your time setting in which you are either asleep or away from your charts, or intraday trading sessions that you want to trade. It will help you to monitor the market move during a period of time. Key features Selecting trading zone time ( Beginning and ending time ) Highlight the trading zone ( Highest High and Lowest low of that specified session ) 100% free indicator. Wor
FREE
Her tüccar, ticaret başına asla %5'ten (veya %7) fazla risk almaması gerektiğini bilir.  Bu bir Para Yönetimi yasasıdır ve bir tüccarın farklı ticaret seviyeleri için farklı bir StopLoss değeri kullanması gerektiğinden, her seferinde kullanılabilir bir LotSize hesaplanmalıdır. Bu gösterge, grafiğe koyacağınız an için uygun bir LotSize hesaplayacak ve her seferinde "Zararı Durdurma Çizgisini" herhangi bir yöne sürükleyeceksiniz. SINIRLI SÜRELİ TEKLİF: Tüm premium göstergelerimiz sadece 50$ k
50 USD
Ortalama Günlük Aralık, belirli sayıda periyot üzerinden ölçülen bir Forex çiftinin ortalama pip aralığını gösterir. Yatırımcılar, ortalama günlük hareketin dışındaki potansiyel fiyat hareketini görselleştirmek için ADR'yi kullanabilir. ADR ortalamanın üzerinde olduğunda, günlük oynaklığın normalden daha yüksek olduğu anlamına gelir, bu da döviz çiftinin normunun ötesine geçebileceği anlamına gelir. ADR Analizörümüz 5 ana özellikten oluşmaktadır: Aralık ( ADR ) Screener: Çoklu para birimi ADR
50 USD
Currency Strength Meter, gives you a quick visual guide to which currencies are currently strong, and which ones are weak. The meter measures the strength of all forex cross pairs and applies calculations on them to determine the overall strength for each individual currency. We calculate based the strength of currency based on the trend of 28 pairs. By accessing to our MQL5 Blog,  you can download the   Demo   Version of the indicator. Try it before you buy ,without the Metatrader Tester rest
50 USD
Oynaklık analizörü, sıkı bir ticaret aralığında konsolide edildikten sonra fiyatın güçlü bir şekilde kırılma eğiliminden yararlanan bir momentum göstergesidir. Gösterge ayrıca, sıkıştırma tetiklendiğinde hareketin beklenen yönünü göstermek için bir momentum osilatörü kullanır. Bu histogram sıfır çizgisi etrafında salınır, sıfır çizgisinin üzerinde artan momentum uzun satın alma fırsatını gösterirken, sıfır çizgisinin altına düşen momentum bir kısa devre fırsatını gösterebilir. SINIRLI SÜRELİ
50 USD
Her tüccar, ticaret başına asla %5'ten (veya %7) fazla risk almaması gerektiğini bilir.  Bu bir Para Yönetimi yasasıdır ve bir tüccarın farklı ticaret seviyeleri için farklı bir StopLoss değeri kullanması gerektiğinden, her seferinde kullanılabilir bir LotSize hesaplanmalıdır. Bu gösterge, grafiğe koyacağınız an için uygun bir LotSize hesaplayacak ve her seferinde "Zararı Durdurma Çizgisini" herhangi bir yöne sürükleyeceksiniz. SINIRLI SÜRELİ TEKLİF: Tüm premium göstergelerimiz sadece 50$ k
50 USD
Pin Bar Dedektörü, grafikte Pin Bar fiyat hareket modelini bulan bir göstergedir. Pin Barlar, Dragon Fly Doji, Grave Stone Doji, Hammer, Inverted-Hammer, Hanging Man ve Shooting Star gibi uzun üst veya alt gölgeli ve çok küçük gövdeli Japon şamdanlarına alternatif olan klasik bir çubuk deseni olan "Pinokyo Çubukları" için bir kısayoldur. . SINIRLI SÜRELİ TEKLİF : Gösterge sadece 50 $ ve ömür boyu kullanılabilir. (Orijinal fiyat 125$ ) Ana Özellikler Boğa Pin Bar Dedektörü. Ayı Çubuğu Dedekt
50 USD
Oynaklık analizörü, sıkı bir ticaret aralığında konsolide edildikten sonra fiyatın güçlü bir şekilde kırılma eğiliminden yararlanan bir momentum göstergesidir. Gösterge ayrıca, sıkıştırma tetiklendiğinde hareketin beklenen yönünü göstermek için bir momentum osilatörü kullanır. Bu histogram sıfır çizgisi etrafında salınır, sıfır çizgisinin üzerinde artan momentum uzun satın alma fırsatını gösterirken, sıfır çizgisinin altına düşen momentum bir kısa devre fırsatını gösterebilir. SINIRLI SÜRELİ
50 USD
Currency strength meter gives you a quick visual guide to which currencies are currently strong, and which ones are weak. The meter measures the strength of all forex cross pairs and applies calculations on them to determine the overall strength for each individual currency.We calculate based the strength of currency based on the trend of 28 pairs. LIMITED TIME OFFER : Trend CSM Indicator is available for only 50 $. ( Original price 125$ ) By accessing to our MQL5 Blog,  you can find all our
50 USD
Pin Bar Dedektörü, grafikte Pin Bar fiyat hareket modelini bulan bir göstergedir. Pin Barlar, Dragon Fly Doji, Grave Stone Doji, Hammer, Inverted-Hammer, Hanging Man ve Shooting Star gibi uzun üst veya alt gölgeli ve çok küçük gövdeli Japon şamdanlarına alternatif olan klasik bir çubuk deseni olan "Pinokyo Çubukları" için bir kısayoldur. . SINIRLI SÜRELİ TEKLİF : Gösterge sadece 50 $ ve ömür boyu kullanılabilir. (Orijinal fiyat 125$ ) Ana Özellikler Boğa Pin Bar Dedektörü. Ayı Çubuğu Dedekt
50 USD
Filtre:
T.J.Sch_318798
156
T.J.Sch_318798 2023.03.02 18:33 
 

This indicator is excellent. It greatly helps you to identify great teading oportunities & trend predictor helps correctly predict the trend and avoid traps. The service provided by Sayadi is amazing. This & trend predictor are excellent choice for having great - safe trading.

pdev
550
pdev 2023.02.06 08:35 
 

Great indicator and an indispensable add-on for trend screener indicator. Very helpful and responsive seller

Johan Ferdianto
135
Johan Ferdianto 2022.03.05 18:35 
 

I already have version for MT4, I complete for MT5 too. Great job, good Indicator

Maungfortrading
229
Maungfortrading 2022.02.08 14:15 
 

Best Indicator !!

caichenyi
106
caichenyi 2021.09.06 14:51 
 

I try to run `Trend Screener Pro` and `Trend Line Map` in MT5 at the same time. It can only run for a short time about 15 mins, then the 2 Indicators wouldn't update and the Chart will freeze.

If I close `Trend Line Map`, it works normally.

please help to check this issue. this issue block uses these indicators.

Besides, It's only V5.10, the version is so low than MT4(Trend Line Map).

STE S.S.COMPANY
423857
Geliştiriciden yanıt Sayadi Achraf 2021.09.09 18:26
Hi sir. Thank you for your review. You can't attach 2 screeners in the same chart, you need to have one screener per chart sir. Example :
1. Chart 1 => Trend Screener Pro
2. Chart 2 => Trend Line Map Pro. In this way, you can run both 2 indicators sir to analyze the trend, sir. Please if you have any questions, feel free to contact me, sir. Imporant Note :
- MT4 version is faster because MT4 is much faster in managing multi-currencies data than MT5 sir. - Please make sure that you have historical data available to make the indicator much faster in loading signals. It's a signal calculator and not a simple indicator sir. Best regards.
SAYADI Ashref.
Crypto King
177
Crypto King 2021.01.17 09:08 
 

Another Great product from Mr. Sayadi ! Thank you.

STE S.S.COMPANY
423857
Geliştiriciden yanıt Sayadi Achraf 2021.01.17 09:30
Thx u sir.
İncelemeye yanıt
Sürüm 6.20 2023.01.13
1. Improve indicator performance and calculation speed.
2. Add the Update Frequency parameter in seconds.
Sürüm 6.11 2022.04.27
1. Optimizing indicator speed for low computer CPU.
Sürüm 6.0 2021.09.22
1. Fixing issue of wrong signals based Trend Screener Pro Indicator.
2. Optimizing the indicator to the last MT5 versions to make more faster.
------------------

Highly recommended to upgrade to the last version of the Trend Line Map indicator.