True Currency Strength Meter

发生了重大变化。参数说明将被更改。期待 6 月底之前的另一个更新。


最终更新后价格会上涨。


带有电子邮件和短信推送通知的真正货币计!

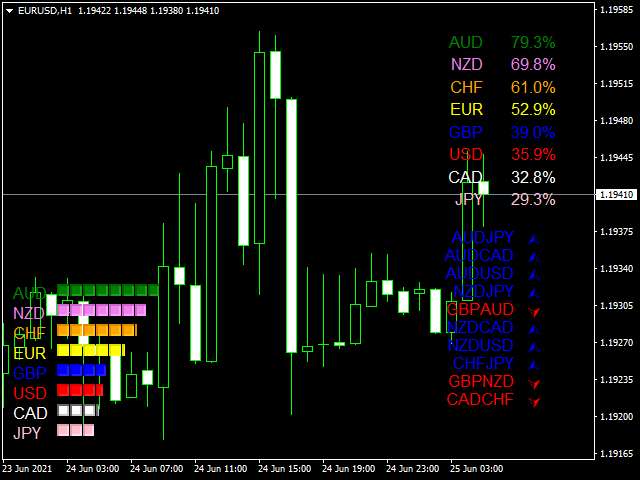
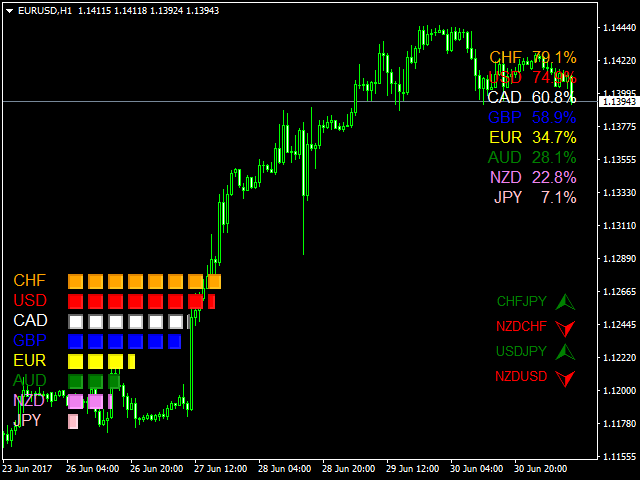
您有没有想过为什么有些货币对会比其他货币对波动更大,而 EURGBP 的 100 点大于 EURUSD 的 100 点?而在新闻中,有些会移动 200 点,但有些只会移动 150 点?这是新开发的“28对”真实货币强度计的关键。

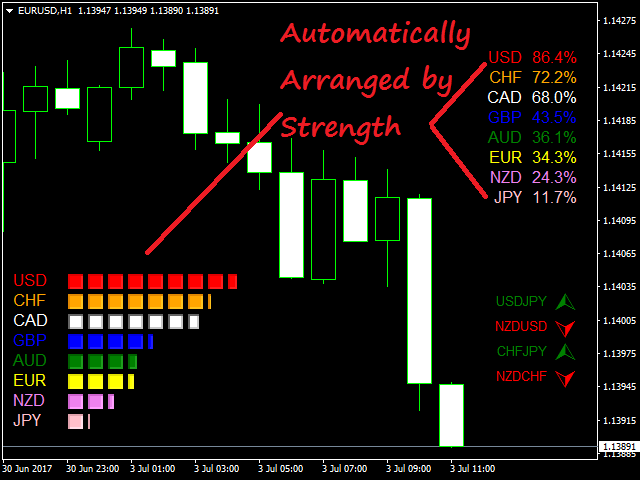
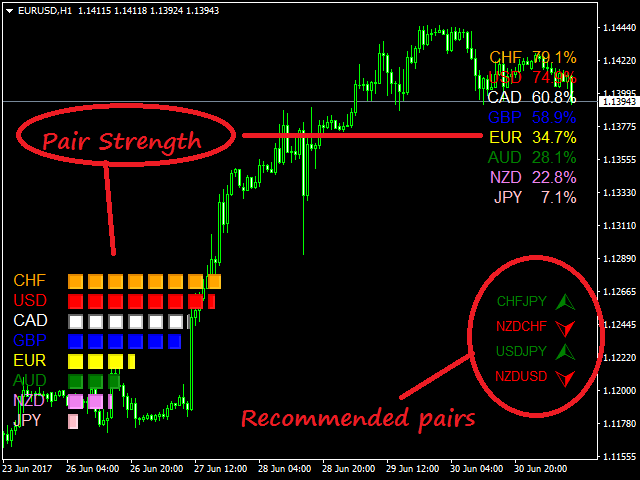
人们必须知道所有对都是唯一的并且彼此不同。英镑和日元货币对通常移动得如此之快,但其他货币对则不然。这是我的 TRUE CURRENCY METER 的关键,用于平衡这 8 种主要货币的新计算。鉴于每一对都有不同的行为,他们都根据他们的市场走势进行了平衡,这基本上是基于 PIPS。典型的货币强度计甚至没有考虑到“EURGBP”的 100 点值可能与“欧元兑美元”的 100 点值不同。但是这个新的货币强度计将计算提升到一个新的水平,其中所有“28 对”都以相同的基数计算,只是为了获得每种货币的真实强度。其中,真正的货币计的关键是“平衡货币强度计”。


参数

  • 时间范围 - 从 M1 到每月选择您想要的时间范围
  • 周期 - 输入从 0 到无限的数字,如 五、十、一百、一千 以检查周期,*注意:输入“0”(零)表示您当前的蜡烛。示例:D1 周期为 0 表示当日蜡烛图的强度。
  • 货币颜色
  • 对象 - 编辑右上角的百分比和货币之间的空间。
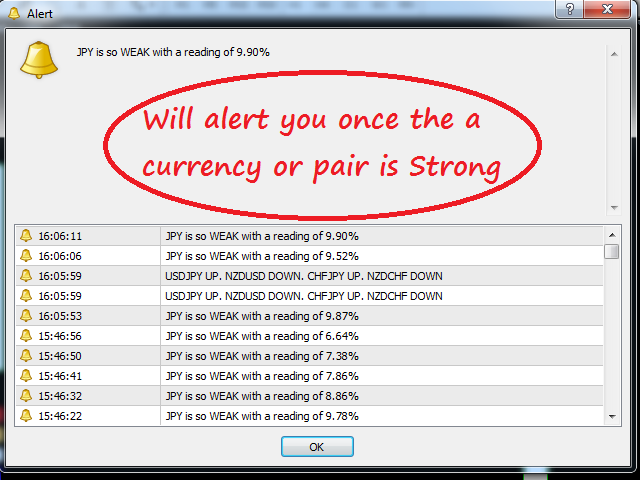
  • 警报类型
  • 声音警报
  • 警报设置
推荐产品
M5 时间框架的机器人黄牛。交易 GBPUSD 货币对。该机器人是由一家专业交易商公司专门开发的,用于英镑交易。机器人每天大约打开 5 到 15 笔交易。最好与英镑兑美元点差低至 10 点的经纪商进行交易。建议的最低存款为 500 美元或更多。 优点: 不使用鞅。 不是网。 每笔交易都有止损。 专门针对 GBPUSD 对的专业机器人。 机器人黄牛,在 M5 时段进行盘中交易。 这个机器人如何交易? 为了分析市场,机器人使用两个指标的价格模型和战略市场模式:抛物线止损和反转系统以及布林带。机器人首先使用价格内插统计分析市场的价格变动。接下来,机器人读取这些指标并比较它们现在和过去的运动趋势。如果存在表明市场反转或回滚的模式巧合,那么机器人将进行交易。机器人将根据余额大小按比例计算每笔交易的手数。交易者可以使用“Percentage_of_lots”参数调整该比例。机器人开始交易后,它开始通过修改追踪止损来伴随它。此外,每笔交易都有自己的止损,设置为限制可能的损失。 机器人规格: 时间范围(期间) M5 货币对 GBPUSD 存款 500 美元起 建议点差高达 10 点。 建议:
History Pattern Search
Yevhenii Levchenko
该指标建立当前报价,可以与历史报价进行比较,并在此基础上进行价格走势预测。指示器有一个文本字段,用于快速导航到所需日期。 选项: 符号 - 选择指标将显示的符号; SymbolPeriod - 选择指标从中获取数据的时段; IndicatorColor - 指示器颜色; HorisontalShift - 由指标绘制的报价移动指定的柱数; Inverse - true 反转引号,false - 原始视图; ChartVerticalShiftStep - 图表垂直移动(键盘上的向上/向下箭头); 接下来是文本字段的设置,您可以在其中输入日期,您可以通过按“回车”立即跳转到该日期。 接下来是文本字段的设置,您可以在其中输入日期,您可以通过按“回车”立即跳转到该日期。
Forex Gump
Andrey Kozak
2.4 (5)
Forex Gump is a fully finished semi-automatic trading system. In the form of arrows, signals are displayed on the screen for opening and closing deals. All you need is to follow the instructions of the indicator. When the indicator shows a blue arrow, you need to open a buy order. When the indicator shows a red arrow, you need to open a sell order. Close orders when the indicator draws a yellow cross. In order to get the most effective result, we recommend using the timeframes H1, H4, D1. There
Step into the world of Forex trading with confidence, clarity, and precision using   Gold Indicator   a next-generation tool engineered to take your trading performance to the next level. Whether you’re a seasoned professional or just beginning your journey in the currency markets, Gold Indicator equips you with powerful insights and help you trade smarter, not harder. Built on the proven synergy of three advanced indicators, Gold Indicator focuses exclusively on medium and long-term trends eli
Chinetti pip collector XL is a complete turnkey trading system. If a trader does not yet have his own trading system, he can apply Chinetti pip collector XL to trading. Trading with this indicator is very easy. Even a beginner in Forex can handle it. Trading rules: wait for the indicator to start drawing a blue line. This means that the price trend is starting now. Now we are waiting for the indicator to analyze the market and draw an up arrow on the chart. At this point, we open a buy order.
Trend PA
Mikhail Nazarenko
5 (3)
The Trend PA indicator uses   Price Action   and its own filtering algorithm to determine the trend. This approach helps to accurately determine entry points and the current trend on any timeframe. The indicator uses its own algorithm for analyzing price changes and Price Action. Which gives you the advantage of recognizing, without delay, a new nascent trend with fewer false positives. Trend filtering conditions can be selected in the settings individually for your trading style. The indicator
The Time_Price_SQ9_Degree indicator is based on the 9 Gann square. Using this indicator, you can identify strong time and price zones. The indicator displays the levels as a degree value. The degrees can be set in the settings. After launching, the MENU button appears. If it is highlighted, it can be moved to any point on the graph, and after double-clicking on it, it stops being highlighted and menu buttons appear. To hide the menu, just double-click on the button, it will become highlighted a
MA Alignment Scanner
Benedict Jamora
5 (1)
This indicator scans and displays currency pairs that have recently aligned moving averages on a given timeframe. You can configure which pairs the indicator will scan. It also includes all types of alert options. Bullish MA Alignment =  MA1>MA2>MA3>MA4>MA5 Bearish MA Alignment =  MA1<MA2<MA3<MA4<MA5 Features Attach to one chart and scans all the currency pairs configured and visible in the Market Watch Window It can monitor all the available timeframes from M1 to MN1 and sends alerts on every
VR Cub
Vladimir Pastushak
VR Cub 这是获得高质量切入点的指标。该指标的开发是为了促进数学计算并简化对仓位入场点的搜索。多年来,该指标所针对的交易策略已被证明其有效性。交易策略的简单性是其巨大的优势,即使是新手交易者也能成功进行交易。 VR Cub 计算开仓点以及获利和止损目标水平,这显着提高了效率和易用性。查看使用以下策略进行交易的屏幕截图,了解简单的交易规则。 设置、设置文件、演示版本、说明、问题解决,可以从以下位置获取 [博客] 您可以在以下位置阅读或撰写评论 [关联] 版本为 [MetaTrader 5] 计算入场点的规则 开仓 要计算入场点,您需要将 VR Cub 工具从最后一个高点拉伸到最后一个低点。 如果第一个点在时间上早于第二个点,交易者等待柱线收于中线上方。 如果第一个点在时间上晚于第二个点,交易者等待柱线收于中线下方。 根据上述条件,严格在 柱线收盘 后建仓。 换句话说,如果我们在小时图上进行交易,那么从最高点到最低点的时间距离必须超过24小时,最高点和最低点之间的点数必须大于或等于平均价格变动每天。 维持和改变市场地位 可以有多个未平仓头寸;每个头寸都可以单独修改。 VR Cub
Quantum Currency Strength Indicator
QUANTUM TRADING SOFTWARE LIMITED
Your success as a forex trader depends on being able to identify when a currency or currency pair is oversold or overbought. If it is strong or weak. It is this concept which lies at the heart of forex trading. Without the Quantum Currency Strength indicator, it is almost impossible. There are simply too many currencies and too many pairs to do this quickly and easily yourself. You need help! The Quantum Currency Strength indicator has been designed with one simple objective in mind. To give you
Gold Titan King Scalper
Dodong Christian Arnon
Indicator Description GOLD TITAN KING SIGNAL INDICATOR High-Precision Gold Scalping Buy/Sell Signals – Manual Trading Assistant Overview The Gold Titan King Signal Indicator is a manual trading assistant tool designed for high-frequency scalping on Gold (XAUUSD) and other major pairs. It generates clear BUY/SELL signals with precise entry levels, along with adjustable Stop Loss and Take Profit levels displayed directly on the chart. ️ This tool is NOT an EA. It does not execute trades
Nostradamix
Andrey Kozak
5 (1)
The "Nostradamix" indicator is designed to analyze short-term market movements on lower timeframes (e.g., M1), while simultaneously considering trend direction on higher timeframes (e.g., M30). This tool identifies key trend reversal points, displays volatility levels, and generates buy/sell signals based on market dynamics. The indicator automatically plots: Current trend lines. Volatility bands to assess movement strength. Visual markers (arrows) for entry signals. Forecast Accuracy and Mathem
Owl smart levels
Sergey Ermolov
4.24 (37)
MT5版本  |  FAQ Owl Smart Levels Indicator   是一個完整的交易系統,包含   Bill Williams   的高級分形、構建正確的市場波浪結構的 Valable ZigZag 以及標記準確入場水平的斐波那契水平等流行的市場分析工具 進入市場和地方獲利。 策略的详细说明 指示灯使用说明 顾问-贸易猫头鹰助手助理 私人用户聊天 ->购买后写信给我,我会将您添加到私人聊天中,您可以在那里下载所有奖金 力量在於簡單! Owl Smart Levels   交易系統非常易於使用,因此適合專業人士和剛開始研究市場並為自己選擇交易策略的人。 策略和指標中沒有隱藏的秘密公式和計算方法,所有策略指標都是公開的。 Owl Smart Levels 允許您快速查看進入交易的信號,突出顯示下訂單的水平並向您發送有關已出現信號的通知。 優點很明顯: 清楚地顯示主要和更高時間框架的趨勢方向。 指示儀器信號的出現。 標記開單、止損設置和固定利潤的水平。 沒有多餘的,只有必要的結構! ZigZag   表示全球趨勢的方向,因此也表示貿易方向。 市場反轉點的短線清楚地表明在什
Volume Confirm Trend Zone is the indicator for filtering sideways and confirm trend to help your system trading. Indicator can use every currency pairs, every time frame, and every broker. You can see trend zone when color to change in volume indicator. Features When the color changes to the blue: Buy Zone is a strong trend. When the color changes to the red: Sell Zone is a strong trend.
Advance Currency Meter is a currency meter that detects strong market trends. This indicator is good for scalping, intraday trading and swing trading. The indicator will detect short term to long term market trends. This will give you good insight which currencies are best to trade as of the moment. Note : Kindly contact me before you make any purchases. This won't work on your account without my permission. Note :   Works well with my MACD Currency Strength Meter
Noize Absorption Index MT4
Ekaterina Saltykova
5 (1)
Noize Absorption Index - is the manual trading system that measures the difference of pressure between bears forces and bulls forces. Green line - is a noize free index that showing curent situation. Zero value of index shows totally choppy/flat market.Values above zero level shows how powerfull bullish wave is and values below zero measures bearish forces.Up arrow appears on bearish market when it's ready to reverse, dn arrow appears on weak bullish market, as a result of reverse expectation. S
PipFinite Breakout EDGE
Karlo Wilson Vendiola
4.93 (487)
The Missing Edge You Need To Catch Breakouts Like A Pro. Follow a step-by-step system that detects the most powerful breakouts! Discover market patterns that generate massive rewards based on a proven and tested strategy. Unlock Your Serious Edge Important information here www.mql5.com/en/blogs/post/723208 The Reliable Expert Advisor Version Automate Breakout EDGE signals using "EA Breakout EDGE" Click Here Have access to the game changing strategy that will take your trading to the next l
Magic Balance
Daniil Evstratenko
The indicator shows which trading pairs, strategies, robots and signals that you use are profitable and which are not. The statistic of trades and balance graph are displayed in the account currency and pips - to switch simply click on the graph. button "$"(top left) - minimize/expand and move the indicator panel button ">"(bottom right) - stretching and resetting to the original size Statistic of trades 1 line - account balance, current profit and lot of open trades; 2 line - the number of all
PipFinite Energy Beam
Karlo Wilson Vendiola
3.94 (17)
Pipfinite creates unique, high quality and affordable trading tools. Our tools may or may not work for you, so we strongly suggest to try the Demo Version for MT4 first. Please test the indicator prior to purchasing to determine if it works for you. We want your good reviews, so hurry up and test it for free...we hope you will find it useful. Combo Energy Beam with Swing Control Strategy: Confirm swing pullback signals Watch Video: (Click Here) Energy Beam with Trend Laser Strategy: Confirm Tre
This is  a dashboard indicator that displays the auto-calculated risk lot, with the given risk percentage & risk points (Stop Loss) and others. The main function of this indicator is to help you calculate your exact scalping risk lots and swing risk lots. Also it displays the active trades of each pair you've executed with the following: type of trade, lot size, symbol, & equity(+/-). Also displays the bar counter set in every 5-minute bar timer. (whichever time frame you're active, the bar time
Power Renko MT4
Pierce Vallieres
Power Renko is an indicator which plots Renko bricks underneath the chart using a histogram. You can select the brick size and the timeframe of the Renko bricks as well as whether or not to use the close price or the high/low price of the candles. Renko bricks are based on price alone, not time, therefor the Renko bricks will not be aligned with the chart's time. They are extremely useful for trend trading and many different strategies can be formed from them. Buffers are provided allowing you t
Pirate
Anatoliy Lukanin
3.9 (20)
Deposit :   from 100 deposit units Trading pairs: I recommend currency pairs: EURAUD, CHFJPY, EURCHF, EURGBP, AUDCHF, CADCHF, USDCHF. Trading period :  Any Account: You should use ECN-ECN.Pro accounts with five-digit quotes with a moderate size (spread). Parameters: USING - Choice, trading risk or fixed lot RISK/LOT - Lot Risk Value RESTORING_THE_BALANCE - Restoring balance* HOW_THE_RESET_WINDOW - Reset the Global Variable TAKE_PROFIT - Set profit STOP_LOSS - Set loss COUNT_BUY - The number of s
FX Strength Meter Pro 是一个功能强大的指标,专为那些希望在外汇市场中找到最佳交易机会的交易者设计。我们的指标实时显示各主要货币对(USD, EUR, GBP, CHF, AUD, NZD, JPY, CAD)的强弱关系,帮助您快速识别最强和最弱的货币,从而优化您的交易策略。 主要特点: 多时间轴支持: 从分钟线到月线(M1, M5, M15, M30, H1, H4, D1, W1, MN1),用户可以选择显示哪些时间轴的强弱关系,显示的左边货币是最强,往右是依次变弱。 实时更新: 每秒钟更新一次,确保用户获得最新的货币强弱数据。 清晰展示 :强弱关系以最强到最弱的顺序清晰展示,帮助您快速做出交易决策。 可定制显示: 用户可以调整文本颜色、字体大小和行间距,以适应个人喜好和需求。 显示格式(默认显示): M1: JPY EUR NZD USD CHF CAD AUD GBP M5: GBP EUR USD NZD CAD JPY CHF AUD M15: EUR GBP NZD CAD USD CHF AUD JPY M30: EUR NZD CAD GBP A
Ticks Size
Viktor Kolmakov
This indicator displays in a separate window the difference between the number of points which increased the price, and the number of points that decreased the price during the time interval specified in the settings. The time interval for calculation is expressed as the number of bars of the chart the indicator is attached to. This approach allows you to evaluate the movement direction (growth or fall) of the instrument's price, the strength of the movement and the size of the movement in point
RiverScope Lite automatically determines the nearest most important price levels and support and resistance zones in history, it also identifies a large number of price action patterns (the lite version is limited to 10, while the full version has 30+). The support and resistance levels are determined based on an algorithm that calculates and filters the historical values of the price, its movement character, volumes, etc. It displays the current situation, therefore the nearest levels change in
TimeToBarEnd
Ilia Stavrov
Indicator "Time to Bar End" (TimeToBarEnd) This technical indicator is designed to accurately track the time remaining until the current candle closes on the chart. It displays a countdown in minutes:seconds format, which is particularly useful for intraday traders and scalpers who need to know the exact closing time of the current candle. The indicator updates in real-time and offers flexible customization of its appearance. The settings include: choice of position from four chart corners, adj
FREE
Простое визуальное и эффективное обнаружение тренда.Сигнал поступает на " закрытой свече  ".Работает на всех символах и таймфреймах.Индикатор не использует входных параметров.Все алгоритмы для расчета заложены в код.Индикатор может использовать для разработки советников.Изменение цвета индикатора,характеризует поведение рынка.Зеленый цвет сигнализирует восходящее движение.Красный цвет сигнализирует о нисходящем движении.Желтый цвет показывает флет.Желаю всем удачной торговли!!!
Riko Trend
Nadiya Mirosh
The Riko Trend indicator is a revolutionary trend trading and filtering solution with all the important features of a trend tool built into one tool! The Riko Trend indicator is good for any trader, suitable for any trader for both forex and binary options. You don’t need to configure anything, everything is perfected by time and experience, it works great during a flat and in a trend. The Riko Trend indicator is a technical analysis tool for financial markets that reflects the current price f
VR Grid
Vladimir Pastushak
5 (3)
VR 网格指示器 设计 用于创建具有用户定义设置的图形网格。与 标准网格 不同,VR 网格用于构建 圆形关卡 。根据用户的选择,轮次级别之间的步长可以是任意的。此外,与其他指标和实用程序不同,即使时间段发生变化或终端重新启动,VR Grid 也能保持网格的位置 。 设置、设置文件、演示版本、说明、问题解决,可以从以下位置获取 [博客] 您可以在以下位置阅读或撰写评论 [关联] 版本为 [MetaTrader 5] 垂直级别 基于实际时间间隔并 忽略缺失 或不存在的周期。因此,级别之间的步长严格对应于用户选择的值。 使用 VR 网格指标时,交易者 可以更改任何级别的垂直线和水平线的样式 、颜色和粗细。这使您可以控制金融工具的 回合水平 。 整数位是 以两个或多个零结尾 的价格(例如:1.23500、5.65900、1923.200)。人们相信,这样的水平 经常充当 作为支撑或阻力的强点。 Horizontal line settings Horizontal line step Horizontal line color Horizontal line style Horizonta
FREE
P Y R A M I D   E X P E R T    This Forex utility is a complex exit strategy and order management tool that executes four trading methods; scalping, pyramid style, hedging, and scaling method to close trades with a profit.           V E R Y  I M P O R T A N T     This is not a stand alone expert advisor. Use it with your own volatility-based strategy. Once you found the currency pair to trade, you can just attach this tool to the chart of the chosen pair and it will do the
该产品的买家也购买
Miraculous 指标 – 100% 不重绘的外汇和二元期权工具,基于江恩九方图 这个视频介绍的 Miraculous 指标 是一款专为外汇和二元期权交易者开发的高精度、强大交易工具。该指标的独特之处在于它建立在传奇的 江恩九方图 和 江恩振动法则 之上,使其成为现代交易中可用的最精确预测工具之一。 Miraculous 指标 完全不重绘 ,这意味着它的信号在 K 线收盘后不会改变或消失——你看到的就是你得到的。这为交易者提供了可靠且一致的基础,让他们能够自信地进出场交易。 主要特点: 基于江恩九方图和江恩理论构建 100% 不重绘的信号系统 适用于所有时间周期(M1、M5、H1、H4、日线、周线) 适用于外汇和二元期权交易 清晰的买卖信号,准确率高 可用于剥头皮、日内交易或波段交易 兼容大多数 MT4 平台 这款工具旨在帮助初学者和专业交易者做出更好、更明智的决策。无论您是交易货币、指数还是二元期权,Miraculous 指标都将为您在市场中提供所需的优势。
Pulse Scalping Line - an indicator for identifying potential pivot points. Based on this indicator, you can build an effective Martingale system. According to our statistics, the indicator gives a maximum of 4 erroneous pivot points in a series. On average, these are 2 pivot points. That is, the indicator shows a reversal, it is erroneous. This means that the second signal of the indicator will be highly accurate. Based on this information, you can build a trading system based on the Martingale
Bomb Bank Signal
Igor Pereira Calil
5 (1)
炸彈銀行訊號:您對 MetaTrader 4 的信心指標 Bomb Bank Signal 是 MetaTrader 4 的一個強大指標,旨在識別金融市場中最相關的趨勢。如果您正在尋找一種能夠準確預測運動的工具,那麼炸彈庫就是您需要的盟友。 運作原理: 該指標結合了三種不同的方法——成交量分析、蠟燭收盤價和對稱趨勢——來偵測和發出買賣機會訊號。當炸彈銀行識別出買入機會時,它就像一顆「炸彈」;當它偵測到賣出訊號時,它就像一個「頭骨」。 為什麼炸彈銀行不一樣? 完全可靠性:炸彈庫訊號不會刪除訊號。訊號一旦發出,就會一直存在,確保您不會錯過任何機會。 極為準確:炸彈庫不會發出錯誤訊號。它會即時更新您的訊息,隨著市場的變化進行調整,但保持先前訊號的透明度。 即時更新:訊號被即時識別並在必要時更新,使您能夠快速響應市場變化。 最大化您的結果: 炸彈銀行訊號是識別趨勢持續走勢的理想選擇。例如,如果您已經做空並且指標在 M15 發出買入訊號,那麼現在就是平倉或部分下單的最佳時機,反之亦然。 此外,經過仔細分析,我們建議您遵循M30、H1和H4上的訊號,停損僅50點。這使得價格朝著有利
BinaryIndicator
Andrey Spiridonov
BinaryIndicator is a highly accurate indicator for trading binary options. It shows excellent results in scalping. This indicator is based in multifactor analysis of trend indicators, as well as confirmation oscillators, which in the end gives an increased accuracy of signals. Advantages of the indicator Increased accuracy of signals. Excellent results when trading binary options with a short expiration time from M30 to M1 . It works on any timeframes. Works with any trade symbols. Parameters
Rtc ML Ai Predictor MT4
Muhammad Faisal Sagala
Rtc ML Ai | Predictor CORE MACHINE LEARNING ENGINE Adaptive ML Market Predictor – Multi-Bar Trend & Candle Forecast What This Indicator Does This indicator is a  real-time market prediction engine  designed to analyze price behavior and estimate  future market tendencies . Unlike conventional indicators, this system  does not rely on static parameters or historical curve-fitting , but adapts its internal state dynamically during live market operation. Instead of using static rules, the indic
The Hurricane Indicator
Paul Nicholas Clevett
5 (1)
Currently switched to the 4 hour chart - but use other time frames for confirmation. :-)  I change my main time frame based on the market movement at the time. The Hurricane Forex Indicator is a multi time frame indicator that includes such things as Trade Notifications, Trade Calculator, Momentum Indicator, risk reward and much more. We have a free Trade room for our users as well. Please check out the video for full details of how this indicator works as it has over 15 years worth of developme
FFx Engulfing Setup Alerter gives trade suggestions with Entry, Target 1, Target 2 and StopLoss. Below are the different options available: Entry suggestion - pips to be added over the break for the entry 3 different options to calculate the SL - by pips, by ATR multiplier or at the pattern High/Low 3 different options to calculate the 2 TPs - by pips, by ATR multiplier or at Risk/Reward Offset the dashboard - any place on the chart Remove the suggestion once the price reached the SL line Lines
FFx InsideBar Setup Alerter gives trade suggestions with Entry, Target 1, Target 2 and StopLoss. Below are the different options available: Entry suggestion - pips to be added over the break for the entry Minimum candle size - to avoid too close buy/sell entry suggestions 3 different options to calculate the SL - by pips, by ATR multiplier or at the pattern High/Low 3 different options to calculate the 2 TPs - by pips, by ATR multiplier or at Risk/Reward Offset the dashboard - any place on the c
FFx OutsideBar Setup Alerter gives trade suggestions with Entry, Target 1, Target 2 and StopLoss. Below are the different options available: Entry suggestion - pips to be added over the break for the entry. 3 different options to calculate the SL - by pips, by ATR multiplier or at the pattern High/Low. 3 different options to calculate the 2 TPs - by pips, by ATR multiplier or at Risk/Reward. Offset the dashboard - any place on the chart. Remove the suggestion once the price reached the SL line.
FFx PinBar Setup Alerter gives trade suggestions with Entry, Target 1, Target 2 and StopLoss. Below are the different options available: Entry suggestion - pips to be added over the break for the entry Minimum candle size - to avoid too small candles 3 different options to calculate the SL - by pips, by ATR multiplier or at the pattern High/Low 3 different options to calculate the 2 TPs - by pips, by ATR multiplier or at Risk/Reward Offset the dashboard - any place on the chart Remove the sugges
Lineverse Trendlines
Arkady Segal
5 (1)
Automatic, live & interactive picture of all trendlines. Assign push, email and sound alerts to the lines of your choice and be informed about price rollback, breakout, rollback after breakout, number of rollbacks, line expiration by double breakout. Correct, drag or delete the lines and interactively tune the line system. https://youtu.be/EJUo9pYiHFA . Chart examples https: //www.mql5.com/en/users/efficientforex Price Interaction Events All events are effective immediately and only after one
FFx MACD Divergences
Eric Venturi-Bloxs
The purpose of this new version of the MT4 standard indicator provided in your platform is to display in a sub-window multiple timeframes of the same indicator with its divergences. See the example shown in the picture below. But the display isn't like a simple MTF indicator. This is the real display of the indicator on its timeframe. Here's the options available in the FFx divergences indicator: Select the timeframes to be displayed (M1 to Monthly) Define the width (number of bars) for each tim
FFx RSI Divergences
Eric Venturi-Bloxs
The purpose of this new version of the MT4 standard indicator provided in your platform is to display in a sub-window multiple timeframes of the same indicator with its divergences. See the example shown in the picture below. But the display isn't like a simple MTF indicator. This is the real display of the indicator on its timeframe. Here's the options available in the FFx divergences indicator: Select the timeframes to be displayed (M1 to Monthly) Define the width (number of bars) for each tim
FFx CCI Divergences
Eric Venturi-Bloxs
The purpose of this new version of the MT4 standard indicator provided in your platform is to display in a sub-window multiple timeframes of the same indicator with its divergences. See the example shown in the picture below. But the display isn't like a simple MTF indicator. This is the real display of the indicator on its timeframe. Here's the options available in the FFx divergences indicator: Select the timeframes to be displayed (M1 to Monthly). Define the width (number of bars) for each ti
The FFx Dashboard MTF alerter will show you on a single chart all the timeframes (M1 to Monthly) with their own status for the indicator. 2 Alert Options: Single timeframe: each selected timeframe alert separately when a signal occurs Multi timeframes: all selected timeframes must agree for an alert to be triggered Both options have an input to select the timeframes to be used for the alert(s). How to Understand the Status: Green/Red square: histogram above/below 0 line Green square + Red bord
The FFx Dashboard MTF alerter will show you on a single chart all the timeframes (M1 to Monthly) with their own status for the indicator. 2 Alert Options: Single timeframe: each selected timeframe alert separately when a signal occurs Multi timeframes: all selected timeframes must agree for an alert to be triggered Both options have an input to select the timeframes to be used for the alert(s). How to understand the status: Green/Red square: RSI above/below 50 line Green square + Red border: R
The FFx Dashboard MTF alerter will show you on a single chart all the timeframes (M1 to Monthly) with their own status for the indicator. 2 Alert Options: Single timeframe: each selected timeframe alert separately when a signal occurs Multi timeframes: all selected timeframes must agree for an alert to be triggered Both options have an input to select the timeframes to be used for the alert(s). How to understand the status: Green/Red square: Stoch above/below 50 line Green square + Red border:
The FFx Dashboard MTF alerter will show you on a single chart all the timeframes (M1 to Monthly) with their own status for the indicator. 2 Alert Options: Single timeframe: each selected timeframe alert separately when a signal occurs Multi timeframes: all selected timeframes must agree for an alert to be triggered Both options have an input to select the timeframes to be used for the alert(s). How to understand the status: Green/Red square: Price above/below Cloud (Kumo) Green square + Red bo
The FFx Dashboard MTF alerter will show you on a single chart all the timeframes (M1 to Monthly) with their own status for the indicator. 2 Alert Options: Single timeframe: each selected timeframe alert separately when a signal occurs Multi timeframes: all selected timeframes must agree for an alert to be triggered Both options have an input to select the timeframes to be used for the alert(s). How to understand the status: Green/Red square: MA pointing Up/Down Green square + Red border: MA po
The FFx Dashboard MTF alerter will show you on a single chart all the timeframes (M1 to Monthly) with their own status for the indicator. 2 Alert Options: Single timeframe: each selected timeframe alert separately when a signal occurs. Multi timeframes: all selected timeframes must agree for an alert to be triggered. Both options have an input to select the timeframes to be used for the alert(s). How to understand the status: Green square: Price above PSAR Red square: Price below PSAR Options
The FFx Dashboard MTF alerter will show you on a single chart all the timeframes (M1 to Monthly) with their own status for the indicator. 2 Alert Options: Single timeframe: each selected timeframe alert separately when a signal occurs Multi timeframes: all selected timeframes must agree for an alert to be triggered Both options have an input to select the timeframes to be used for the alert(s). How to understand the status: Green/Red square: CCI above/below levels (ie. 100/-100) Grey square: C
The FFx Dashboard MTF alerter will show you on a single chart all the timeframes (M1 to Monthly) with their own status for the indicator. 2 Alert Options: Single timeframe: each selected timeframe alert separately when a signal occurs Multi timeframes: all selected timeframes must agree for an alert to be triggered Both options have an input to select the timeframes to be used for the alert(s). How to understand the status: Green/Red square: ADX above level Grey square: ADX below level Red bor
The FFx Dashboard MTF alerter will show you on a single chart all the timeframes (M1 to Monthly) with their own status. 2 Alert Options: Single timeframe: each selected timeframe alert separately when a signal occurs Multi timeframes: all selected timeframes must agree for an alert to be triggered Both options have an input to select the timeframes to be used for the alert(s). How to understand the status: Green/Red square: bullish/bearish candle Options available in the FFx Dashboard Alerter
THE GRAFF III
Antonin Skaryd
The [GRAFF] III manual trading system is based on multiple MetaTrader (MT4) indicators. Together, the entire PACK of GRAFF III indicators makes an advanced trading tool. The system consists of over 20 different custom-built indicators which have been carefully selected and tested in the long term to produce strong and efficient trading signals. The particular indicators are based on different mathematical formulas, so the entire system is calibrated to remove false signals from its own indicator
This indicator allows you to see the strength of the trend on all timeframes. It can be used for all currency pairs. The indicator can be displayed in the form of a column (from left to right): status buy / sell / strong buy / strong sell, strength of the trend in percentage, pips last candle, body candle now, remaining time, and the timeframe of M1 to MN. Information contained below (from left to right): total trend percent, sell percent, buy percent.
FFx Universal Strength Meter PRO is more than a basic strength meter. Instead of limiting the calculation to price, it can be based on any of the 19 integrated strength modes + 9 timeframes. With the FFx USM, you are able to define any period for any combination of timeframes. For example, you can set the dashboard for the last 10 candles for M15-H1-H4… Full flexibility! Very easy to interpret... It gives a great idea about which currency is weak and which is strong, so you can find the best pai
A simplistic indicator informing a user on RSI divergence by sending messages to mobile device and email. The indicator draws 2 vertical lines, marking two RSI extrema that formed the divergence. You get the alert, open the charts and make a decision. The indicator does not show past divergences, thus when you attach it to a chart for the first time you see nothing. Graphics and alerts will appear as soon as divergences do. Drop it in Tester to see how it works. Parameters: RSIPeriod - number of
Pan PrizMA CD Phase is an analogue of the МetaТrader 5 indicator , and is an option based on the Pan PrizMA indicator. Details . Averaging by a quadric-quartic polynomial increases the smoothness of lines, adds momentum and rhythm. Extrapolation by the sinusoid function near a constant allows adjusting the delay or lead of signals. The value of the phase - wave status parameter (which is close in meaning to the trigonometric phase or the angle of the radius-vector rotation in the trigonometric p
作者的更多信息
Think of the rarest pair you can think of. And I assure you that this indicator can compute it's strength. This Currency Meter will literally calculate any currency pairs, either it is the Major Pairs, Metals, CFD's, Commodities, Crypto Currency like Bitcoin/BTC or Ethereum/ETH and even stocks. Just name it and you will get it! There is no currency pair this Currency Meter can solve. No matter how rare or exotic is that currency, it will always be solved by this Currency meter which on a real-ti
Think of the rarest pair you can think of. And I assure you that this indicator can compute it is strength. This Currency Meter will literally calculate any currency pairs, either it is a major pair, metal, CFD, commodity, cryptocurrency like Bitcoin/BTC or Ethereum/ETH and even stocks. Just name it and you will get it! There is no currency pair this Currency Meter cannot solve. No matter how rare or exotic is that currency, it will always be solved by this Currency meter on a real-time basis. S
(目前 三十% 折扣) 在阅读该指标的描述之前,我只想向您介绍以下概念 移动平均线 - 仅基于一张图表的典型移动平均线。 货币强度线 - 某一货币对的移动平均线,其强度基于 二十八 对。可以说是真正的移动平均线。 移动平均线确实是几乎每个交易者都使用的最受欢迎的指标之一。 货币强度计也是一种基于多种货币的趋势指标。 移动平均货币强度计是一个图表指标,它为您提供带有货币强度计算法的移动平均线。 蓝色线是每个交易者使用的正常移动平均线。而红线是货币强度线。 指标参数 设置 调整时间框架 移动平均时间帧 - 从 M1 到 MN 选择您想要的时间帧 货币行周期 - 货币行的输入周期 *注意:输入“零”表示当前蜡烛。示例:周期为 0 的 D1 表示当前 D1 蜡烛的强度 移动平均线周期 - 移动平均线周期 方法 - 移动平均法 移动平均线移动 - 移动平均线的移动 价格 - 选择要使用的价格类型  点子交叉 - 移动平均线 和 货币强度线 之间的区别,用于判断货币对是趋势还是交叉 显示设置 字体 - 编辑字体 显示或隐藏优势、趋势和移动平均线 货币颜色 信号颜
MACD Currency Meter
Emir Revolledo
4.6 (35)
MACD shì zuì shòu huānyíng de dòngliàng hé qūshì zhǐbiāo zhī yī. Huòbì qiángdù jì yěshì jīyú duō zhǒng huòbì de qūshì zhǐbiāo. MACD huòbì qiángdù jì shì jùyǒu MACD hé huòbì qiángdù jìsuàn fǎ de dān túbiǎo zhǐbiāo. Tā hái jùyǒu yī jiàn shì gōngnéng, qízhōng 28 gè zhǔyào hé cì yào duì xiǎnshì zài nín de yíbiǎo bǎn shàng, tōngguò dān jī mǒu gè duì, nín de túbiǎo jiāng zìdòng gēnggǎi wèi nín xuǎnzé de túbiǎo. Chǎnpǐn yōushì lùzhì de guānyú rúhé shǐyòng zhǐbiāo dì wǎngluò yántǎo huì wánzhěng de zījī
Fibonacci CSM
Emir Revolledo
Fibonacci Currency Strength Meter (FCSM) Early Access Sale!! This new product is still in the process of adding new features and settings. For early bird buyers. The Price will be 50% Sale. In a few weeks, the product will be done. Go Grab your copy while it's still cheap. More details will be added soon. Things to be added. Alert Levels Mobile and Email Alert From it's name, Fibonacci Currency Strength Meter is a combination of Fibonacci levels and Currency Strength Meter. The plot of Fibona
RSi CSM
Emir Revolledo
*笔记 : 早期购买者可享受 40% 折扣! 免费 EA 将于 11 月第 2 周发布 一旦免费 EA 可用,折扣即结束 RSi 指标是指示某种商品或货币对超买或超卖时最受欢迎的指标之一。 货币强弱计也是一个基于多种货币的趋势指标。 RSi 货币强度计是一款单图表指标,具有 RSi 和货币强度计的算法。 它还具有一键功能,其中 28 个主要和次要对显示在您的仪表板上,通过单击某个对,您的图表将自动更改为您选择的图表。 产品优势: 免费 EA 来管理您的交易。给我留言了解更多详情 输入参数 RSi 设置 - 默认参数为周期 14,电平为 65/35。电平越高或越低,信号会更少但更准确 线图、仪表板和市场趋势的类型 显示设置 - 字体货币颜色、信号颜色、线条颜色以及 X 和 Y 轴对象的位置 计算机、电子邮件和图表警报
Advance Currency Meter is a currency meter that detects strong market trends. This indicator is good for scalping, intraday trading and swing trading. The indicator will detect short term to long term market trends. This will give you good insight which currencies are best to trade as of the moment. Note : Kindly contact me before you make any purchases. This won't work on your account without my permission. Note :   Works well with my MACD Currency Strength Meter
筛选:
Fin Finley
108
Fin Finley 2020.11.20 18:18 
 

用户没有留下任何评级信息

hektorln
35
hektorln 2020.07.07 20:10 
 

用户没有留下任何评级信息

Kandasamy Senthil Kumar
338
Kandasamy Senthil Kumar 2020.06.22 10:49 
 

用户没有留下任何评级信息

forix7
627
forix7 2020.01.25 04:20 
 

用户没有留下任何评级信息

Shannon O'Donnell
133
Shannon O'Donnell 2019.11.04 03:49 
 

用户没有留下任何评级信息

Ted NO FX
1792
Ted NO FX 2019.05.21 18:28 
 

用户没有留下任何评级信息

Derrick Linebaugh
86
Derrick Linebaugh 2019.03.31 10:52 
 

用户没有留下任何评级信息

William Jones
100
William Jones 2019.03.19 07:12 
 

用户没有留下任何评级信息

egwabor5
30
egwabor5 2018.09.07 00:33 
 

用户没有留下任何评级信息

-dimitror-
1117
-dimitror- 2018.08.20 22:53 
 

用户没有留下任何评级信息

eddieso
53
eddieso 2018.08.15 14:05 
 

用户没有留下任何评级信息

AlexUy
86
AlexUy 2018.08.07 07:46 
 

用户没有留下任何评级信息

[删除] 2018.08.07 06:31 
 

用户没有留下任何评级信息

Marc Despalins
452
Marc Despalins 2018.07.02 23:24 
 

用户没有留下任何评级信息

Marcus Jayweather
68
Marcus Jayweather 2018.05.21 13:56 
 

用户没有留下任何评级信息

Staffan Ofwerman
2072
Staffan Ofwerman 2018.04.26 15:57 
 

用户没有留下任何评级信息

Aviator 7280
333
Aviator 7280 2018.03.21 18:40 
 

用户没有留下任何评级信息

Hassan
482
Hassan 2018.03.13 13:02 
 

用户没有留下任何评级信息

sunnychow
9046
sunnychow 2018.03.10 16:59 
 

用户没有留下任何评级信息

Max Van Dijk
169
Max Van Dijk 2018.03.07 20:59 
 

用户没有留下任何评级信息

12
回复评论