Multi Indicator Toolkit
- 指标
- 版本: 1.0

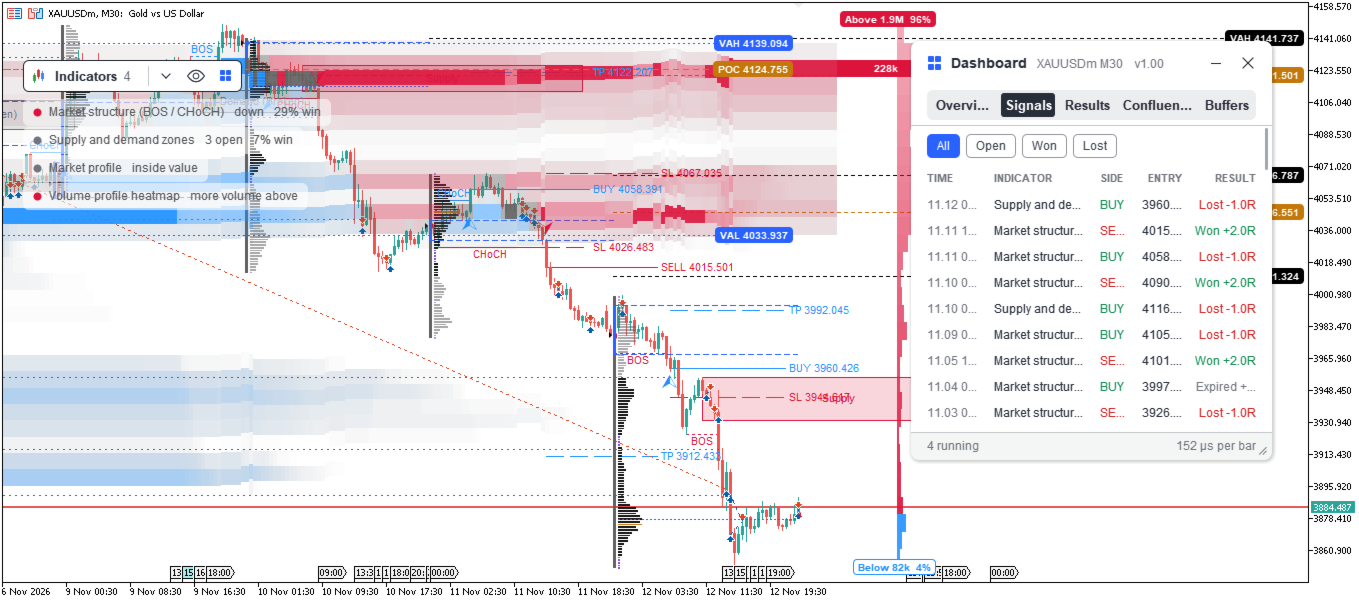
Multi Indicator Toolkit is a complete indicator workspace for MetaTrader 5: more than 70 indicators in one program, each a single click away. Switch on what you need, switch off what you don't, and keep one clean chart instead of a stack of separate tools. It runs as an indicator and does not place trades.
Overview
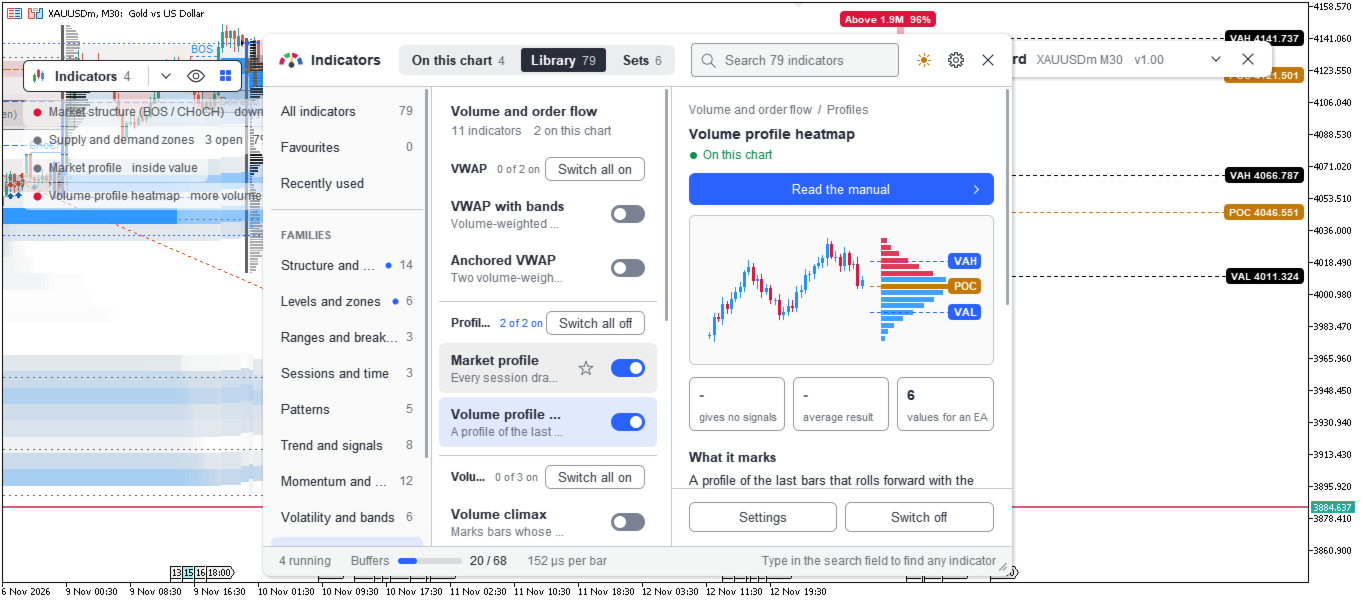
Attach it once and a small pill sits on your chart. Click it, open the Library, and every indicator is there: searchable, grouped by family, with a picture of what it draws. Flip a switch and it appears on the chart. Flip it back and it is gone.
Everything shares one look, in light and in dark, so ten indicators on your chart read as one tool, not ten.
Features
- More than 70 indicators, one window. Search, browse by family, star your favourites
- One click on, one click off. No dragging files, no reloading the chart
- A clean chart from the first second. Only a few are on to begin with
- Marks where things happen. Levels carry their names and prices on the chart, not in a panel
- An illustrated manual for every indicator. What it is, how to read it, how to use it, with figures
- Settings that make sense. Every indicator has its own, with Defaults, Cancel and Done
- Alerts per indicator. For its signals and for its other events
- Results per indicator. Signals counted and win rate, so you know what works on your market
- Confluence. See how two indicators did when they agreed
- Sets. Ready-made groups, and your own saved with their settings
- Hide everything in one click. The chart clears, the indicators keep running
- Light and dark themes. Scaled for high-resolution screens
- One shared subwindow. A tab per indicator, values under the mouse, drag to resize
- Cards you control. The few panels can be dragged, folded or switched off
- Built for Expert Advisors too. Readable buffers, with the iCustom call printed for you
- A progress card for heavy work. Large rebuilds never freeze your chart
- Everything remembered. Saved per chart and restored when you come back
Indicators
Structure and smart money: Market structure (BOS / CHoCH), Internal structure, Swing points and zigzag, Change in state of delivery, Fair value gaps, Inversion fair value gaps, Volume imbalances and opening gaps, Order blocks, Breaker and mitigation blocks, Liquidity pools and sweeps, Swing failure pattern, Premium, discount and optimal entry, Displacement candles, Imbalance matrix
Levels and zones: Previous day, week, month and year levels, Pivot points, Round numbers, Support and resistance zones, Automatic Fibonacci, Supply and demand zones
Ranges and breakouts: Opening range breakout, Session range breakout, Consolidation breakout
Sessions and time: Sessions and kill zones, Quarterly cycles, Time-of-day statistics
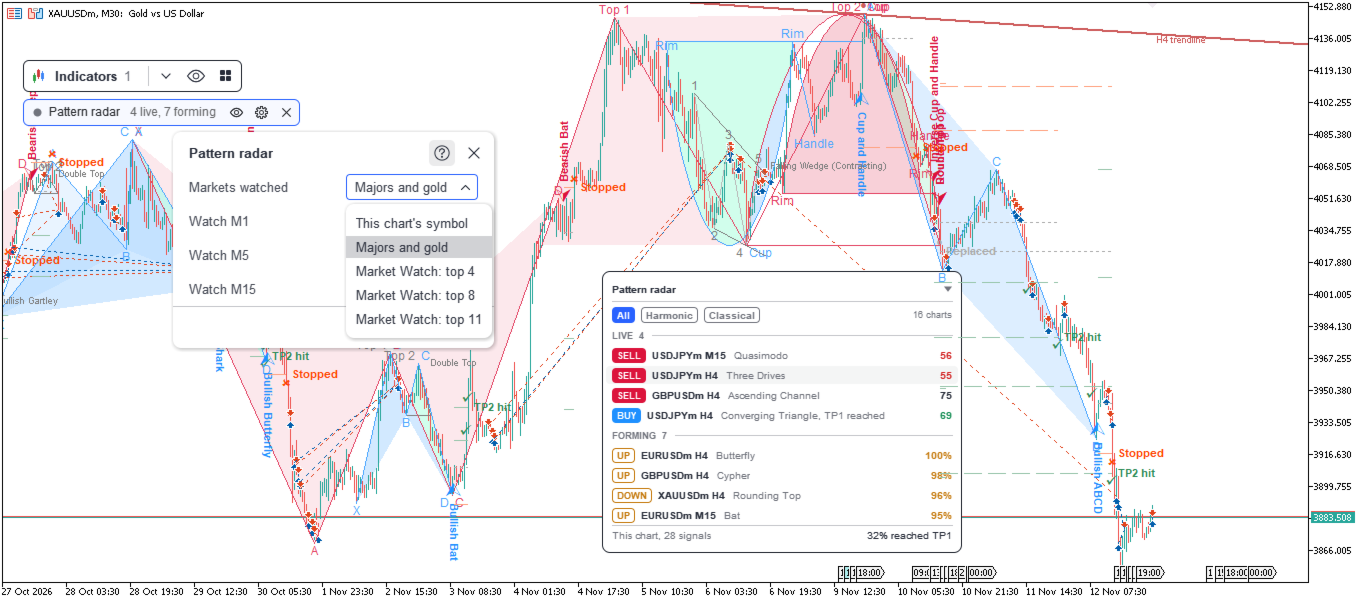
Patterns: Pattern radar (harmonic and classical patterns across several markets and timeframes), Elliott waves, Triple top and bottom, Candlestick patterns, Bar patterns
Trend and signals: Supertrend, ATR trailing stop, Range filter, Chandelier exit, Smoothed Heikin Ashi, Market regime, Trendlines and breakouts, Squeeze momentum, VWAP adaptive trend stop, Smart WaveTrend, Momentum gauges
Divergence: Divergence engine, RSI, MACD, Stochastic, CCI, MFI, OBV, Delta and SMT divergence
Volatility: Average daily range, Volatility regime, Compression bars, Choppiness Index, Williams VIX Fix, Waddah Attar Explosion
Volume and order flow: Footprint, Volume profile heatmap, Market profile, VWAP with bands, Anchored VWAP with bands, Volume climax, Relative volume, Volume spread analysis, Weis waves, Cumulative delta, Absorption and exhaustion
Statistics: Z-score, Efficiency ratio, Hurst exponent, Volatility estimators, Correlation, Currency strength
Multi-timeframe and setups: Higher-timeframe candles, Higher-timeframe table, Session sweep and shift, Silver bullet, Unicorn
How to use
- Attach Multi Indicator Toolkit to a chart.
- Click the pill and open the Library.
- Switch on the indicators you want.
- Click the gear on any of them to change its settings.
- Open Read the manual to see how to read it and use it.
Good to know
Works on all symbols and timeframes. It analyses and draws only and does not place trades. Footprint and the tick-based delta options need your broker's tick history.