 MetaTrader 5
 专家
专家 指标
指标 程序库
程序库 实用工具
实用工具 窗口小部件
窗口小部件 规则
规则适用于MetaTrader 5的新EA交易和指标 - 446
 使用EA交易和指标,使外汇交易获得更多盈利。EA交易可使您自动开启和关闭交易,而指标将帮助您更准确地预测市场行为。
该页面提供MetaTrader 5应用程序的目录。
使用EA交易和指标,使外汇交易获得更多盈利。EA交易可使您自动开启和关闭交易,而指标将帮助您更准确地预测市场行为。
该页面提供MetaTrader 5应用程序的目录。 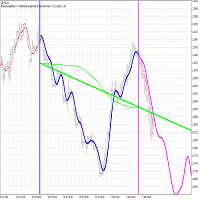
The FourierExtrapolationMA indicator transforms and extrapolates the Moving Average function by the Fast Fourier Transformation method.
1. The transformation period is set by two vertical lines, by default the first blue line and the second pink.
2. By default, the Moving Average (MA) line is drawn in red.
3. By Fourier Transform, the indicator builds a model of N harmonics, which is as close as possible to the MA values. The model is drawn by default in blue over the MA for the period betwee

This indicator uses VWAP and projects this VWAP into up to 3 levels, shifted by a percentage of the chart's symbol.
How to configure: Choose the symbol and desired graphic time Set the start time of the symbol (in bovespa, WIN and WDO start at 9 o'clock). This time is used as the cutoff reference for VWAP. Check which VWAP period fits the chart better: Ideally, a period when VWAP is not too distant from the chart Set percentage levels: Ideally, you should set levels based on history, so that le

It is is your personal risk guard. Drop it on any chart on your VPS or trading computer and it will guard your total risk in any pair or asset and make sure the sum of all stops is within your risk. If you happened to exceed the risk, in a split second this EA will calculate the exact position for the combined risk of all open positions and place all stops at the exact same spot. If you open a new position with another lot size . No problem, all stoplosses will automatically adjust. Tired of man
FREE

Currency RSI Scalper MT5 是基于流行的 Relative Strength Index (RSI) 指标的专业指标。 虽然 RSI 指标在市场区间内运行良好,但在市场条件变化时无法产生盈利信号,因此会产生错误信号,导致巨大损失。 你有没有想过一个自适应 RSI 指标可以根据市场状况调整它? 所提供的指标实现了一种优化算法,可以找到最佳的超买和超卖水平。 这使得 Currency RSI Scalper 能够适应不断变化的市场。 当出现买入或卖出信号时,图表上会绘制一个箭头并触发警报,让您及时开仓,避免一直坐在电脑前。 Currency RSI Scalper 非常适合交易货币(包括加密货币)和二元期权。
为什么选择 Currency RSI Scalper 该指标适用于剥头皮和日内交易。 可以评估指标对历史的有效性。 指标不会重绘(重新计算),信号严格在“柱线收盘”时生成。 它可以用作独立工具或与其他指标一起使用。 电子邮件和移动设备新指标信号通知系统。 能够自定义指标的配色方案。 最优运算算法,终端不“死机”
使用 Currency RSI Scalpe

具有多时间框架支持、可自定义视觉信号和可配置警报系统的Moving Average(MA)指标。
自由职业编程服务、更新及其他TrueTL产品可在我的 MQL5个人主页 获取。
欢迎反馈和评价!
什么是MA? 移动平均线(MA)是交易中使用最广泛的技术指标之一。它通过计算指定周期内的平均值来平滑价格数据,帮助交易者识别趋势方向并过滤短期价格噪音。 TrueTL MTF MA支持四种计算方法:简单(SMA)、指数(EMA)、平滑(SMMA)和线性加权(LWMA)。EMA和LWMA对近期价格赋予更高权重,对价格变化的反应更快,而SMA则提供等权重平均值。该指标可以在当前图表上显示任意高级时间框架的MA值。 功能: 带有箭头和垂直线的视觉信号标记 三个独立的信号槽,具有可配置的触发器 信号检测选项:方向变化、峰值/谷值、价格穿越MA线 每个信号的可配置警报功能(电子邮件、推送、声音、弹窗) 具有插值方法的多时间框架(MTF)功能 四种MA方法:SMA、EMA、SMMA、LWMA 可选应用价格(收盘价、开盘价、最高价、最低价、中间价、典型价、加权价) 多种颜色模式(简单、基于方向、基于级
FREE
除了发现看涨和看跌的三线行权形态之外,这个多符号和多时间框架指标还可以扫描以下烛台模式(请参阅屏幕截图以了解模式的解释): 三白兵(反转>延续形态) 三只黑乌鸦(反转>延续形态) 当启用指标设置中的严格选项时,这些形态不会经常出现在较高的时间范围内。但是当他们这样做时,这是一个非常高概率的设置。根据 Thomas Bulkowski(国际知名作家和烛台模式的领先专家)的说法,三线罢工在所有烛台模式中的整体表现排名最高。结合您自己的规则和技术,该指标将允许您创建(或增强)您自己的强大系统。 特征 可以同时监控您的市场报价窗口中可见的所有交易品种。仅将指标应用于一张图表并立即监控整个市场。 可以监控从 M1 到 MN 的每个时间范围,并在识别出模式时向您发送实时警报。 支持所有警报类型 。 可以使用 RSI 作为趋势过滤器,以便正确识别潜在的逆转。 该指示器包括一个交互式面板。当单击一个项目时,将打开一个带有相关代码和时间范围的新图表。 该指标可以将信号写入文本文件,EA 交易程序 (EA) 可以使用该文件进行自动交易。比如 这个产品 。 您可以在博客中 找到有关文本文件的内容和位置的
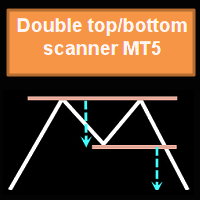
这个多时间框架和多品种指标识别双重或三重顶部/底部形态或随后的颈线突破(确认顶部/底部)。它提供 RSI、pin bar、吞没、镊子、早/晚星过滤器以及发散过滤器选项,可以仅过滤掉最强的设置。 该指标也可用于单一图表模式。请在产品的 博客 。 结合您自己的规则和技术,该指标将允许您创建(或增强)您自己的强大系统。 特征
可以同时监控您的市场报价窗口中可见的所有交易品种。将该指标仅应用于一张图表,并立即监控整个市场。 可以监控从 M1 到 MN 的每个时间范围,并在识别出第二个或第三个顶部/底部或颈线突破时向您发送实时警报。支持所有 Metatrader 原生警报类型。 可以使用 RSI,从不同的蜡烛形态和背离中进行选择,以正确识别潜在的逆转。 该指示器包括一个交互式面板。当单击一个项目时,将打开一个带有相关代码和时间范围的新图表。 该指标将信号写入文本文件,EA 交易系统 (EA) 也可以使用该文件进行自动交易。比如 这个产品 。
输入参数
输入参数的描述和解释可以在 这里 找到。 重要的 请注意,由于具有多功能性,既不会在安装指标的图表上绘制买卖建议,也不会绘制线条和
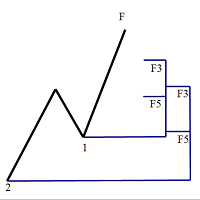
斐波那契折返和扩展画线工具 适用于MT5平台的斐波那契折返和扩展画线工具,非常适合于利用 帝纳波利点位交易法 和黄金分割交易的交易者 试用版: https://www.mql5.com/zh/market/product/35884
主要功能:
1.可以直接画线多组斐波那契折返,重要折返点之间的关系一目了然
2.可以画出斐波那契扩展
3.画线的斐波那契折返和扩展均可左右移动方便观察,有数值显示
4.图表显示非常清爽
5.可通过数字键切换周期
功能键:
1.按 [ 画折返,按需画折返,最多可画8组
2.按 ] 画扩展
3.按 \ 删除当前周期下的所有扩展和折返
4.移动、删除折返和扩展
(1)点击第一组折返的F5线条,
点击1次(变成黄色),按键盘上的Delete可删除该焦点的折返。
点击2次(恢复颜色),可以移动折返到合适的位置
(2)点击COP的线条
点击1次(变成黄色),按键盘上的Delete可该组折返
点击2次(恢复颜色),可以移动扩展到合适的位置
5.修改折返和扩展:
(1)选择焦点F或反弹点数字(F或反弹点字体变大,变成黄色),移动鼠标。
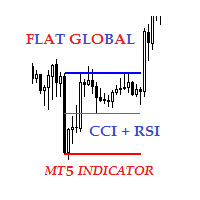
Description The indicator of local flat for CCI and RSI indicators. Users can select financial instruments. The indicator allows to find local flats in the following options: Width of channels that is not more than certain range Width of channels that is not less than certain range Width of channels that is not more and not less than certain range The indicator displays the middle and boundaries of the channel.
Purpose
The indicator can be used for manual or automated trading within an Expert

While you are trading, Auto StopLoss Defender doing all the routine work. "Must have" for scalping. Best way to save account balance in case of force majeure.(Internet connection loss, power outage, sharp change in price direction) The Utilite automatically adds a stop loss to open and pending orders that have no stoploss set. The anti-requote system is built into the Utilite. That means the stop loss will be registered anyway! In the settings you can set any stop loss begin from 0.0001 (If yo

Introduction This indicator detects volume spread patterns for buy and sell opportunity. The patterns include demand and supply patterns. You might use each pattern for trading. However, these patterns are best used to detect the demand zone (=accumulation area) and supply zone (=distribution area). Demand pattern indicates generally potential buying opportunity. Supply pattern indicates generally potential selling opportunity. These are the underlying patterns rather than direct price action. T

The utility is entended for preparing information for the Sprint EA . Preparing information for different financial instruments needs the EA to be attached to a chart of the corresponding financial instrument. The EA prepares information in online mode only. Input Parameters Symbol Name - name of financial instrument of the chart the EA is attached to. Connection Control - control of disconnections with the trade server: true - enable. false - disable. Send Mail - send an e-mail notification abo
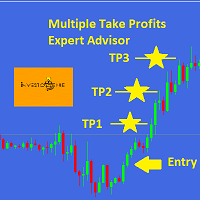
This EA is designed for MULTIPLE TAKE PROFITS options based on User's order management.
ABOUT EXPERT ADVISOR:
The expert advisor is designed to help user take multiple profits on single order. The multiple take profits can be allocated a fixed percentage based on user's preferences. The user is required to set an entry level in price and set target percentages and target prices. The stop loss and price to close options helps user in risk management.
ADVANTAGES:
Option of Taking Profits till

While you are trading, Auto StopLoss Premium doing all the routine work. "Must have" for scalping. Best way to save account balance in case of force majeure.(Internet connection loss, power outage, sharp change in price direction) The Utilite automatically adds a stop loss to open and pending orders that have no stoploss set. Also adds a take profit. The anti-requote system is built into the Utilite. That means the stop loss will be registered anyway! In the settings you can set any stop los
Introduction This indicator detects volume spread patterns for buy and sell opportunity. The patterns include demand and supply patterns. You might use each pattern for trading. However, these patterns are best used to detect the demand zone (=accumulation area) and supply zone (=distribution area). Demand pattern indicates generally potential buying opportunity. Supply pattern indicates generally potential selling opportunity. These are the underlying patterns rather than direct price action. T
FREE

Introduction
Auto Chart Alert is a convenient tool to set alert for your trading in your chart. With Auto Chart Alert, you can set the alert line in one click in your desired location in your chart. You can even set alert over the sloped lines in your chart. Auto Chart Alert is a great tool when you have to watch out importnat support and resistance levels for your trading. You can receive the sound alert, email and push notification when the price hit the alert line at you desired location. Au
FREE
Introduction To Time Box Indicator Time Box Indicator is a must have indicator for any trader. It will display daily, weekly and Monthly box according to your preferences. Yet, you can extend any important price levels in your chart automatically. You can use them as the significant support and resistance levels. It is very simple but effective tool for your trading.
Graphic Setting Use White Chart Line Style for Current Open price
Daily Setting Update Timeframe for daily box Number of days to
FREE

Reliable Scalping Indicator RELIABLE SCALPING INDICATOR ( RSI ) As the name implies, this indicator gives reliable BUY and SELL signals on your chart. NO FANCY INDICATORS, NO MESSING WITH YOUR CHARTS. IT DOES NOTHING TO YOUR CHARTS EXCEPT TO SHOW ARROWS FOR BUYS AND SELLS. It DOES NOT repaint and has alerts and notifications which you can allow. It has chart notifications, mobile and email notifications and alerts. THIS INDICATOR PRODUCES ABOUT 85% ACCURATE SIGNALS WHICH IS VERY ENOUGH TO MAKE

Панель предназначена для быстрого визуального нахождения и отображения внешних баров по всем периодам и на любых выбранных валютных парах одновременно. Цвет сигнальных кнопок, указывает на направление паттерна. По клику на сигнальную кнопку, осуществляется открытие графика с данным паттерном. Отключить не используемые периоды, можно кликом по его заголовку. Имеется поиск в истории (по предыдущим барам). Прокрутка (scrolling) панели, осуществляется клавишами "UP" "DOWN" на клавиатуре. Имеется Pus

TeaCii trend is a LEADING NON-LAG indicator to trade Ranged Markets or Breakouts. The indicator marks support and resistance at the moment they are formed . It has only one setting for the ATR. We recommend leaving default.
This is not an indicator that draws lines from the highs or lows and regards them as SR. It creates actual SR levels way before the market even shows the level as SR. Often 5 to 10 candles before the naked eye can see it. Look at the first dot and know that SR was declared t

分形指标的多货币和多时间框架修改。 显示最后两个分形 - 它们的序列(以及哪一个被破坏),或它们之间的距离。 您可以在参数中指定任何所需的货币和时间范围。 此外,该面板还可以发送有关分形突破的通知。 通过单击带有句点的单元格,将打开该符号和句点。 这是 MTF 扫描仪。
默认情况下,从图表中隐藏仪表板的键是“D”
参数 Calculation of fractals based on — 分形搜索模式: — standart indicator — 按标准指标; — user bars — 按自定义栏的数量(可调整分形); Bars before (user calc) — 分形之前的柱数 Bars after (user calc) — 分形后的条数; Indicator mode — 显示模式 — Arrows — 分形的最后两个箭头; — Distance — 最后两个分形之间的距离; Show fractals on the chart — 在图表上显示当前分形; Clear the chart at startup — 启动时清除图表。 Set of Pairs —
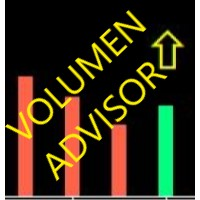
有用的工具,当它通过音量输入检测到可能的移动时将通知您。
从根本上来说是期货。
检测NO OFFER / NO DEMAND的区域。
将正在进行的蜡烛的体积与之前的蜡烛进行比较。
如果音量一直在下降,当前收缩时,超过前一个,请注意!
- 它可以加载到主图形或窗口中。
- 任何时间性。
- 它通过一个弹出窗口警告你,闹钟响了。
- 检测到模式时,会发出声音警报。
................................................. ................................................. .................................................

A's Capital Line is a complex algorithm that detects 100% of the trends .
This line marks the following information: The entrance to the trend. Stop of loss. Supports and resistances. When to take Profit.
Send alerts to your cell phone through metatrader It works perfect on any instrument (stocks, forex, crypto, commodities, indices, etc). Also in any time frame to adjust to any trading style. Please see Screenshots for examples and Follow us on instagram. Image 1 Line settings are diferent

Very simple White expert, minimum parameters. The principle of operation is to follow the market. Open an order as often as possible with a given step in increments. Thus, the position is constantly changing in the wake of the market. Extremely reliable strategy, the leader of all created by the author of strategies. It gives very good results when used in a multi-currency mode. Profit for one pair is not big but good forecasting is very clearly seen. Accordingly, in such conditions, when using

Simple WhiteRegr expert, minimum parameters. Advanced development of the White bot. The principle of operation is to monitor the market using two channels of the regression indicator. Open orders as often as possible with a given step in increments. Thus, the position is constantly changing in the wake of the market. Extremely reliable strategy, the leader of all created by the author of strategies for reliability. Compared with the previous version, forecasting is much better. It gives very goo
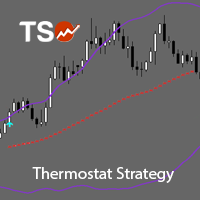
TSO Thermostat Strategy is an indicator that can adapt to the current market conditions by switching from a trend-following mode to a short-term swing mode, thus providing the best possible entry/exit signals in any situation. It is based on the Thermostat Trading Strategy as presented in the book Building Winning Trading Systems with TradeStation by G. Pruitt and J. R. Hill. Strategy The Thermostat Strategy uses different entry and exit conditions based on the current situation of the market
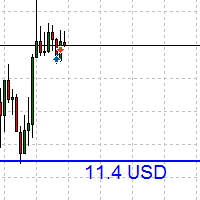
Line Profit 存款货币的可视利润线指标。仅当市场上有安装指标的符号的未平仓头寸时才有效。您可以用鼠标移动线或启用自动跟踪买入价。 指标设置说明: colotLine - 线条颜色 WidthLine - 线宽 colotText - 文本颜色 FontSize - 文本的高度 Anchor - 文本的锚点方法 FollowBid - 跟随买入价 Line Profit 存款货币的可视利润线指标。仅当市场上有安装指标的符号的未平仓头寸时才有效。您可以用鼠标移动线或启用自动跟踪买入价。 指标设置说明: colotLine - 线条颜色 WidthLine - 线宽 colotText - 文本颜色 FontSize - 文本的高度 Anchor - 文本的锚点方法 FollowBid - 跟随买入价
FREE

ZigZag 指标的多货币和多时间框架修改。 显示市场的当前方向、上次走势的高度、本次走势中的柱数以及锯齿形调整浪(水平线)的前一个点的突破。 这是 MTF 扫描仪。
您可以在参数中指定任何所需的货币和时间范围。 此外,当之字折线改变方向或突破前一点时,面板可以发送通知。 通过单击带有句点的单元格,将打开该符号和句点. 指标——连接关键低点和高点以显示趋势线
参数 Depth — 如果最后一根蜡烛的偏差小于(或大于)前一根,则 Zigzag 将不会绘制第二个最大值(或最小值)的烛台的最小数量; Deviation — 锯齿形形成局部顶部/底部的两个相邻烛台的最高点/最低点之间的最小点数; Backstep — 局部高点/低点之间的最小烛台数量; Bars to calculate ZZ — 历史中用于查找 ZigZag 点的柱的数量. ZZ-wave info — 表格中显示有关波形的哪些信息 — 仅当前波形或当前波形 + 上一个波形; Highlight the symbol when all periods are in the same direction — 方向时突出显
Indicator measures strength of each currency in your list.
Main idea: It simply iterates through all combinations of pairs and adds difference between open and close in percent. Parameters: List of currencies - what currencies will be calculated (maximum is 8) Calculation type - from which data will be strength calculated Calculation data input - used as input related to calculation type Symbol suffix - used in case of suffix on symbols, e.g: when your symbols look like EURUSDm, EURUSDmicro etc
FREE

BUY 1 and GET 1 FREE - Promotion!
Buy Smart Scalper PRO with a huge –60% discount and GET 1 FREE EA by your choice! Promo Price: $177
(Regular Price: $447 — You Save $270! Don't Miss!) After purchase contact me to get your GIFT EA! You can also contact me to get the list of available GIFT EAs! Smart Scalper PRO is the PRO version of the popular scalper BF Smart Scalper EA with a lot of new features/systems and improvements. Smart Scalper PRO is based on the most proven trading principle since

Parabolic SAR strategies EA is a Parabolic SAR EA that can support multiple strategies. Purchasing this EA can save you the time taken to automate your existing PSAR strategy through coding a custom EA and it also helps you discover profitable Parabolic SAR strategies as its fully compatible with the strategy tester and all settings are editable. The EA supports both scalping, short term and long term strategies. The various supported settings are explained below: NOTE: The default settings in

LinLit mq5 EURUSD is fully automated EA. The input parameters are optimized for EURUSD - M15 time frame, But can also work on other pairs, and CFD's and time frames We use, Commodity Channel Index, Force Index and Standard Deviation indicators EA NOT use Martingale, GRID, Averaging and other dangerous strategies! Full compliance with the FIFO method! Recommendations EA Settings : Use default settings. Symbol : EURUSD. Time Frame : M15. Brokers : ECN brokers, low spread/commission, 1:400 leverag

LinLit mq5 GBPUSD is fully automated EA. The input parameters are optimized for GBPUSD - M15 time frame, But can also work on other pairs, and CFD's and time frames We use, Bollinger Bands and Stochastic indicators EA NOT use Martingale, GRID, Averaging and other dangerous strategies! Full compliance with the FIFO method! Recommendations EA Settings : Use default settings. Symbol : GBPUSD. Time Frame : M15. Brokers : ECN brokers, low spread/commission, 1:400 leverage Minimum Deposit : $2

LinLit mq5 AUDCAD is fully automated EA. The input parameters are optimized for AUDCAD - M15 time frame, But can also work on other pairs, and CFD's and time frames We use, Directional Indicators and Bollinger Bands indicators EA NOT use Martingale, GRID, Averaging and other dangerous strategies! Full compliance with the FIFO method! Recommendations EA Settings : Use default settings. Symbol : AUDCAD. Time Frame : M15. Brokers : ECN brokers, low spread/commission, 1:400 leverage Minimum

LinLit mq5 EURAUD is fully automated EA. The input parameters are optimized for EURAUD - M15 time frame We use, Envelopes, Volumes and Money Flow Index indicators EA NOT use Martingale, GRID, Averaging and other dangerous strategies! Full compliance with the FIFO method! Recommendations EA Settings : Use default settings. Symbol : EURAUD. Time Frame : M15. Brokers : ECN brokers, low spread/commission, 1:400 leverage Minimum Deposit : $200 USD.
Parameters Entry lot size : Initial lot size

Warning! The default input values are already optimized for EURUSD at time frame M1, spread at 14 and hedged account mode with leverage 1:100 and initial deposit of US$ 10,000, if you don't have this balance, I suggest you to use a CENT account. Always use the strategy tester optimization to set the best values for your assets, time frame, spread and account mode. It is very important and strongly recommended for successful trading. Optimize the input values as your needs.The EA's Strategy: This
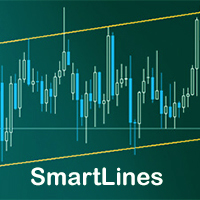
SmartLines allows you to open orders using trend lines. SmartLines for MT4 https://www.mql5.com/ru/market/product/25875
Now you have the opportunity to control breakthroughs of the trend corridor automatically and without delay. As soon as the price crosses your trend line with your settings, the order is automatically opened. You will not miss the moment of the trend change. The principle of working with SmartLines is similar to placement of pending orders. However, pending orders only have th

This EA take advantage from great markets movement by setting up pending orders on support and resistance lines, after that it wait the market movement to fill these orders, if it don't the EA deletes them and creates another pending orders. This system don't use grid neither martingale. It is simple and pure TakeProfit and StopLoss, and it has virtual trailing stop to mask trailing stop from server. It don't need to worry about news of high impact. It is advisor to use ECN account type with low

This utility ensures a real-time synchronization of multiple charts. Any event of a graphical object creation/modification/deletion, chart scrolling and zooming is copied from the current source chart to one or more receiving charts. Note: demo-version of this product doesn't work in the backtester! ______________________________________________________________ Settings: Synchronize with - select the receivers: Same symbol - all charts with the same symbol; Same symbol - all charts with the same

Технический индикатор Trend Moving Average позволяет определить глобальное направление рынка. Данный технический индикатор создан для того, чтобы определить «линию наименьшего сопротивления» рынка и понять в какую сторону направлен тренд. Помимо классического использования МА, индикатор позволяет понять направленность рынка на основе динамики его значений. Так, если значение индикатора демонстрируют переход с нисходящего значения в восходящее (и наоборот) - это является дополнительным торговым с
FREE

Технический индикатор Angry Alligator является расширенной авторский интерпретацией индикатора от B. Williams’а. Данный индикатор имеет такие же принципы работы, что и классический индикатор Alligator и основан на тех же параметрах. Ключевым отличием и преимуществом данного индикатора заключается в том, что в нем реализован дополнительный торговой сигнал в виде ещё одной линии. Продолжая тему B. Williams’а сигнал отображает «укус» котировок индикатором - Alligator’s Bite. Дополнительный параметр
Технический индикатор Awesome Oscillator является классической реализацией торгового подхода Билла Вильямса. Индикатор имеет те же параметры что и интерпретация в МТ5 (отображает дельту между МА с периодом 5 и 34 рассчитанную по средним ценам). Ключевым отличием является графическое отображение каждого торгового сигнала, что позволяет более качественно провести анализ актива и получить звуковое оповещение о появлении сигнала. Торговые сигналы индикатора: 1. Crossed zero line : данный торговый с

Технический индикатор Bollinger Bands классически отображается двумя линиями, которые демонстрируют отклонение котировок от МА 20. Для этого используется стандартное отклонение, параметр которого собственно и задаёт динамику двум полосам. Так как индикатор отображает момент повышенной волатильности на рынке, закрытие котировок за полосами свидетельствует об импульсном направлении рынка или же выхода с длительной зоны проторговки. Таким образом, работа на пробой позволяет войти в момент отклонени

Технический индикатор широко известен читателям и поклонникам стратегии «черепах». Отображается линией по нижней/верхней точке цены за определенный интервал времени. Значение ценового канала также используют для определения зон поддержки и сопротивления. Если котировки актива прорывают и закрываются ниже/выше канала, то это является сигналом работы в сторону пробоя. Способы применения: Индикатор является самодостаточным и не требует дополнительных фильтров для начала работы. Однако для надёжност

Технический индикатор Price Channel & Bollinger Bands является комбинацией двух наиболее популярных канальных индикаторов. Данный индикатор отображает моменты пробоя как каждого канала по отдельности, так и генерирует сигналу в момент одновременного закрытия цен за линиями поддержки/сопротивления. Каждый пробой подсвечивает свечу определенным цветом, что позволяет убрать линии для более комфортной работы с графиком. В случае одновременного пробоя PC и BB, индикатор также отобразит необходимый ма

Технический индикатор Universal Oscillator является комбинацией торговых сигналов самых популярных и широко используемых осцилляторов. Индикатор представлен гистограммами, а также линиями fast и slow MA, что позволяет расширить список получаемых торговых рекомендаций и работать как по тренду, так и в боковом движении рынка. Таким образом, гистограммы позволяют определить момент пробоя ценовых значений и движение в новой фазе рынка, а линии указывают на зоны перекупленности и перепроданности. Ос
Данный софт позволяет вам управлять своими параметрами риска и мани менеджмента. Вы можете задавать параметр риска как на текущий капитал, так и на предполагаемый уровень депозита, что позволит контролировать риски в каждой сделке и в каждом активе. Open order script также позволяет задать фиксированный объём открытия операций и вести торговлю «в один клик» благодаря реализации дополнительных кнопок Sell / Buy непосредственно на график. Особенность скрипта
Ключевой особенностью и характеристик

Основа работы советника, это увеличение лота и их усреднение, но основное отличие, это пропорциональная торговля. Благодаря этому параметры советника не будут переоптимизированны. Советник торгует одновременно в обе стороны, без индикатора. Самая важная информация о работе выводится на график. Главное правило- это правильно оптимизировать советник. Покупки и продажи оптимизируются отдельно, для этого следует выключить LONG TRADES OPEN или SHORT TRADES OPEN. Начинать оптимизировать советник на

This Expert Adviser is based on the crossover of moving averages. The user can select to employ up to 10 moving averages which crossover each other to execute market orders (open and close trades). The selected number of moving averages to crossover each other for opening trades and their individual configurations are independent of the selected number of moving averages to crossover each other for closing trades and their individual configurations. The user can also choose to configure up to 5

SonicTradeCopier: (Best for scalping)
Easy Fast Reliable trade copier. Copy trades from one terminal to an other (internet copy feature coming soon.)
MT4 to MT4. MT4 to MT5. MT5 to MT5. MT5 to MT4. MT4/MT5 to any other platform copy possibility for custom made solutions. Reverse trading. Advance filters for traders.
Features:
(Setting up copying policies) Sender only has to setup signal name and start sending signals [ You must start signal sender first always ]. Receiver sets up signal nam

VR Donchian 指标是 Donchian 通道的改进版本。改进几乎影响了通道的所有功能,但主要的操作算法和通道构造被保留。根据当前趋势,水平颜色的变化已添加到球指示器中 - 这可以清楚地向交易者显示趋势或持平的变化。添加了通过智能手机、电子邮件或 MetaTrader 终端本身通知交易者有关两个通道级别之一突破的功能。添加了价格标签,交易者可以在其帮助下查看图表上的价格水平。由于交易者可以自己设置指标计算的周期数,经典唐奇安指标的运行算法得到了优化和加速。经典的 Donchian 指标计算 MetaTrader 终端中可用的整个历史记录,这会给 MetaTrader 终端带来大量数学计算负载。 VR Donchian 指标仅计算交易者在设置中设置的金额,这将 MetaTrader 终端的负载减少了数十倍和数百倍。 高质量的交易机器人、指标、配置文件中的设置 [作者] Donchian Channel 是由 Richard Donchian 开发的通道指标。唐奇安通道被认为是最准确的通道之一。经典的唐奇安通道指标严格建立在局部高点和低点的顶部,是交易区间突破规则的变体。 优点 显
FREE

The xCustomEA for MetaTrader 5 — 适用于自定义指标的通用交易 Expert Advisor 将几乎任何自定义指标快速转化为自动化交易系统。 The xCustomEA for MetaTrader 5 是一款通用型 Expert Advisor,能够读取您的自定义指标信号,并按照您设定的逻辑自动执行交易。 您只需要填写指标名称、信号缓冲区和关键参数,EA 就会基于这些数据完成自动执行。对于希望把自定义指标快速接入实盘交易、又不想为每一个新想法都重新编写一个机器人 的交易者和开发者来说,这是一个高效、灵活且可重复使用的交易引擎。 The xCustomEA 并不只是一个“信号转订单”的简单工具。它把自定义指标接入能力与 The X 产品线成熟的交易架构结合在一起,为您提供完整的进场、出场、过滤、保护和持仓管理环境。 The xCustomEA for MetaTrader 4 | 完整使用说明 + DEMO + PDF | 设置与输入参数说明 | PIPFINITE TREND PRO 策略示例 | The X — Universal EA 产品定位 这款

DeMarker指标,支持多时间框架,可自定义视觉信号及可配置警报系统。
自由职业编程服务、更新和其他TrueTL产品可在我的 MQL5主页 获取。
非常欢迎您的反馈和评价!
什么是DeMarker? DeMarker指标由汤姆·德马克(Tom DeMark)开发,将当前K线内的高低点与前一根K线的范围进行比较。在0到1之间波动,高于0.7视为超买,低于0.3视为超卖。与其他振荡器不同,它专注于方向性极端运动和K线内的疲竭,而非测量收盘价的动能。 DeMarker信号在指标穿越极值区域(0.7和0.3)时,或在指标与价格出现背离时生成。在识别真正的疲竭点方面,其被认为比简单随机指标更加可靠。 功能特点: 带箭头和垂直线的视觉信号标记 三个具有可配置触发器的独立信号缓冲区 信号检测选项:方向变化、穿越水平线、峰值/谷值 每个信号的可配置警报功能(邮件、推送、声音、弹窗) 支持插值方法的多时间框架(MTF)功能 柱状图或折线图绘制模式 多种颜色模式(简单、基于方向、基于水平) 通过自定义指标调用(iCustom)访问缓冲区,支持Expert Advisor(EA)集成 输入参数: 基
FREE

动量(Momentum)指标,支持多时间框架,可自定义视觉信号及可配置警报系统。
自由职业编程服务、更新和其他TrueTL产品可在我的 MQL5主页 获取。
非常欢迎您的反馈和评价!
什么是动量指标? 动量指标通过将当前价格与n个周期前的价格进行比较来衡量价格变化的速度。高于100的值表示上升动量(当前价格高于n个周期前),低于100的值表示下降动量。100处的中心线作为零参考。它是最简单却最有效的趋势强度指标之一,帮助交易者及早进入趋势并识别疲竭点。 动量信号在穿越100线(趋势转换)、穿越自定义水平线或出现背离时生成。价格上涨时动量上升确认趋势,而价格上涨时动量下降则暗示可能的反转。 功能特点: 带箭头和垂直线的视觉信号标记 三个具有可配置触发器的独立信号缓冲区 信号检测选项:方向变化、穿越水平线、峰值/谷值 每个信号的可配置警报功能(邮件、推送、声音、弹窗) 支持插值方法的多时间框架(MTF)功能 柱状图或折线图绘制模式 多种颜色模式(简单、基于方向、基于水平) 通过自定义指标调用(iCustom)访问缓冲区,支持Expert Advisor(EA)集成 输入参数: 基本设
FREE

Free automatic Fibonacci is an indicator that automatically plots a Fibonacci retracement based on the number of bars you select on the BarsToScan setting in the indicator. The Fibonacci is automatically updated in real time as new highest and lowest values appears amongst the selected bars. You can select which level values to be displayed in the indicator settings. You can also select the color of the levels thus enabling the trader to be able to attach the indicator several times with differe
FREE

Description
The base of this indicator is an ZigZag algorithm based on ATR and Fibo retracement. The ZigZag can be drawn like a classic ZigZag or like Arrows or needn't be drawn at all. This indicator is not redrawing in sense that the ZigZag's last shoulder is formed right after the appropriate conditions occur on the market. The shoulder doesn't change its direction afterwards (can only continue). There are some other possibilities to show advanced information in this indicator: Auto Fibo on

This indicator uses volume and volatility information to indicate the trend or to indicate the market reversion/correction. There are 2 indicators in one. The indicator works in two styles: values per candle and accumulated values. Using the volume and volatility information, when well adjusted, this indicator has a good probability to indicate the right direction, both in lower (M1, M2, M5) and higher (M15, M30) timeframes.
Strategy 1: Trend indicator Indicates the operation direction. To us

Swing Points are those places on the chart where price changes direction. This is an MT5 version of my MT4 Swing Points Indicator. Found on the code base at https://www.mql5.com/en/code/15616 and in the market at https://www.mql5.com/en/market/product/22918
The beginning input parameters allow you to configure your alerts. Turn on screen alerts allows you to turn on and off screen alerts. True is on, false is off. Turn on push to phone alerts allows you to turn on and off push to phone aler

Description
The base of this indicator is an ZigZag algorithm based on ATR and Fibo retracement. This indicator is not redrawing in sense that the ZigZag's last shoulder is formed right after the appropriate conditions occur on the market. The shoulder doesn't change its direction afterwards (can only continue). Note: An indicator with advanced possibilities is also available.
Indicator input parameters
The input parameters allow to change the sensitivity of the ZigZag. ATR period ATR multip
FREE

Average True Range. Fully automatic. Calculates last candle high and low for finding trends. Strong results with british pound in daily charts. Uses Atr modificable periods, trailing stop and take profit. Tested in real accounts. Is a great expert advisor with great results. You can choose the risk you want to take. Can calculate automaticaly the total amount of risk for new trades. Tested with 10 years data. Best inputs 1 atr for open, 2 for close. Atr settings to 200.
具有多时间框架支持、可自定义视觉信号和可配置警报系统的Williams %R指标。
自由职业编程服务、更新和其他TrueTL产品可在我的 MQL5主页 获取。
非常欢迎您的反馈和评价!
什么是Williams %R? Williams %R是由拉里·威廉姆斯开发的动量振荡器。它在-100到0的范围内运动。接近0的值表示超买状态,接近-100的值表示超卖状态。Williams %R是一个反向随机振荡器,测量收盘价相对于特定时期高低点范围的位置。超买/超卖水平(-20和-80)的穿越产生交易信号。 该指标帮助交易者识别潜在的反转点:当%R向下穿越-20线时,可能预示着即将到来的调整;当它向上穿越-80线时,可能表明可能的反弹。Williams %R与价格之间的背离可能在趋势反转前提供强烈的预警信号。 功能特点: 带箭头和垂直线的视觉信号标记 三个独立信号缓冲区,具有可配置触发器 信号检测选项:方向变化、级别穿越、峰/谷 每个信号可配置警报(电子邮件、推送、声音、弹出窗口) 具有插值方法的多时间框架(MTF) 柱状图或折线图显示模式 多种颜色模式(单色、基于方向、基于级别) 通过iCu
FREE

具有多时间框架支持、可自定义视觉信号和可配置警报系统的OsMA(MACD柱状图)指标。
自由职业编程服务、更新和其他TrueTL产品可在我的 MQL5主页 获取。
非常欢迎您的反馈和评价!
什么是OsMA? OsMA(移动平均振荡器)是MACD与其信号线之间的差值,也称为MACD柱状图。正值表示MACD位于信号线上方(看涨动量),负值表示MACD位于信号线下方(看跌动量)。零线穿越对应MACD/信号穿越,标志着潜在的趋势转变。增长的柱体显示动量增强,缩小的柱体显示动量减弱。 OsMA信号在零线穿越(趋势转变)、OsMA与价格之间出现背离以及检测到柱状图峰谷时生成。该指标帮助交易者高精度地测量动量运动的强度和方向。 功能特点: 带箭头和垂直线的视觉信号标记 三个独立信号缓冲区,具有可配置触发器 信号检测选项:方向变化、级别穿越、峰/谷 每个信号可配置警报(电子邮件、推送、声音、弹出窗口) 具有插值方法的多时间框架(MTF) 柱状图或折线图显示模式 多种颜色模式(单色、基于方向、基于级别) 通过iCustom访问缓冲区,可与专家顾问(EA)集成 输入参数: 基本设置: 快速EMA周期
FREE

MovingInWL Expert Advisor 旨在在达到某个预定利润水平时将未平仓头寸的止损移至无亏损。 顾问设置说明: MagicNumber - 订单标识符 LevelProfit - 位置必须达到的利润水平,以点为单位,以便将其止损移动到没有损失的水平。 LevelWLoss - 不亏损的点数水平,当其盈利达到 LevelProfit 点数 水平后,止损头寸将转移到该水平。 MovingInWL Expert Advisor 旨在在达到某个预定利润水平时将未平仓头寸的止损移至无亏损。 顾问设置说明: MagicNumber - 订单标识符 LevelProfit - 位置必须达到的利润水平,以点为单位,以便将其止损移动到没有损失的水平。 LevelWLoss - 不亏损的点数水平,当其盈利达到 LevelProfit 点数 水平后,止损头寸将转移到该水平。
FREE

Benefit EA
Uses only hedging accounts. Benefit EA is a non-indicative flexible grid adviser with special entry points that provide a statistical advantage, revealed through the mathematical modeling of market patterns. The EA does not use stop loss. All trades are closed by take profit or trailing stop. It is possible to plan the lot increments. The "Time Filter" function is set according to the internal time of the terminal as per the displayed time of the instrument's server, not the oper

VVVVVVVVVVVVVVVVVVVVVVVVVVVVVVVVVVVVVVVVVVVVVVVVVVVVVVVVVVVVVVVVVVVVVVVVVVVVVVVVVVVVVVVVVVVVVVVVVVVVVVVVVVVVVVVVVVVVVVVVVVVVVVVVVVVVVVVVVVVVVVVVVVVVVVVVVVVVVVVVVVVVVVVVVVVVVVVVVVVVVVVVVVVVVVVVVVVVVVVVVVVVVVVVVVVVVVVVVVVVVVVVVVVVVVVVVVVVVVVVVVVVVVVVVVVVVVVVVVVVVVVVVVVVVVVVVVVVVVVVVVVVVVVVVVVVVVVVVVVVVVVVVVVVVVVVVVVVVVVVVVVVVVVVVVVVVVVVVVVVVVVVVVV
Versión demo : https://www.mql5.com/es/market/product/31528 Demo version https://www.mql5.com/en/market/product/24470
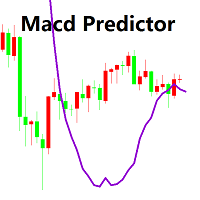
Macd 的主图指标 1.您可以提前一段确定MACD将从买入转为卖出的价格,反之亦然。它是振荡器预测器的表亲。如果你当时就知道一个仓位,那么确切的价格,当前和下一个(未来)柱将需要达到MACD交叉。在你的当前头寸受到下一个MACD交叉力量的帮助或阻碍之前,你还可以看到市场必须走的距离。您可以在所有时间范围内执行此操作,因为预测器会实时更新。
2.您可以通过MACD预测变量历史清楚地观察价格行为来确定市场上的“动态压力”,直接叠加在条形图上。动态压力是指市场对买卖信号的反应。如果你在MACD卖出30分钟并且市场持平,那么你就知道下一个买入信号很容易成为大赢家!这是我经常用标准的 MACD做的事情,但现在它更容易看到!
参数: Fast EMA - period of the fast Moving Average. Slow EMA - period of the slow Moving Average. Signal EMA - period of the Signal line.

Warning! The default input values are already optimized for EURUSD at time frame M1, spread at 16 and hedged account mode with leverage 1:100 and initial deposit of US$ 500. Always use the strategy tester optimization to set the best values for your assets, time frame, spread and account mode. It is very important and strongly recommended for successful trading. Optimize the input values as your needs. The EA's Strategy: This expert advisor uses 2 built in indicators (Zig Zag and CCI) in order t
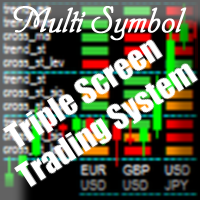
Purpose The indicator is intended for manual multi-currency trading based on the Triple Screen Strategy. It works with any symbols located in the Market Watch window of the MT5: currencies, metals, indexes, etc. The number of instruments can be limited by capacity of the МТ5's parameters. But if desired, you can create several windows with various set of instruments and parameters.
Operation Principle The indicator uses the modified Triple Screen Strategy for determining trend direction in the
The expert allows you to build a trading system based on an arbitrary set of technical indicators MT5. The EA uses the following signals: - OpenBuy / OpenSell - opening positions;
- StopBuy / StopSell - closing positions;
- TakeProfitBuy / TakeProfitSell - get TP levels;
- StopLossBuy / StopLossSell - getting SL levels;
- NoLossBuy / NoLossSell - transfer to the breakeven state;
- MinProfitBuy / MinProfitSell - closing part of a position;
- CancelBuy / CancelSell - allow a repeated signal to ope
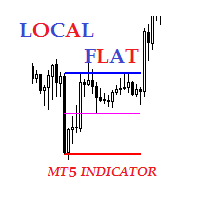
Description The indicator of local flat. The indicator allows to find local flats in the following options: Width of channels that is not more than certain number of points Width of channels that is not less than certain number of points Width of channels that is not more and not less than certain number of points The indicator displays the middle and boundaries of the channel. Attaching multiple instances of the indicator to the chart with different ranges leads to displaying a system of chann
MetaTrader市场是独有的自动交易和技术指标商店。
阅读MQL5.community用户备忘更多地了解我们提供给交易者的独特的服务:复制交易信号,自由职业者开发的自定义应用程序,通过支付系统完成的自动付款和MQL5云网络。
