适用于MetaTrader 5的新EA交易和指标 - 38

介绍 Heracles 指标。该指标使交易变得简单,无需进行分析。它会自动识别积累区域、入场点,并提供明确的止盈水平。
Heracles 指标会在价格达到买入或卖出入场点时提醒您,并显示信号箭头,同时建议三个止盈水平。
它适用于新手和专业交易员。
支持渠道: 点击这里 MT4 版本: 点击这里
建议:
时间框架:M5 和 M15 货币对:任何货币对 账户类型:ECN、Raw 或 Razor,具有非常低的点差 建议止损:50 点或高/低区域 建议止盈水平:25 点、50 点和75 点
规格: 1/ 自动绘制积累区域 2/ 自动建议买入/卖出入场点 3/ 高精度建议三个止盈水平 4/ 面向初学者的用户界面 5/ 包括提醒通知
联系: 如果您有任何问题或需要帮助,请随时通过私信与我联系。

QM (Quasimodo) Pattern is based on Read The Market(RTM) concepts. The purpose of this model is to face the big players of the market (financial institutions and banks), As you know in financial markets, big traders try to fool small traders, but RTM prevent traders from getting trapped. This style is formed in terms of price candles and presented according to market supply and demand areas and no price oscillator is used in it. RTM concepts are very suitable for all kinds of investments, includi

首先值得强调的是,这个交易系统是一个不重绘、不重画和不滞后的指标,这使它非常适合专业交易。
“智能支撑和阻力交易系统”是专为新手和经验丰富的交易者量身定制的先进指标。它赋予交易者在外汇市场上精确和自信的能力。这个综合系统结合了7+种策略、10个指标和各种交易方法,包括日内交易策略、波段交易策略、支撑和阻力策略、蜡烛图模式策略、VWAP策略、多时间段趋势策略等。它提供箭头信号、入场和出场点、交易警报、更高时间框架的趋势分析、实时交易监控以及见解深刻的趋势和成交量蜡烛染色。通过自动支撑和阻力检测,这是一个多面手的指标,帮助交易者在不同的市场条件下做出明智的决策。
“智能支撑和阻力交易系统”是一个强大的技术分析方法,融合了一套高端和强大的指标和工具。在其核心,这个系统识别关键的支撑和阻力水平,这些水平作为潜在市场反转或延续的关键区域。该系统无缝集成了多时间框架趋势面板,增强了交易者在不同时间框架下评估当前趋势方向的能力。此外,蜡烛图模式检测器扫描价格图表以获取重要的蜡烛图模式,为潜在的市场走势提供宝贵的见解。此外,VWAP(成交量加权平均价格)的加入帮助交易者评估市场情绪和日内趋势

描述 :
“市场结构 HH HL LH LL”指标是分析金融市场价格动态的强大且简单的工具。该指标帮助交易者和投资者识别趋势变化并识别价格时间序列中的重要点。
该指标的关键组成部分:
HH(较高高点):价格收盘高于前一个高点的顶部。 HH 表明上升趋势加强。 HL(较高低点):价格收盘高于前一个低点的最低值。 HL确认了上升趋势的延续。 LH(较低高点):价格收盘低于前一个高点的顶部。 LH 预示着趋势可能逆转。 LL(较低低点):价格收盘低于前一个低点的最低值。 LL 确认下降趋势的开始。
如何使用:
“市场结构HH HL LH LL”指标帮助交易者和投资者确定市场的当前趋势。上升趋势以 HH 和 HL 序列为特征,下降趋势以 LH 和 LL 序列为特征。当趋势发生变化时,它可以作为在市场上开仓或平仓的信号。
使用示例:
假设您持有一只股票的多头头寸,并且指标显示 LH 和 LL 序列,表明下降趋势可能开始。这可能是平仓或设置止损限额的信号。
下图显示了下降趋势的示例以及该趋势被突破的示例。

介绍 Volatility Doctor Desert Eagle:您的终极高频交易算法,助您在爆炸性交易成功中一展身手!
您准备革新您的交易游戏了吗?不用再寻找,就在 Volatility Doctor Desert Eagle - 旨在赋予您精确、控制和盈利能力的终极高频交易算法。以下是 Volatility Doctor Desert Eagle 胜出众多竞争者的原因:
1) 简单易懂:没有复杂术语或陡峭的学习曲线。我们的算法拥有简单易懂的参数,确保各技术水平的交易者都能运用其威力。
2) 数据驱动决策:利用市场波动率的稳健度量来指导您的交易决策。告别猜测,迎来基于数据的策略。
3) 全面掌控:通过完全控制每个单独设置来接管掌控权。调整算法以适应您独特的交易风格和喜好。
4) 无法匹敌的价值:我们相信为客户提供卓越价值。Volatility Doctor Desert Eagle 以极具竞争力的价格提供高级功能,使其适用于希望最大化投资回报的交易者。
5) 人性化的资金管理:通过以货币术语而非抽象点数或点(pips)来思考,简化资金管理。我们让您更轻松地
FREE

波动性医生 - 您掌握市场节奏的专家顾问!
您准备好解锁精准交易的力量了吗?认识波动性医生,您在外汇市场动态世界中的可靠伙伴。这款多货币专家顾问不仅是一种交易工具,更像是一位交响乐指挥家,以无与伦比的精度指导您的投资。
发现关键特点:
1. 寻找趋势的专业知识:波动性医生采用经过验证的方法来发现强劲的市场趋势。告别猜测,迎接明智的决策。
2. 全面控制:利用内置的资金管理工具掌握您的交易策略。决定在任何时候开多少个头寸以及增加交易规模的程度。这是您的剧本,您的方式。
3. 波动性大师:正如其名称所示,这款EA专注于测量和反映市场波动性。就像水会采取其容器的形状一样,它会无缝地适应市场条件。 4. 您的利润目标:设定您的利润目标,让波动性医生不知疲倦地努力实现它们。就像拥有金融GPS一样,引导您到达目的地。
5. 突破掌握:在其核心,这款EA依赖于复杂的移动平均通道策略。它耐心地等待价格突破,然后与市场波动性同步进行操作。
6. 账户友好:无论您是使用小型还是大型账户进行交易,波动性医生都会适应您的需求。这是您的财务平衡器。
为什么选择波动性医生?
FREE

Microlab Exp is a trending analytical bot. An expert system based on geometric virtual pattern algorithms specially designed for time series.
For this version of the Expert Advisor to work, there is no need to download any indicators or additional products, the bot is an independent finished product.
Microlab Exp is a tool for trading in the foreign exchange market.
The minimum recommendation is $1000. While the recommended minimum deposit is between $1,000 and $10,000 for one currency pa

该指标基于著名的分形指标,但具有很强的定制性 和灵活性,
这是识别趋势逆转并最大化您的利润潜力的强大工具。
凭借其先进的功能和用户友好的界面,它是各个级别交易者的最终选择。 MT4 版本: Ultimate Fractals MT4 特征 :
可定制的分形蜡烛数。 反转线。 可定制的设置。 用户友好的界面。 主要参数: 左侧蜡烛 - 左侧形成分形的条形数量。 右侧蜡烛 - 分形右侧的条形数量。
不要让市场的不确定性阻碍您。使用“终极分形”指标提升您的交易游戏。
加入成功交易者的行列,依靠此工具做出自信的决策并实现财务目标。 请随意定制此产品描述,以突出显示您的特定“Ultimate Fractals MT5”指标的任何独特功能或优点,
并向我询问有关产品的任何问题或建议。
FREE

"Envelope of Adaptive Moving Average" 指标是一种帮助您在金融市场做出明智决策的工具。它旨在为您提供清晰的趋势方向以及交易中可能的入场和出场点。
该指标基于自适应移动平均,这意味着它会自动调整以适应市场波动性的变化。这使其在既可能平静又可能波动的市场中特别有用。该指标显示两条包围自适应移动平均线的线条。这些线条有助于识别关键的支撑和阻力水平,从而使您更明智地决定何时买入或卖出资产。
尽管它是一种高级技术工具,但易于理解和使用,适用于新手和经验丰富的交易者。该指标能够适应不断变化的市场条件,使其在各种情况下都具备灵活性和有效性。它提供了市场趋势的清晰视觉表现,有助于避免冲动交易。该指标可以成为您交易工具箱中宝贵的工具。
FREE

The Stochastic Oscillator is one of the main indicators used in the analysis of financial assets. It is one of the highlights in the study of price movements and can be an important indicator of changing trends in the capital market. Stochastic is an oscillator used to identify when an asset is overbought or oversold. It consists of two lines: %K, which is calculated from the highs and lows of a period, and %D, which is a moving average of %K. Our version contains color filling, which facilitate
FREE

推出Emperor Trend Dominator EA,终极自动交易解决方案,将彻底改变您的交易之旅。 Empire Trend Dominator EA 经过数年的测试,覆盖了市场的许多空白,专为 US30_SPOT 高精度设计,并采用尖端技术,是您在动态的金融市场世界中获取可靠潜力的门户。
限时优惠:Emperor Trend,现仅需 599 美元!每购买10次价格就会上涨
*** 购买 Empire Trend Dominator EA 并成为我们的私人会员之一,您可以拥有免费的单独工具或 EA *** Empire Trend Dominator EA 采用创新的自我导向方法,能够规避市场波动、新闻相关的波动,以及最重要的是,规避动荡和波动的市场情况。它基于价格行为、支撑/阻力、移动平均线和波动性指标、风险管理和复杂算法,为准确捕获信号奠定了坚实的基础。这种特殊的属性使其有别于传统的交易技术和智能交易系统,即使面对不可预测的市场条件,也能提供更简化的交易体验。
好处: 24/7 优先支持:作为尊贵的私人会员,您可以获得全天候的顶级客户支持。您的疑问和疑虑将得

Представляем Вам Volatility Doctor Basic Edition: Вашего главного мага на рынке!
Вы готовы отправиться в путешествие, чтобы разблокировать настоящий потенциал точной торговли? Позвольте нам представить Вам Volatility Doctor, Вашего надежного союзника в постоянно меняющемся мире рынков Forex. Этот выдающийся мультивалютный советник - это не просто инструмент для торговли; это виртуоз, дирижирующий Вашими инвестициями с непревзойденной точностью и изяществом.
Откройте для себя функции, меняющ
FREE

The Dow Jones index, also known as the US30, is a very well diversified index with a unique way of weighting it’s components. These factors often make this index’s open a bit more rangebound, so instead of trading breakouts, The US30 Market Maker uses limit orders and stop-limit orders to trade the opening range. Both take-profit and stop-loss is based on current volatility, and the EA does NOT use martingale, grid systems, hedging or other types of risky money management tactics! I have traded
TradeFlow Dashboard MT5 代表了交易管理的典範轉移,提供了強大且多功能的解決方案,旨在提升您的風險管理策略並簡化 Meta Trader 5 平台內的決策。 憑藉其時尚且用戶友好的介面,該工具超越了傳統的交易體驗,特別適合希望提高業績的手動交易者。
讓我們深入研究 TradeFlow Dashboard MT5 的主要亮點,探索每個功能如何為無縫且強大的交易體驗做出貢獻:
無縫訂單執行: TradeFlow Dashboard MT5 讓您能夠無比輕鬆地執行買入、賣出、限價和停損訂單。 無論您喜歡固定手數還是透過百分比管理風險,該工具都能適應您獨特的交易風格,為每筆交易提供精確性和控制。
輕鬆啟動追蹤停損: 一鍵啟動追蹤停損帶來了一定程度的適應性,這對於駕馭市場的動態本質至關重要。 您的停損會根據市場走勢動態調整,提供在快節奏的交易環境中至關重要的靈活性和反應能力。
主動市場崩潰保護: 市場崩潰過濾器是風險管理領域的遊戲規則改變者。 設定每日最大回檔百分比,TradeFlow Dashboard MT5 會採取主動措施,在達到限制時自動平倉所有未
FREE

介绍终极外汇专家顾问:一只旨在轻松征服自动交易的野兽。 这不仅仅是另一个专家顾问;它是一台真正的强大工具,旨在彻底改变您的交易体验。 经过14年的不懈测试、改进和坚定的奉献,我自豪地呈现了一款名副其实、物有所值的专家顾问。 以下是它与众不同之处: 无与伦比的灵活性:
这款专家顾问在所有货币对上无缝运作,让您能够探索无尽的交易机会,最大化潜在利润。 量身定制的风险管理:
通过六种不同的止盈和止损选项,您可以自由调整和定制符合您的风险承受能力和交易风格的策略。 令人印象深刻的胜率:
体验高达90%的胜率带来的强大优势,让您在市场中占据重要地位。
我们的专家顾问采用先进的算法和精确的市场分析,确保交易以出色的准确性执行。 征服市场逆境:
即使市场似乎对您不利,这款专家顾问也知道如何精确导航。
它采用复杂的技术保护您的仓位,将损失降至最低,并利用每一个可用的机会。 掌握主动权和控制权:
通过用户友好的界面掌控您的权益回撤和盈利能力。
您可以轻松调整设置,根据您的风险偏好和交易偏好优化性能。 全天候技术支持:
我们理解及时协助的重要性。
因此,我们专门的专家团队全天候为您解决
Product Description : Avalut Gold Light FULL VERSION The fully automated gold trading system from Edgezone
Links : Avalut Gold User Manual Website Linktree Avalut Page Live Results Real Account
Why Choose Avalut Gold Light? Superiority : Our systems are developed using state-of-the-art methods (SPP, Walk Forward, Monte Carlo, and many more)! Time Savings: Enjoy your precious time while the system monitors the gold market around the clock and executes trades. Profitability : The proven

This is a simple Candle Stick Pattern Indicator, which shows in the current time period all standardisized Patterns in the chart. All Patterns will be calculatet automatically based on standard conditions. Following Candle Stick Patterns are included: Bullish Hammer | Bearish Hammer Bullish Inverted Hammer | Bearish Inverted Hammer Bullish Engulfing | Bearish Engulfing Piercing | Dark Cloud Cover Bullish 3 Inside | Bearish 3 Inside There are only a few settings at the begining to take. Every Pat
FREE
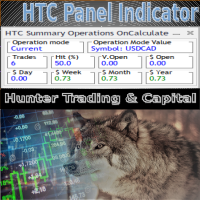
HTC Panel Indicator is an operational summary dashboard for use in conjunction with trading EA.
It provides a concise summary of the current year's trades, open positions and profit history.
The summary can be filtered by the current chart asset, by the ID (magic number) of an EA or by all trades performed in the year.
The panel must be inserted into the chart as an indicator, making it possible to add it to a chart that already has a trading EA.
FREE
Robô para Operações com Opções da B3 - Versão Mapa Demo
Ele permite executar operações com opções de ativos da B3, desde a montagem de uma posição simples com opções e o ativo, até 4 pernas, e operações estruturadas, rolagens, rodar strike, e fechar posição, tudo de forma simples e intuitiva.
Mostra o mapa das opções por vencimento, com seus principais valores, as gregas, preço teórico, últimos volumes, e diversos indicadores relacionados as opções, além de indicar as opções que se está pos
FREE

Strong Candle Indicates the size of each candlestick with the text value above it and indicates which candlestick has a body larger than the one specified in the parameters in percentage, that is, a strong candlestick (between Size_Min and Size_Max) with at least x% of body. The candlestick size is placed in the buffer and that is the buy or sell indication, where: value > 0 = bullish candle or value < 0 bearish candle, value = 0 means no indication (the candle did not match the desired pattern
Unlock the power of synchronized chart analysis with Chart Sync, your ultimate solution for harmonizing technical objects across multiple charts on the same trading symbol,
ChartsSync Pro MT5 is a groundbreaking MetaTrader 5 utility designed to streamline your trading workflow, enhance analysis precision, and amplify your trading decisions.
Features:
Effortless Object Synchronization.
Multi-Chart Harmony.
User-Friendly Interface.
Real-Time Updates.
Sync Objects Color,Width and Style.
FREE

The Expert Advisor Core Reincarnation works with ticks on both netting and hedging account types. The internal algorithm uses a tick (not a bar) as a unit for analysis. The product works with 5-digit quotes. Requotes are critical. A broker with the minimum execution delay is required. The Expert Advisor does not use history stored in the database. It downloads history data online creating its own database stored in the internal memory. After the restart, the database is deleted and should b

Celestia - Your Stellar Companion in Automated Trading
Real Account Celestia EA medium risk https://www.mql5.com/de/signals/2051245
Description: Introducing Celestia, your cutting-edge automated trading companion designed to illuminate your journey in the dynamic world of financial markets. Powered by advanced algorithms and state-of-the-art technology, Celestia stands as a beacon of precision and efficiency in the realm of algorithmic trading. Key Features: Galactic Algorithms: Celesti

Sentinex EA - A Cutting-Edge Grid Robot for Proficient Traders
Description: Welcome to Sentinex EA, your gateway to exceptional grid-based trading on the MetaTrader 4 platform. Developed by a team of seasoned experts, Sentinex EA is a state-of-the-art trading robot designed to empower traders with advanced grid strategies, meticulously crafted to navigate the dynamic financial markets with precision and finesse.
Key Features: Intelligent Grid Strategy: Sentinex EA employs an innovative grid

UP MT5 is a smart grid trading system that leverages the power of momentum, trend trading & breakouts to analyze large amounts of market data to detect high-probability trading opportunities to exploit.
Supported currency pairs: EURUSD, GBPUSD, USDJPY, GBPJPY, NZDUSD
Manual Guide
Timeframe: H1 When Trying The Demo: If you are looking to try out a certain set file please direct message me and I will send you one based on the account size you would need Features -------------- Multiple cur

Introducing Auto Trendline Pro : Your Ultimate Trading Companion Are you tired of manually drawing trendlines on your forex charts? Do you wish for a tool that can simplify your trading while providing timely alerts? Look no further, because Auto Trendline Pro is here to revolutionize your trading experience. In the fast-paced world of forex trading, staying ahead of the curve is essential. Identifying trends, both upward and downward, can be a game-changer. This is where Auto Trendline Pro ste

In the ever-evolving world of Forex trading, understanding the different trading sessions is paramount to making informed trading decisions. Each trading session brings its own unique characteristics, opportunities, and challenges, and recognizing these can greatly enhance your trading strategies. Whether you're a novice or a seasoned trader, the Forex market's three main trading sessions – Asian, London, and New York – are crucial milestones that dictate market behavior and potential trade set
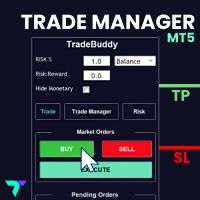
This adds an easy to use trading panel to your MetaTrader5 chart, enabling you to enter the market at lightning speed with your risk automatically calculated. Plus, it will help you automate your trade management with automatic & one click partial profits, stop loss to breakeven and more. Click here for the full Trade Buddy user guide If you want to test Trade Buddy before you purchase, please message us by visiting our profile and we will provide you with a 7 day free trial. Best of all, it’s c

"Triple Performance" Trading Strategy Harness the market's full potential with this dynamic strategy! Key Indicators: MACD (Moving Average Convergence Divergence): Identifies trend reversals. RSI (Relative Strength Index): Signals market conditions. CCI (Commodity Channel Index): Measures market strength. Main Benefits: Maximize profits by utilizing clear signals. Automatic position control with MACD. Easy customization with configurable RSI and CCI levels.
Works perfectly with EUR/
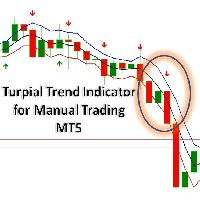
Turpial Trend Indicator for Manual Trading. Indicator (arrow) for all Symbols and Periodicity. This indicator considers a pullback strategy and a trend strategy. The strategy that is based on criteria for the Rsi, Atr and Macd indicators. The channel band corresponds to the maximum and minimum average values of three bars (Bill Williams 3-bar strategy). BUY when there is a Green Arrow. It is advisable to place the StopLoss below the bottom line of the channel. SELL when there is a Red Arrow. I

The advisor trades based on a developed indicator that allows you to determine the correct entry points when the price continues its unidirectional movement.
Extensive experience in trading allowed me to correctly create a robot according to my personal strategy, which loves working with a volatile market. Therefore, the system is not afraid of news and works around the clock. For better results, a martigail has been added to the system, which increases profitability in a volatile market. Lik

As the name suggests, the scalper opens trade only when precise conditions are met in the market based on strict entry criteria. The entry points are calculated using price action, trend analysis and candlestick analysis without relying on any lagging indicators. Every trade has fixed stop loss . Take Profit to Stop Loss ratio is more than 3:1 in default settings. The EA trades best on EURUSD on the M5 timeframe (refer screenshot). You can contact me after purchase to help you set up the EA.

The Bollinger Band Indicator, favored by institutional traders, offers a swift and comprehensive assessment of market conditions. It's an indispensable tool to distinguish between trending and sideways markets. This multifaceted indicator provides insights through three distinct means: Bollinger Bands, candle analysis, zigzag, and external swing. Trend Analysis: Bollinger Band Color: This feature uses green for bullish and red for bearish trends, offering a clear visual distinction. Candle Colo
Unleash the power of precision and innovation in your trading with the KT BreakGrid Pro EA. Seamlessly blending the strategic prowess of breakout and grid trading, this expert advisor is your ultimate solution to navigating the complex Forex landscape with unmatched confidence and efficiency.
Recommendations
Symbol: EURUSD TimeFrame: M5 Account Type: Hedge Leverage: 1:500 Set Files: Not required. Default inputs provides best results.
Features Breakout-Infused Grid Strategy: Experience th

Tradibox Gold is built upon a foundation that combines Bonnitta's unique trading indicator with an advanced proprietary trading algorithm. The Tradibox Gold strategy incorporates a confidential specialized indicator, trend lines, as well as support and resistance levels, all supported by the aforementioned secret trading algorithm.
To make the most of Tradibox Gold, it's crucial to utilize leverage exceeding 100. In my personal experience, I started with an initial investment of 100 USD and a

Good community, this time I bring you the bot called Crash 500 Live where it has a passive return, It has a Stochastic indicator accompanied by the help of two moving emas, to perfect the entry in trend candles! where it reaches a certain point of level to open its operation, The bot is very simple and effective, since in annual backtesting it manages to exceed 100% of the account with an initial capital of 500 usd balance! where monthly mind has good returns! the bot is used in M1 (1 Minute) L

Good community, this time I bring the Boom 500 Live bot where it works with a stochastic strategy accompanying 2 emas of 7 and 50 periods. stochastic levels are left as is, since with the help of emas he perfects the entry of trend candles! works in a period of (5 minute) and the parameters only have to be modified.. Lotage at 1 or 0.50 to start. Stoploss at 50000 and the takeprofit at 500 (since it works in trend candles and absorbs passive entries to avoid spikes) then everything is left as th

Note: minimum investment 1000 usd or (100 usd is Account Cent (10000 Cent)) Run At 0.01 lot start. Trading with an Expert Advisor (EA) on the M1 timeframe (1-minute chart) can be quite challenging due to the rapid price movements and increased noise in such short timeframes. However, it's not impossible, and some traders do use EAs on the M1 chart for specific strategies. Here are some considerations for trading with an EA on the M1 timeframe: 1. Strategy Selection: Choose a trading strategy

The Stochastic Momentum Index (SMI), developed by William Blau and featured in the January 1993 edition of Technical Analysis of Stocks & Commodities magazine, introduces a unique perspective to trading analysis. Distinguished from the conventional Stochastic Oscillator, which evaluates the current close in relation to the recent x-period high/low range, the SMI assesses the close's position relative to the midpoint of this range. This innovation yields an oscillator with a range of +/- 100, re
FREE

The KT 4 Time Frame Trend is an invaluable forex indicator for traders seeking to identify the trend direction across 4-time frames accurately. This innovative indicator allows users to simultaneously observe and analyze price trends across four different timeframes. Whether you're a beginner or an experienced trader, this tool offers an enhanced understanding of trend dynamics, leading to improved trading strategies on your trading platform. The capability to concurrently monitor multiple timef
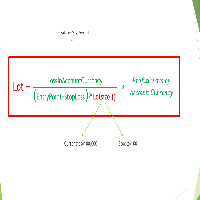
Important Note: Before using it in a real account test it in your demo account.
//+------------------------------------------------------------------+ //| Optimum_Lot_Size.mq5 | //| Copyright 2023, MetaQuotes Ltd. | //| https://www.mql5.com | //+------------------------------------------------------------------+ #property copyright "Copyright 2023, MetaQuotes Ltd." #propert
FREE
KT Momentum Histogram provides traders with a visualization of the momentum of a particular asset, which helps determine the strength and potential direction of a market trend. The indicator calculates and operates based on momentum in trading.
What Exactly is a Momentum Histogram
Momentum is the rate of acceleration of an asset's price or volume. In other words, it measures the speed at which the price of an asset is moving in a particular direction over a specific period of time. Positive
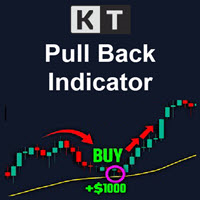
The KT Pull Back Arrows shows the pull back arrows using the RSI (Relative Strength Index) to identify suitable pull-back entry areas within the overbought and oversold zones. The indicator effectively pinpoints favorable moments for initiating pull-back trades by leveraging these RSI thresholds. Trend trading is often considered the most profitable strategy in the Forex market. It is the equivalent of riding the wave, going with the flow, and capitalizing on market momentum. However, timing is
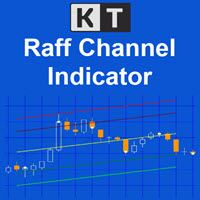
The KT Raff Channel is an enhanced and refined iteration of the original Raff channel concept pioneered by Gilbert Raff in 1996. This indicator builds upon Raff's initial work, incorporating modifications and advancements to provide traders with a more sophisticated and powerful tool. Gilbert Raff, a renowned name in the field of financial market analysis, is the developer of the Raff Regression Channel. This technical tool is designed for discerning and validating possible market price trends.

This is the Full Version, to get the free version please contact me.
The free version works on “AUDNZD” and “XAUUSD” charts.
All symbols and time frames scanner
Head and Shoulder
One of the most popular Price Action patterns is the Head and Shoulders pattern. The pattern has three local tops that resemble the left shoulder, head, and right shoulder. The head and shoulders chart pattern appears in all kinds of markets, including Forex, cryptocurrency, commodities, stocks, and bonds. The

The KT Knoxville Divergence is a powerful tool that reveals unique price divergences in a financial instrument by employing a carefully crafted combination of the Relative Strength Index (RSI) and a momentum oscillator. This indicator effectively captures subtle variations in market dynamics and assists traders in identifying potentially profitable trading opportunities with greater precision. Knoxville Divergences is a type of divergence in trading developed by Rob Booker. Divergence in tradin
To access the MT4 version of this EA you can contact via private message. Also you can contact for further modifications. strategy description: - Detect underlying trend using the BxTrender indicator in daily time frame. - Trigger entry using supertrend indicator in M15 time frame. - Also use supertrend indicator to set SL and TP accordingly. EA setup - Nasdaq and other indices(like DAX40) are suggested to be traded. - Risk per trade is hard coded to 0.5%. - Risk:Reward ratio is hard coded to 1:
FREE

The Rp4000 Expert Advisor employs a highly effective strategy by utilizing the Keltner Channels Indicator to identify optimal trade entries. Keltner Channels consist of three lines - an exponential moving average (EMA) in the center, and upper and lower channels based on the average true range (ATR). When the market price breaches the upper channel, it generates a buy signal, and when it crosses below the lower channel, a sell signal is generated. This strategy is effective because it combines t
FREE

Hello Traders..
Tried deals without stop-lose? :)
=-=-=-=-=--- Grid EA Robot { Simple Moving Average } crossover 4sma & 11sma Strategy ---=-=-=-=-=
BY below pics you will know what strategy doing by automatic open and close Trades.
[ BUY ]
4.sma crossover 11.sma
https://ibb.co/0XZFBf2
[ SELL ]
11.sma crossunder 4.sma
https://ibb.co/VpqsLmD
[ backtest ] - XAUUSD - settings below. Note: don't change these settings for ( xauusd pair ) -TF 1 hour
https:/

Introducing our innovative Fractal Trend Indicator – a powerful tool designed to help you navigate the financial markets with ease. This user-friendly indicator utilizes fractals to provide valuable insights into market trends while allowing you to customize your visual cues for trend identification. Fractal Clarity: Our indicator employs dots to highlight fractal points, clarifying their significance in the market. These dots do not signify the trend themselves but serve as crucial reference p

該指標用於找出支撐與壓力線 可在同一圖標週期中找到不同時間週期的支撐與壓力,這裡提供兩種時間週期 參數說明: ----------------------Main --------------------- Timeframe //用於選擇主要時間週期(建議為默認PERIOD_D1); Retracement interval //該數值為回溯k線根數(建議為默認20); The color of the Main //依照個人選擇主要水平線顏色; The style of the Main // 依照個人選擇主要水平線樣式; The width of the Main // 依照個人選擇主要水平線寬度; --------------------Sub-cycle------------------- (說明與主時間線相同)

The indicator determines signals on a system of two components:
- correct fractals. The indicator that comes with MT4 and MT5 is quite crude, since some levels are calculated incorrectly. This indicator shows signals for the breakdown of strong levels. - wave level for fractals. Not to be confused with zigzag.
It is better to use on higher timeframes (M15 and higher), where the indicator perfectly shows entry points and reversal situations.
Of course, you can use standard indicators from
The sole purpose of this utility is to improve the Reading and Monitoring of the Common Details on the Current Chart. Users are able to select their preferred output settings, from the user defined inputs tab. Users are able to adjust the below input fields: Format Settings:
Text Colour Background Colour Background Enabled X-Position Y-Position Currency Symbol Time Inputs Server Time Local Time Server Date Local Date Chart Inputs
Chart Symbol Chart Timeframe Account Inputs
Margin Free Margin
FREE

Introducing our advanced indicator, which builds upon the foundation of the renowned William's Alligator indicator—a powerful tool in technical analysis. Our enhanced indicator offers valuable insights into market trends through three distinct methods, empowering traders with comprehensive market analysis. Alligator Indicator Expansion: This innovative indicator harnesses the essence of the Williams Alligator by closely monitoring its three crucial components: the lips, teeth, and jaws. When the

Elevate Your Forex Trading with the "Gold Death Cross" Indicator! Are you ready to take your Forex trading game to the next level and harness the power of time-tested technical analysis techniques? Look no further! The "Gold Death Cross" indicator is here to revolutionize your trading experience and maximize your profit potential. Unlock the Wisdom of Multiple Moving Averages: The "Gold Death Cross" indicator doesn't just stop at one moving average; it brings you the combined insight of four mo

Daily Trading Statistics is expert advisor that count: -Today entries: sum of all in entries of the day; -Today winning deals profit: sum of the profits of all winning entries of the day; -Today lossing deals profit: sum of the profits of all losing entries of the day; -Today deals profit: balance of profits between the winning entries and the losing entries of the day.
FREE

Infinity Indicator MT5 1.0 Panel Asset Rate % EURUSD 96.0% GBPUSD 94.1% AUDCAD 90.5% USDCHF 87.8% BTCUSD 78.4% Panel Win Rate based on CandleMT4 Exit Button Calculates the StdDev standard deviation indicator on the RSI data, stored in the matrix similar to the keltner. input int HourCalculate = 12; RsiLength = 5; RsiPrice = PRICE_CLOSE; HalfLength = 4; DevPeriod = 100; Deviations = 0.9; UseAlert = true; DrawArrows = true; TimerWork=300; LevelUp = 80; LevelDown = 20; MoreS

Maverick AI EA is a fully automated trading advisor designed exclusively for trading gold, in particular the XAUUSD pair. This EA has demonstrated stable performance from 2010 to 2020, showing high efficiency. It is distinguished by its commitment to safe and responsible risk management, eliminating risky methods such as martingale, grid trading or scalping. In addition, its adaptability to different broker conditions makes it a versatile tool for traders. The Maverick AI advisor is powered by a

//// Forex Bulls GBP CAD MT5 ////
An expert based on ( GBP , CAD )
Time frame = 15
Live Signal 1 = Live Signal 2 = it is a fully automated “pullback” trading system, which is especially effective in trading on popular “pullback” currency pair : GBPCAD The system uses the main pat
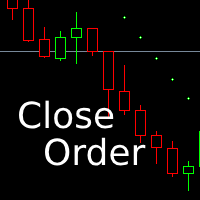
This EA will automatically close all open order when profit or loss is reached according to users setting. You need to select close by percentage or close by amount. If close by percentage or close by amount is set to true the EA will exit. When the setting is set to true, the value of profit and loss can not be 0. Please set to true the option for Close Order with Same Symbol or Close All Order.
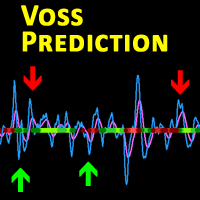
Description This is a modified version of the popular Voss Predictive Filter - A peek into the future by Dr. John Ehlers. It contains 2 lines - V-Line (blue) and F-Line (red), a trend indication and BUY/SELL signals.
Usage Buy Green dots indicate an up trend. Open a BUY position if the V-Line crosses the F-Line from below and an up trend is signaled (green dots) Close BUY position if V-Lines falls beneath F-Line again Sell Red dots indicate a down trend Open a sell position if V-Line falls
This indicator is a unique, high quality and affordable trading tool because we have incorporated a number of proprietary features and a new formula. With this update, you will be able to show double timeframe zones. You will not only be able to show a higher TF but to show both, the chart TF, PLUS the higher TF: SHOWING NESTED ZONES. All Supply Demand traders beautifully integrated with Moving Average Clouds. I am sure you will love it. Tips User Manual Use my template Optimize Zone Strength f

The KT Buy Sell Volume is a powerful tool traders use to gauge the strength and weakness of price movements. In the whirlwind of the Forex market, traders aim to identify and ride the waves of a bullish or bearish trend that exudes strength and potential. However, recognizing these trends necessitates a method, metric, or indicator to quantify their strength. One crucial factor that traders examine for this purpose is volume. Volume refers to the number of shares or contracts traded in a securit

Basic Gold Predictor is a sophisticated Expert Advisor meticulously crafted for traders and investors with a keen interest in the precious metal, gold. This advanced algorithm combines the power of multi-timeframe analysis and fundamental technical analysis to provide accurate and timely predictions for gold price movements.
Key Features: Multi-Timeframe Analysis: Basic Gold Predictor leverages multiple timeframes, from short-term intraday charts to longer-term daily charts. By considering var

Introducing our dynamic Swing Tunnel indicator, a powerful and straightforward tool designed to simplify market analysis while providing invaluable insights for traders. This versatile indicator relies on the interplay of two moving averages, forming a visual "tunnel" that changes color, offering clear signals for bullish and bearish market conditions. Let's delve into its features: Swing Tunnel Color Change: The heart of this indicator lies in the Swing Tunnel—a visual representation of marke
The KT Risk Management Indicator provides a comprehensive overview of the profit/loss and risk management characteristics of your Metatrader account, offering valuable insights and information. It efficiently categorizes the displayed information at account and symbol levels, ensuring a clear and organized presentation of crucial data. Risk is inherent when trading the Forex market - a reality that seasoned traders acknowledge and beginners quickly realize. To succeed in this volatile market, t

- This is the exact conversion from TradingView: "Support/Resistance" By "BarsStallone". - This indicator lets you read the buffers for R/S values. - This is a non-repaint and light processing load indicator. - This is not a multi time frame indicator If you want the multi time frame version you should create a personal order and I deliver two files that you need them both to have the multi time frame indicator running on your system. - The MT4 version of the indicator is not light load from pr

The KT Trades Info indicator is useful for traders wishing to stay informed about their trading performance. This indicator provides real-time updates on the profitability of all ongoing and completed trades, enabling traders to make well-informed decisions. By incorporating key financial metrics, it provides a comprehensive picture of a trader's financial status at a glance. This means traders can monitor their performance with increased accuracy and precision, facilitating better risk manageme

Hello My Dear Friend,
im introduce about Binary Option Premium V8
it work, all currency pair
1 minute time frame,
1-5 minute expire
100% non repaint,
no delay signal
Alright. This indicator works on MT5 and is very easy to use. When you receive a signal from it, you wait for that candle with the signal to close and you enter your trade at the beginning of the next new candle. A red arrow means sell and a green arrow means buy. for easy identification of trade signal. Are you okay with tha

The Xnq100 is a trading robot designed to trade exclusively on the NQ100 CFD. It is based on the price channel indicator and other customised indicators, and also takes account of market volatility. This robot has been used live for more than 6 months and has obtained great results. As regards the parameters to be defined before starting up: - TRAILING_STOP must be equal to 0.5 - X ( it represents the multiplication of the size of the positions you want to take according to your portfolio ) Pe
MetaTrader市场是一个简单方便的网站,在这里开发者可以出售自己的交易应用程序。
我们将帮助您发布您的产品,并向您解释如何为市场准备您的产品描述。市场上所有的应用程序都是加密保护并且只能在买家的电脑上运行。非法拷贝是不可能的。
您错过了交易机会:
- 免费交易应用程序
- 8,000+信号可供复制
- 探索金融市场的经济新闻
注册
登录