适用于MetaTrader 5的新EA交易和指标 - 109

This indicator, It can be applied to any financial assets: forex, cryptocurrencies, metals, stocks, indices . And This indicator base on Golden cross with custom length signal
Settings
FastSignalLength : Length of Fast Signal SlowSignalLength : Length of Slow Signal TimeFrame : Choose time frame to calculate ShowDeadCrossOnly : Show Dead Cross Channel Only ShowSignalMedianOnly : Show signal median line only when ShowDeadCrossOnly set to false alertOn : Send alert alertsOnCurrent : Alert

The best forex robot for all type of Artificial expert advisor for all conditions and strategies.The robot is particularly good in breakouts and reversals.The expert advisor data is prepared from the super refined dataset from a wide range of indicators and strategy to make the most successful expert advisor on the market.This expert advisor has out performed any existing robot buy being able to deliver a 400% in three month and still using proper money management.This robot is good at holding

Assistente para gerenciamento de ordens. Recursos: -> Definição de TP e SL -> Trailing Stop -> Breakeven -> Realização Parcial, manual ou automática -> Operação através de atalhos do teclado -> 3 setups possíveis, com acionamento através de atalho do teclado, permitindo níveis diferentes de TP, SL e Trailing Stop -> Definição automática ou manual do Lote -> Gerenciamento de Risco personalizável -> Contador regressivo para final do candle -> Informações sobre Resultado (em pontos), tanto no candl

我们向您介绍iVISTscalp5指标,它不仅独特,而且在交易操作中也非常有效。该指标基于时间数据,是多年金融市场经验和深入分析的结果。iVISTscalp5指标是手动交易的优秀工具。便利性、简单性和可视化 - 所有的复杂性都隐藏在内部。我们将iVISTscalp5指标的设置和使用简化到了最大程度。该指标适用于MT5终端中您所拥有的所有金融工具。 操作时间为UTC+3的早上4点到晚上8点。 iVISTscalp5指标菜单(见截图1): History - 计算行情的周数 dT_min - 选择时间间隔的时间(分钟) TFline - 绘制水平成交量(时间帧) BARSline - 绘制水平成交量(条数) TFtrend1 - 绘制日线通道(时间帧) BARStrend1 - 绘制日线通道(条数) TFtrend2 - 绘制周线通道(时间帧) BARStrend2 - 绘制周线通道(条数) ALERT_TIMER - 设置闹钟 ALERT - 开启/关闭闹钟 Save - 开启/关闭将时间记录到文本文件。 图表上的红色和蓝色旗帜表示时间(VIST智能剃须系统的信号)。卖出信号为红旗,买入

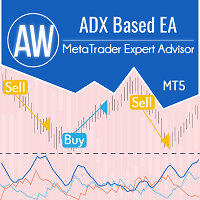
智能交易系统根据 ADX 指标的信号进行交易。当趋势活跃时,使用由指标主线确定的 PlusDi 和 MinusDi 相对值确定趋势的经典策略。交易是按照当前趋势的方向进行的。 问题解决 -> 这里 / MT4版本-> 这里 / 说明 -> 这里 优点: 可配置的指示器信号 适用于任何类型的工具和任何时间范围 必要时使用平均 将第一个订单与最后一个订单重叠的可插拔系统 虚拟止盈 具有三种类型的通知 能够自动计算交易量 战略: 智能交易系统根据指标信号 ADX 工作。 要开仓,使用三个指标线:主线、减号和加号。 主线显示趋势的强度,即价格移动的活动。 另外两条线表示当前的趋势是什么。 如果加线高于减线,则表示当前处于上升趋势。 如果负线较高,则表明下降趋势。 当两条线之间没有明显差异时,市场目前处于持平状态,即没有明显的趋势。 信号: 当主线的数值高于最小值,并且向上生长时,这意味着市场当前的趋势正在加强。 买入信号 - 当主线高于最小值,同时它在增长,并且正线高于负线。 卖出信号是当主线大于最小值并增长时。在这种情况下,减号线位于

This indicator looks for SIGNS of Buy and Sell
14 SIGNS: Crossover of 2 moving averages; Crossover of 3 moving averages; RSI Indicator; Stochastic Indicator; Crossing line 0 MACD;
Divergence of the RSI indicator; Divergence of the MACD indicator;
Divergence of the OBV indicator;
Divergence of the STOCHASTIC indicator; Three white soldiers candle pattern; Three black crows candle pattern; Hanging man candle pattern; Hammer candle pattern; Rupture Bands Bollinger.
The indicator plot

用於確定平面和趨勢的指標。 如果價格低於兩條直方圖和兩條線(紅色和藍色)中的任何一條,則這是一個賣出區域。 購買此版本的指標時,一個真實賬戶和一個模擬賬戶的 MT4 版本 - 作為禮物(收到,給我寫私信)! 如果價格高於兩條直方圖和兩條線(紅色和藍色)中的任何一條,則這是一個買入區域。 MT4 版本: https://www.mql5.com/en/market/product/3793
如果價格在兩條線之間或在任何直方圖的區域內,那麼市場就沒有明確的趨勢。簡單地說,市場是平的。
指標的工作在屏幕截圖中更清楚地顯示。 該指標可用作獨立的交易系統。該指標可用於獲取領先數據或確定當前趨勢的方向。對於任何級別的交易者來說,這都是一個很好的工具!

Big Boy v3.0 是一款新的 EA,旨在在 EURUSD 15 分钟时间范围内准确交易。 请在 EURUSD 15 分钟图表上使用它。 年复一年,它非常准确。 下载后,将基本余额更改为 50 并附加到 EURUSD 15 分钟图表。
感谢您考虑购买和使用此 EA。
以下是输入:
1) 专家评论(可以更改):每笔交易使用的基本评论
2) Expert Magic:Big Boy 所开交易的唯一标识符
3) 自动手数:如果为 true,EA 将根据可用余额自动计算手数。
4) 固定手数(当 AutoLots==false 时):当上述 AutoLots 为 false 时 BigBoy 用来开仓交易的手数。
5) 最大手数(0==自动):该经纪商针对该特定工具(货币对)可能的最大手数。
6)Tubo Lots(不超过MaximumLots):当账户余额变得非常大时使用,以细分手数并实现更好的填充
7) 最大未平仓头寸:当批次被细分时,我们不会超过未平仓头寸的数量
8) 基本余额(以账户货币计,最好80及以上):至少50。这是经纪商允许该货币

The Lots Risk Sizer indicator will help you quickly determine the volume of a position in lots
The indicator has a collapsible panel at the touch of a button. When installed on a chart, it is located in the lower right corner in the form of a triangular button. Indicator parameters:
Risk - the amount of risk in the account currency (usd, eur, etc....). Enter only a whole number
Lots - risk in lots
Show description (On/Off) - show a text description of the displayed values
Display state

Multi instrument and multi time frame EA, with the best indicators. The MSD EA can be used for automated and manual trading. Click on the '?' button on the dashboard to obtain information about the various elements of the MSD EA. Uses ATR Take Profits, ATR Stop Losses and ATR Trailing Stops. Comes with an FX Currency Strength meter and a Market Sessions indicator. Has the option to place Trade Lines (Buy, Sell, Close, Alarm). When the price reaches the trendline, the EA will perform the approp

ATR dynamic level The indicator calculates the price range within which the asset price moved for the specified period of time, and also builds the boundaries of the calculated range for the current week and for today. The levels are calculated from the beginning of the opening of the week (weekly) and from the beginning of the opening of the day (daily).
Features:
1) Support and resistance levels are always relevant, since these levels change along with the price movement. If the price has

Non-lagging VOLATILITY indicator A radical modification of the ATR indicator, which corrected all of its shortcomings (the picture shows the difference with ATR). The indicator shows the swing size of the current market movement. Features: does not have a time window period, i.e. any subjective settings non-delayed, the extremums of the indicator always coincide with the extremum of the price (note the picture) is normalized by means of a color solution, i.e. it has the properties of an oscillat
Script that generates a report of possible ATM Straddle operations. It works for any asset on the spot market that has authorized stock options series on the B3 (Brazilian stock exchange).
Straddle operations presented in the report: Short Straddle operations Uncovered Short Straddle Covered Call Short Straddle Diagonal Covered Call Short Straddle (expiration of the covered call after the expiration of the short options) Iron Butterfly Iron Butterfly "Pozinho" Diagonal Iron Butterfly (diagona
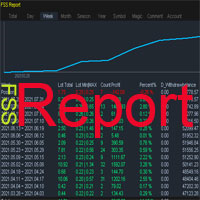
FSS_Report This is a professional report statistical indicator, which can be counted by day, week, month, quarter, year, magic and comment, and display the growth curve.
How to install: select "File" in your MT5 client 'menu,and open the folder "MQL5\Indicators",then copy file "FSS_Report.ex5",reload MT5 and enjoy. last update at 2023-05-18
v1.3 update info
1.fix bug about magic filter
2.fix bug about Comment filter
3.add path line
4.add func about addon work
Para List: UI_XY_Setti
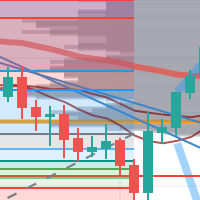
每次一忙都會錯過訊號下單,或不想一直花時間盯盤下單,可以用這個工具掛單,讓MT5 自動 盯盤並在滿足條件後下單 。
demo : https://www.youtube.com/watch?v=JBPiFkixqT4 configuration: https://www.youtube.com/watch?v=D7xESKKD26o #############################################
使用場景:
一般交易可以分為2種,分別是: 左側交易: 價格到達關鍵位置時就下單交易,想要自動下單,可以使用buy limit和sell limit掛單 右側交易: 價格到達關鍵位置, 同時出現做多或做空訊號 時下單交易, 想要自動下單, 就 可以用本工具自動掛單 本工具會 在你指定的阻力區域偵測到做空訊號時,建空單 ; 並在你指定的支撐區域偵測到做多訊號時,建多單。 demo影片: https://www.youtube.com/watch?v=JBPiFkixqT4
####################################
FREE

Cross Entrance technical indicator crossing points can be used as potential market reversal points. Thus, all intersection points will be optimal points at which the movement changes taking into account the indicator period.
The advantage of this indicator is that it eliminates false signals during a sawtooth price movement and helps to maintain a position during a strong trend. When the trend changes, the Cross Entrance indicator uses line crossing indication. You can use the Cross Entrance
Script that generates a report of possible Calendar options structures .
It works for any asset on the spot market that has authorized series of options on the B3 (Brazilian stock exchange).
The report presents the alternatives for assembling calendars structures, for a defined range of strikes, with the long option expiring in a certain number of months.
The main structures of the report are:
Calendar Calendar Line Covered Calendar Line In addition, the report presents alternatives to

Простой советник основанный на сигналах индикатора Relative Strength Index (RSI) в зоне перекупленности - продаем, в перепроданности - покупаем. Моя версия всем известного "Dynamic". Я рекомендую использовать этот советник в полуавтомате.
Добавляйтесь в друзья, присылайте свои интересные стратегии. Возможно после обсуждения всех нюансов напишу советника бесплатно . Параметры: "_Slippage" - Проскальзывание; "_
FREE

Boom and Crash UPGRADE
BOOM AND CRASH upgrade is a 100% adaptive expert advisor based on price movement. It has a built-in unique Smart Recovery algorithm. Only one trade at a time. Every trade has Stop Loss and Take Profit from very beginning, and they do not change. This is for those, who are looking for stable growth over the long run. SETTINGS SL-1000 TP-10000 TSTOP-7 TSTEP-5 MONEY MANAGEMENT-CONSTANT LOT VALUE FOR "MONEY MANAGEMENT"- 0.2 USE TIME CONTROL-FALSE START HOUR-Current START M

"Five Minute Drive" indicator that is designed to be used in the 5 minute timeframe only. One of its most important advantages is that it shows the general trend in the upper time frames when looking at the 5-minute timeframe. Therefore, when opening positions in the 5 minute timeframe, when it is in line with the trends in the upper timeframes, you are less likely to be upside down. If you can interpret the curvilinear and linear lines drawn by this indicator on the graphic screen with your geo
FREE

Advanced 4xZeovo MT5 Indicator (MetaTrader 5) Product Description 4xZeovo is a powerful trading indicator system monitoring 24/7 financial markets. Metatrader5 tool designed to find the best buying/selling opportunities and notifies the user. Making life easy for traders in helping with the two most difficult decisions with the use of advanced innovate trading indicators aiming to encourage users to hold the winning positions and take profit at the best times. Equipped with a unique tra

Dashboard, TP line and Profit/Loss labels are set to false by default for speeding up the optimization. Switch them to True before you start. There are many strategies inside this EA as follows: - Entry based on indicator signal "as shown on the trend indicator " - Opposite to trade entry with opposite martingale - Entries based on " support and resistance indicator ". - Normal martingale - Normal martingale with distance multiplier - Normal martingale with volatility index - Opposite martingal
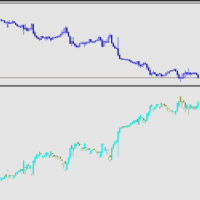
反转K线指标! 指标将主图的K线在副图中进行反转显示. 交易实用必备工具指标 波浪自动计算指标,通道趋势交易 完美的趋势-波浪自动计算通道计算 , MT4版本 完美的趋势-波浪自动计算通道计算 , MT5版本 本地跟单复制交易 Easy And Fast Copy , MT4版本 Easy And Fast Copy , MT5版本 本地跟单复制交易 模拟试用 Easy And Fast Copy , MT4 模拟账号运行 Easy And Fast Copy , MT5 模拟账号运行 The indicator of the attached figure shows that it is a mirror image of the candlestick chart of the main chart. The ordinate of the figure indicator is mirrored with the main image, and the coordinate value is a negative number.
For graphic reference o

任何交易者的最佳伙伴! 该EA加载后: 1.可以对无止损止盈的订单自动设置止盈和止损. 2.可以对盈利订单在盈利一定设置幅度后保护盈利 3.可以移动止盈止损
特性 1.可以对无止损止盈的订单自动设置止盈和止损.
2.可以对盈利订单在盈利一定设置幅度后保护盈利
3.可以移动止盈止损 自动止盈止损设置 自动设置止损止盈的开关
固定止损的点数设置 固定止盈的点数设置 自动使用波幅自动计算的TP设置 波幅自动计算的TP的风险系数设置 超过一定开仓时间的订单不再设置止盈止损. 止损保护设置 止损保护开关
止损保护启动点数设置 盈利保护点数设置
止损移动设置 移动止损开关
移动止损启动点数设置 移动止损回撤点数设置
有任何问题,欢迎交流...

Boris- Полностью автоматический ,агрессивный советник основанный на математических расчетах, написанный специально под валютную пару EUR/USD. Период H1.
Советник использует свой автоматический виртуальный стоплосс и тейкпрофит ! Ваш брокер не будет видеть ,задерживать модификацию,забыть поставить стоп и так далее. Тестировать рекомендую только с качеством 100% тиков у брокеров дающих реальные котировки. Входные параметры:
Magic=77777; - Магик ордеров
StartHour=1; - Час начала Торговли

Trend Dynamics Expert Advisor is a level trader designed to be as precise as possible.
Because of the extreme accuracy of the entries and the algorithms ability to filter out bad trades, the system does not take new trades every day.
The system was not optimized and has fixed indicator settings as its universally adaptable.
Be aware, that its recomended to run multiple pairs on the same account for more profit. Our Goal is to help you be way more profitable and way more stress free, so yo

Currency Pair Splitter, calculates the value of an individual country and display it's fluctuations and trend over a given period. It has three lines which gives a mean price for a given period of time. This product is accurate in determining the actual direction of a country economic growth and strength as a result of economic events happening in a country. It shows an optimum price where a currency can deviate. Example For a pair EURUSD . this indicator Calculates the Value of the Numerator E

This indicator plots the volume profile by Price on the chart
There are 5 ways to view it:
By Total Volume Traded; Volume Ticks(Forex) Separated by Buyers and Sellers; Buyers Only; Sellers Only and; Business balance (Buyers - Sellers).
It is possible to select how many days the profiles will be calculated.
On the current day it recalculates the histogram data for each new candlestick.
Another feature is to select the highest trading range by entering the desired percentage.
Th
FREE

交易者的最佳伙伴 !
助手详细说明文档,点击阅读 基本使用设置 基本: 支持语言的选择切换(目前支持中文和英文) 自动识别语言 支持 热键开平仓 绑定, 使用快捷键进行快速开平仓...... 快捷键平仓. 解锁支持大部分功能 复盘 操作,可以在 测试环境下使用 开仓平仓区域: 一键开仓( 包含止盈止损的便捷设置,手数自动计算等便捷功能) 一键平仓 (锁仓),极简的风格设计,可以自由选择平仓品种,平仓类型(多单,空单,或者挂单),是否平仓盈利大于0的订单,是否平仓亏损订单,平仓比例的设置(0~100%),且是否平仓反向,以及锁仓功能,均在选项中可以直接实现操作. 多键平仓 划线开单控件 计算出多单或者空单的 平均持仓价格 并划线 止盈止损等自动 设置 多品种,多,空,分类平仓 .. 挂单区: 批量间隔挂单 功能。
批量挂单删除 功能 设置区: 开平仓消息框提示再确认开关 语言切换 热键设置 点数校正 自动化功能区: 划线交易 自动止盈止损 账户保盈 保护止损 移动止损 账户风控 影子订单功能 万向加仓功能 ①逆势加仓多单 ②逆势

對稱三角形圖表模式代表價格被迫向上突破或崩盤之前的一段收縮和盤整期。向下趨勢線的突破標誌著新的看跌趨勢的開始,而從上部趨勢線的突破則表明新的看漲趨勢的開始。
此處提供 MT4 版本: https://www.mql5.com/en/market/product/68709/
該指標識別這些模式並在 4 個關鍵點形成且價格再次回落至三角形時提醒您,以便您為潛在的突破做好準備。對稱三角形並不總是完全對稱的,價格可以向上或向下突破,但通常最成功的突破是在形成三角形第一個點的高點或低點的方向上。因此,該指標為我們提供了對突破的看漲或看跌偏見,並採用顏色編碼並針對該特定方向發出警報。沒有必要只在一個方向進行交易,但是因為任何一個方向的突破都是可能的,但是當突破與第一個點趨勢一致時,您往往會獲得更大更快的價格變動和更好的風險回報。
輸入和配置選項:
開始搜索蠟燭 - 指標將開始尋找多少根蠟燭來尋找已完成的形態 Fib Max Retracement - 最大回撤價格可以形成點 3,4 和 5 Fib 最小回撤 - 可以形成點 3,4 和 5 的最低迴撤價格 僅顯示最後信號 - 僅

Expert Advisors 的策略来自 Facebook Group EA Nation。该小组拥有超过 4 万名成员。它为每根新蜡烛打开对冲交易,并在头寸处于交易的亏损方时打开网格。
平均网格 = N
= 当前柱之前 6 个柱的总和/N
时间范围 = 当新柱出现时开启新的对冲交易
Auto Lot = 1 Lot 意味着 10,000 美元的手数为 0.01
NO MORE HEDGE = 当一方达到 N 笔交易时,它不会开启对冲交易直到 TP
CLOSING STRATEGY = TP 1 是交易对方的网格大小
= TP 2-6 = 百分比
参数:
- 平均网格
- AG 时间表
扩散过滤器
- 最大点差
- 大体时间
金钱管理
- 自动批次
- 最大批量
- 乘数
- 不再对冲
收尾策略
- TP 2(2-5 次交易)
-

This indicator shows the TLH and TLL and some trendlines that allow us to estimate the trend of market. It also shows the values of the angles of the lines in percentage in points (pip) , the standard deviation, and the trend of each line, and when it breaks the lines of support and resistance (TLH and TLL). And finally, it also shows the points identified as supports and resistances through the fractal algorithm in the graph. The high and low trend lines are supported by the highs and lows, th
FREE

The first currency based indicator to draw a distinction between map and strength. The map shows the currencies in terms of oversold/overbought levels and gives the direction of travel. The currency strength calculates and shows the strength of that move. Alerts are included for changes in currency direction on the map (confirmed over two bars) and also when the strength reached the appropriate level. The currency map is useful for finding currency pairs to trade and in which direction. Look fo

The SM_GOLEM EA Expert Advisor is designed to work on accounts with an initial deposit of 100 units or more. On cents, it is desirable to use at least 3000 units. The algorithm of the Expert Advisor works as follows: entering a trade at the beginning of the bar with a growing signal of the ROC oscillator, exiting the market at the end of the bar when the CCI (Commodity Channel Index) is below the level line. The Expert Advisor was optimized on an hourly timeframe, since it was supposed to be us

This EA identifies trading candles that often foreshadow a market reversal and finds volume accumulation levels in the trading history. It opens trades if a candlestick like "Doji" or "Engulfing" appears at the volume level and the price seems to be repelled from the level. To make its strategy clearer to users, it can display volume levels and signal candles (thanks to its good display, it can be used as an indicator). In the strategy tester, some display functions do not work correctly, so wat

For those who love to trade using the Heikin Ashi Candlesticks, here it is one more powerful ally: Heikin Ashi Volume . This indicator is an exclusive idea and creation from us at Minions Labs for you. The idea behind this indicator is to have a visual cue over the Heiken Ashi candles pointing at those candles with big volume. For this to happen you can choose between 2 different techniques of identifying the "high" volume: Higher Volume above the last N previous bars average. Higher Volume segm

Open Multiple Trades on MT5 in 1 click at one price.
Enter the Symbol you want to trade Enter the Lot size Specify the number of trades you want to open Choose from a dropdown list whether you want to buy, sell, sell limit, sell stop, buy limit, buy stop If they are pending orders, state the number of pips away from the current price that you want to set the trades. Once you are done, click Ok and see the script open your trades in an instant What to Always Note Check the minimum stop levels
The script statistically reveals the main rate of movement (Gan angle) for the selected instrument. Using mathematical methods, it determines the speed of following the candles of the current timeframe against the background of the older one. Just place AutoGan on the graph and it will perform the required calculations and correctly draw the Gan grid.
The script is very easy to use, only the colors of the grid lines are set in the parameters.
Parameters:
GRID_COLORING : How many colors to

The EA uses cross-trading for several currency pairs at the same time, taking into account the total profit. Trade is seen in groups, in each group there can be 2 - 8 currency pairs at the same time. Trading signals come from 6 timeframes: М1, М5, М15, М30, Н1, Н4. The EA uses the following indicators: MACD, Standard Deviation, Commodity Channel Index. The EA uses a hidden one: stop loss, take profit, breakeven, trailing and the minimization of stop loss towards profit. The EA does not requir
移動平均線クロス、ボリンジャーと移動平均線のクロス、移動平均線の角度でサイン表示
MT5インジケータ こちらに サイト があります。 このインジケータは3つのパターンでサインを表示(切り替え可能)します。 ① 移動平均線のクロス ② ボリンジャーバンドと短期移動平均線とのクロス ③ ボリンジャーバンドと短期移動平均線とのクロスと、中期移動平均線と長期移動平均線の角度 ⓸ ボリンジャーバンドと短期移動平均線とのクロス(サインを交互に表示) 移動平均線のクロス 指定した短期移動平均線と長期移動平均線のゴールデンクロスでは買いサイン、デットクロスでは売りサインを表示します。 ディフォルトでは短期は5,長期は20となっています。 もちろん変更可能になります。 移動平均線の種類をEMA(指数平滑移動平均線)やSMMA(平滑化移動平均)などに変更可能で適する価格も変更可能になります。 ボリンジャーバンドと短期移動平均線のクロス ボリンジャーバンド(以降BB)と短期移動平均線のクロスでサインを表示します。 ディフォルトではBB+1σと5MAのゴールデンクロスで買いサイン、BB-1σと5MAのデ
An indicator of patterns #32 and #33 ("Measured Move Up/Down") from Encyclopedia of Chart Patterns by Thomas N. Bulkowski. Parameters: Alerts - show alert when an arrow appears Push - send a push notification when an arrow appears (requires configuration in the terminal) PeriodBars - indicator period MinMovment - minimum movement value (in points) BackMovment - maximum value of return movement (as decimals) ArrowType - a symbol from 1 to 17 ArrowVShift - vertical shift of arrows in points Sh

order flow indicator that monitors price formation effectively identifying market direction. As it is an extremely fast indicator, it should be used in support and resistance, static and dynamic regions, the OrderFlowWay will predictively indicate the veracity of breakouts that have not happened yet, showing whether there is action by big players in the traded price. Operations must be carried out after crossing the lines, preferably close to the zero axis of the indicator.

Close all your trades or some of them with this script. If you have multiple trades open on a symbol and you want to close all of them just drag the script onto the chart and close the trades without delay. The Script will ask you how many trades you want to remain open... In case you want to close all trades just click OK Say you want to leave 1 position open out of 7, just type in 1 and click ok. Script closes trades faster than EA because it does not wait for the market to move but rather
MT4 version - https://www.mql5.com/ru/market/product/69932
Unlike other indicators of this type, this version has: The ability to display data from smaller timeframes on the current chart. For example, displaying data from the M1 period on the H1 chart. Calculation of values using the Gaussian formula (normal distribution formula). Flexible system of settings. Settings: basePeriod - base period. indicatorMode - display mode. Sets the value of each interval: by4h (4 hours), by6h

This is the EA version of the Kenko Trend Indicator mt5. It follows the trend on all instruments and trading pairs according to my improved step and ladder technique.
INTRODUCTION For anyone studying forex charts, the aim is to identify trends, and spot reversals. If you have years of experience it may be easy, but most of us need something to make the trend apparent. If you're familiar with the popular renko charting method, you know that it was developed for this purpose. But renko cha
CRIANDO OPORTUNIDADE COM ROBÔ INVESTIDOR
O curso “Criando Oportunidade com Robô Investidor” é destinado para pessoas que acreditam serem capazes de gerar suas próprias oportunidades no mercado digital , através da programação de sistemas automatizados você será capaz de criar seus próprios robôs e executar suas operações operando seu próprio capital ou de terceiro, além de descobrir onde e como vender seus robôs.

Indicator tested for 7 years with excellent results when used correctly An order flow tracking indicator when used at support and residence points simply shows the direction of the Big Players, validating good opportunities seek optimal risk-adjusted returns on their investments. Use when Flow line crossing at signal line after candle closed , works with absolutely everything
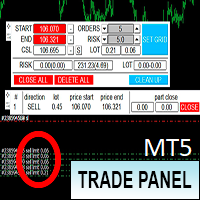
Торговая панель предназначена для установки сетки ордеров с различными параметрами. Добавлено все что есть у версии для МТ4. Предназначена для форекс счетов с хеджированием. Имеет несколько основных функций по установке ордеров в заданном диапазоне и с заданным риском, закрытию части ордеров из сетки, переносом в безубыток, закрытие части по профиту на определённом уровне, а также отображает информацию по текущему риску и отображает все сетки которые были выставлены по определённой паре при этом

Indicator that will show your Balance , and your Equity . Really simple to use, no specific requirements to install it. However you can deeply configure it for your own wishes. The pannel has 4 buttons. Only current will display the information of the chart you linked the indicator. If this is deselected, you will have the information of the whole account. Only Buys will display only the BUY orders and Only Sells will display only the SELL orders. Show Zero will display the 0

This indicator is based on the crossing of two Moving Average with the RSI It is intended for scalpers Specially designed for Boom and Crash syhtetic indices from Binary.com/Deriv.com It is easy to use and intuitive. We recommend its use on M1 and is equipped with three types of notification Email alert Sound notification Push notification these parameters can be activated and deactivated.

Painel informativo fácil de usar e pode ser usado em qualquer gráfico . Painel Pega o Resultado Por Numero Magico Somente para plataforma Metatrader5. Painel informa todos os resultados do dia sendo positivo ou negativo, Lucro e muito mais. Fácil de usar e pode ser colocado facilmente dentro de um Robô . Muitas pessoas precisam de diferentes paineis para cada tipo de EA, ou seja, pode se tornar cansativo fazer um novo para cada aplicação. Portanto decidi fazer um painel modular que se adapta ao
FREE

Dear Investor, I'm developing this amazing trading strategy, I´ve developed this trading system which enable you get tremendous profit with little risk. My main goal when developing a system is stable growth under any market condition. All my systems have to pass strict criteria in terms of historical data. It:
Trades the XAUUSD with a focus on long-term stable growth. Uses no martingale nor any grid or "recovery" methods . Every trade is protected with a stop loss.
Didn´t have a losing year

-25% discount ($199 -> $149) Advanced trading tool: One click smart orders that execute under your conditions Developed by trader for trading community: position size calculator (lot size), open position after price action, strategy builder, set and forget trading, mobile notifications...
Risk Management - Risk percentage position size calculator, gain percentage, target risk reward ratio, spread and commissions are included in calculations 7 Advanced order types - Set and forget trading w

矩阵箭头指标 MT5 是一种独特的 10 合 1 趋势,遵循 100% 非重绘多时间框架指标 ,可用于所有符号/工具: 外汇 、 商品 、 加密货币 、 指数 、 股票 。 Matrix Arrow Indicator MT5 将在其早期阶段确定当前趋势,从多达 10 个标准指标中收集信息和数据,它们是: 平均定向运动指数 (ADX) 商品渠道指数 (CCI) 经典 Heiken Ashi 蜡烛 移动平均线 移动平均收敛散度 (MACD) 相对活力指数 (RVI) 相对强弱指数 (RSI) 抛物线SAR 随机振荡器 威廉姆斯的百分比范围 当所有指标给出有效的买入或卖出信号时,相应的箭头将打印在图表上,在下一根蜡烛/柱线开盘时,指示强劲的上升趋势/下降趋势。用户可以选择使用哪些指标,并可以单独调整每个指标的参数。 Matrix Arrow Indicator MT5 仅从选定的指标中收集信息,并仅根据其数据打印箭头。 Matrix Arrow Indicator MT5 还可以为所有新信号发送终端、推送通知或电子邮件警报。无论您是黄牛、日内交易者还是波段交易者, Mat

Trend WIN B3 是为 MT5 平台创建的专业交易系统,并优化与巴西 B3 上的 MINI FUTURE INDEX (WIN) 配合使用.
系统在多个时间段(1M、5M、15M、30M、H1、H4、D1)中使用模糊逻辑来识别价格趋势,根据计算结果在每个时间段应用权重。 识别趋势后,系统根据平均波动率设置止损单(买入或卖出),开仓时,EA通过追踪止损进行交易,始终追求利润最大化.
主要特点 不使用鞅 不使用网格 在图表上显示通过模糊算法计算出的趋势 适用于任何时间范围 可配置的工作时间 可配置的开口间隙控制 可配置的批量增加动态模式 4 个可配置的追踪止损水平 通过访问包含产品手册和视频的博客了解更多详细信息和信息: https://www.mql5.com/pt/blogs/post/745842
如果您还有问题,请通过直接消息与我联系: https://www.mql5.com/zh/users/robsjunqueira/

如果你象这个项目一样,就有5个饥饿审查。 塔克的后续工作: borelatech 这一指标在重新配置时间时得出了一包元。
可以结束和: 可在图表的任何角落上定位; 多时限; 你可以把它赶出一个指标窗口,把它拖进“MT5 navigator”。 当屋顶有10秒钟时,不同颜色。 习惯色彩色图,以便更好地融入图表。
FREE

这个EA是将 DYJ Tradays 指标与 DYJ GlobalTradeWar 策略相结合的专家, DYJ GlobalTradeWar 是一种扭亏为盈的策略,它的特点是: 当订单方向正确则止盈。 当订单方向错误时扭亏为盈 您可以设定其目标盈利。 EA能设置EA自动交易和EA手动交易切换或者混合交易。 DYJ Tradays 是用于基本市场分析的宏观经济事件日历指标。 您可以在其中找到全球最大经济体的财经新闻和指标——从美国和欧盟到澳大利亚和日本,共有 23 大经济体,涉及 60 多个货币对。 800多个宏观经济指标和事件实时从公共来源收集。每个指标都有历史、当前和预测值以及重要性特征。此外,该服务以图表和表格的形式存储了大量的历史数据。 所有货币对(43) GBPUSD, EURUSD, USDJPY, USDCHF, XAUUSD, USDCAD, GBPJPY, EURJPY, EURGBP, EURAUD, EURNZD, EURCAD, EURCHF, CADJPY, CADCHF, AUDUSD, AUDNZD, AUDCAD, AUDJPY, AUDCHF

該指標在圖表上顯示重要的技術水平。 這些水平充當價格走勢的支撐或阻力。
最重要的等級是 100 和 50 分的倍數。 您還可以以 25 點的倍數顯示級別。
當價格達到該水平時,將顯示警報或推送通知。
MT4 版本 https://www.mql5.com/zh/market/product/69486 設置 Show Levels 100 pips - 以 100 點的倍數顯示水平 Show Levels 50 pips - 以 50 點的倍數顯示水平 Show Levels 25 pips - 以 25 點的倍數顯示水平 Color Levels 100 pips - 可被 100 點整除的級別的線條顏色 Color Levels 50 pips - 可被 50 點整除的級別的線條顏色 Color Levels 25 pips - 可被 25 點整除的級別的線條顏色 Send Alert - 發送通知 Send Push - 發送推送通知
FREE

免费获得其他 EA!!!免费获得其他 EA!!!免费获得其他 EA!!!免费获得其他 EA!!!免费获得其他 EA!!!
RSI 网格基于 RSI 的超买和超卖情况,并在交易处于市场亏损的一侧时打开一个网格。 RSI 为技术交易者提供有关看涨和看跌价格动能的信号,它通常绘制在资产价格图表下方。当 RSI 高于 70% 时,资产通常被认为是超买,而当 RSI 低于 30% 时,资产通常被认为是超卖。
参数:
时间过滤器
周一
周二
周三
周四
星期五
周六
星期日
开始时间
时间结束
RSI 设置
RSI 周期
超买
超卖
大体时间
金钱管理
自动售货机
最大手数
获利
网格大小
乘数
尾随期权
追踪止损
尾随步骤
轨迹偏移
设置文件
v1.8 英镑兑美元 SET 1
https://youtu.be/a7PfCr1jYXQ
https://drive.google.com/file/d/1dP1sZvSQddY_D0meY6vul4Kk78cqo

Promo: Only 1 copy left at 299$! Next price: 499$ Forget nice looking backtests: The Reaper EA is already ahead of the curve!
Let's face the truth: The biggest problem with most of the automated trading systems on the market, is that all of them show very nice backtests, but only a handfull actually perform on live accounts. This is very frustrating when you poured your hard earned money into them. (Not to mention the many EA's in the market, that use manipulated backtest results to sell t

Taka Taka Scalper Pro is a simple expert advisor that can be configured according to moving averages signals, such as triple, double or exponential moving average . Trigger signals are configured when these averages crosses. Besides, there is a important ATR filter to trade only on such volatility. A trend filter can also be configured according to averages. Takeprofit and stoploss are calculated according to ATR multiplier , even for long or short trades. You can also configure a non scalper mo

EA 专为夜间剥头皮而设计 EA 基于 RSI 指标在夜间的超买和超卖情况,并在交易处于市场亏损方时打开网格。当 RSI 高于 70% 时,资产通常被视为超买,当 RSI 低于 30% 时,通常被视为超卖。 (这些参数会根据交易工具和时间范围进行调整)
使用讨论中发布的设置 设置的最低存款额为 500 美元。交易时间范围为 M15。
• 最低存款额为 500 美元(每个交易对)
• 经纪商滑点最小。
• 账户类型 ECN
• 杠杆 1:500 或更高
.set 可用在与顾问讨论 推荐的交易货币对 USDCAD、EURUSD、AUDUSD、GBPUSD
参数: RSI 设置 RSI 周期 超买 超卖 时间框架 资金管理 自动批量 获利 网格大小 乘数 您可以随时在我的个人资料中请求技术支持、设置和安装帮助。

Display Order box list from Trading box Order Management tool. Find contacts and manual links on my profile . This dashboard gives you an edge in forex trading because in few seconds you can decide which pair and timeframe is worth to watch more closely. This is how you will not be distracted by all other forex pairs that you trade, and you will not miss great opportunities to trade the best price.
Trading Dashboard (order box overview panel and Trading box Order management extension) Tr
FREE

El robot utiliza una valoración del beneficio sobre el tiempo del una posición múltiple formada por un triangulo.
#Multicurrency #Hedging #Martingale #28Symbols @AUD @CAD @CHF @JPY @NZD @USD @EUR @GBP Pyramid uses the same base structure than Black Box-Alpha and builds a conceptual model where general rules and concepts are derived from the price. This is a mathematical model designed to trade the performance of a financial asset or portfolio of a business, project, or any other i
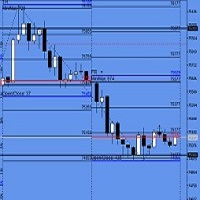
Open close levels.
Open close levels - is an indicator for MetaTrader 5, which displays High/Low, Open/Close, ATR levels (set manually) of the day, week, month on the chart. Marks round levels, signs the days of the week, numbers every week. All levels are marked with price tags with a price symbol. Also, the indicator automatically calculates and displays on the chart the distance that the price has passed from High to Low and from Open to Close by day, week and month.
The indicator di

Steady Flow MT5 is a fully automated system which has been developed to make strategies compatible with price action patterns. Protected by stop loss and take profit The Expert Advisor does not use martingale, grids, hedging, averaging and other risky strategies Enable or disable news filtering according to user needs Continuously generating profits Can trade full time in all conditions Works well in all market conditions, either trend or sideways This EA has passed 18 years back test of tick

Automatically plots the 'Golden Fibonacci Ratio’ between the High and Low of the previous day... ...Highs and Lows are great Support and Resistance zones.
Breakouts of Fibonacci levels are key points for entry and exit of trades.
Pink lines indicate that the previous day's Candle closed lower. Blue colored lines indicate that the previous day's Candle closed higher.

For anyone studying forex charts, the aim is to identify trends, and spot reversals. If you have years of experience it may be easy, but most of us need something to make the trend apparent. If you're familiar with the popular renko charting method, you know that it was developed for this purpose. But renko charting has a flaw; the trend is often broken by false reversals. So I developed my own version - the Kenko Trend Indicator. The kenko trend indicator draws renko style trend following block

One of the most famous phrases in the trading world is "The Trend Is Your Friend".
Trading following the current trend is one of the most successful ways in terms of probability. The hard part of it is to recognize when the market is trending or not.
that's the role of our indicator we called The Trend Is Your Friend Until It Is Not. Apart from its big name it is really easy to use and see when the market is trending or ranging. Through a little window of 3 colors you will identify if the ma
MetaTrader市场是 出售自动交易和技术指标的最好地方。
您只需要以一个有吸引力的设计和良好的描述为MetaTrader平台开发应用程序。我们将为您解释如何在市场发布您的产品将它提供给数以百万计的MetaTrader用户。
您错过了交易机会:
- 免费交易应用程序
- 8,000+信号可供复制
- 探索金融市场的经济新闻
注册
登录