适用于MetaTrader 5的新EA交易和指标 - 148

The EA uses 6 strategies. Trading is carried out in a pair of several currencies at the same time, for example, the EA opens orders simultaneously for two or more pairs and closes when a certain profit is reached.
The EA trades many major currency pairs. Attention! This EA is only for "hedging" accounts. Monitoring : https://www.mql5.com/en/signals/author/profi_mql Detailed description of important parameters and download set files here: https://www.mql5.com/ru/blogs/post/727816 МetaТrade

Automatic MIDAS positioning, the indicator allows the placement of two MIDAS, each one have 3 lines that can be calculated using Open/High/Low/Close/Median/Typical or Weighted prices, you can attach each MIDAS to the Open/High/Low or Close bars of any day, including the current day, once attached, if the price of this bar changes or you change the time frame, the indicator will do the repositioning and recalculation. You can also do a manual repositioning of the two MIDAS by moving its start lab

Infinite Storm EA is a safe and fully automated expert advisor that analyzes market trend and price movements and thanks to that is able achieve high rate of winning trades. Every order has StopLoss (either real or virtual) and EA has implemented advanced filtering functions together with spread and slippage protections. This EA does NOT use any of the dangerous strategies like Martingale, Grid or Arbitrage. This EA is fully customizable by user. This EA is not limited by trading pair or time
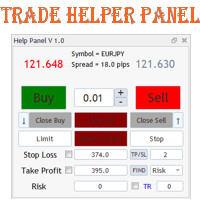
Данная панель предназначена для удобного совершения сделок в платформе Metatrader. Она позволяет с легкостью открывать позиции, устанавливать стоп лосс и тэйк профит, использовать трейлинг стоп и тд..
Входные параметры :
Magic - уникальный номер эксперта Lot step - шаг изменения лота Custom - произвольная сумма для высчитывания риска Risk Value - тип поиска значения риска (в %) Функции панели : Открытие sell и buy позиций
Возможность установки profit / loss для позиции, в том числе и графи
DEMA Cross
DEMA Cross - это мультивалютный трендовый советник, работающий на реальных счетах любого типа, на любом временном интервале, с любым начальным депозитом, с постоянным или изменяющимся размером лота, с четырех- и с пятизначными котировками, а также с брокерами, использующими различный тип заливки ордеров.
Отличительной особенностью советника является его стабильность и, что особенно важно, его достоверность. Результаты проверки советника в тестере стратегий в 4-х режимах (2 основ

Volume Delta Panel is a very powerful indicator that read the supply on Market. It calculates the Delta from movement of the price and the difference of BUY volumes and SELL volumes. The Volumes are added to price and normalized to symbol points.
Its special structure allows you to get all Time Frames values available on the platform MT5. Panel can show 50 instruments simultaneously all customizable according to the offer of the Broker. A good observation of this instrument can suggest great
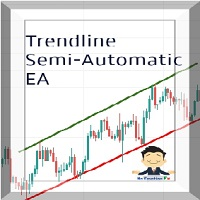
Managing Trades With Trendline EA : Trendline EA is a very good tool for using trend at your advantage & can be used for managing both take profit & stop loss . Can be used in all time frames and uses close price of Candle as stop loss therefore it will close the trade only if candle closes above or below trendline , this function saves traders from wicks and market noise . Where as Take profit is by simple touch of trendline.
For More info click on link below : https://www.noemotionf

This indicator represent option and basis values as a tax, using this formula: Tax = ( ( strike / ( basis - option ) ) - 1 ) * 100 It's not time based (don't use time to expire information) You can set a fixed strike value, and a fixed basis symbol if needed. Some exchanges/brokers don't provide this information at marketdata and that's the only method to use this information when not provided.

PINBAR SCANNER PRO with TREND and RSI + CCI OSCILLATORS filter This indicator has been designed to automatically and constantly scan entire market to find high probability pinbar formations, so you can just wait for the perfect trading opportunity come to you automatically.
PINBAR is the strongest candle reversal pattern known in technical analysis. It shows excellent areas to determine potential entries and exits with opportunity to use excellent risk and reward ratios. It includes an RSI an

Description Very robust and powerful indicator, which allows through its 4 components, trade the market in trend or not trending conditions. it based on a very reliable trading strategy and gives you all you need to be succesful in trading. KEY LINKS: Indicator Manual – How to Install – Frequent Questions - All Products How is Clever Scalper Pro useful to you? A complete and reliable trading strategy. Easy to understand and trade Allow to identify trend, confirm it, look for retraceme

很多时候,在金融系列的研究中应用他们的平滑。使用平滑,您可以删除高频成分 - 据信它们是由随机因素引起的,因此无关紧要。平滑总是包括一些平均数据的方法,其中时间序列中的随机变化相互吸收。大多数情况下,为此目的,使用简单或加权移动平均方法,以及指数平滑。 这些方法中的每一种都有其优点和缺点。因此,简单的移动平均值简单直观,但其应用需要时间序列的周期和趋势分量的相对稳定性。另外,信号延迟是移动平均值的特征。指数平滑方法没有滞后效应。但即使在这里也存在缺陷 - 只有在将系列与随机异常值对齐时,指数平滑才有效。 简单和指数平均值之间的合理折衷是使用加权移动平均线。但是,存在选择特定重量值的问题。让我们一起尝试解决这个问题。 因此,首先要定义我们希望从平滑过程中实现的目标: •首先,我们需要从价格序列中删除随机变化和噪音; •其次,我们希望识别异常排放和异常价格行为,这些行为也可用于贸易; •最后,平均程序应确定市场中存在的可持续趋势。 当然,我们希望平滑程序适应当前的市场情况。 为了获得理想的结果,我们将根据此价格水平与研究期间的最高和最低价格之间的差异来计算权重。通过这种方法,我们得到一个

该指标更具信息量。他的工作基于这样的假设,即市场中的价格变动可以表示为特定颜色的噪声,这取决于价格值分布的参数。由此,可以从不同角度分析价格变化,并将价格变动视为特定颜色的噪声,可以获得有关市场当前状态的信息并对价格行为进行预测。 在分析指标读数时,会考虑指标线的位置 - 它们位于当前柱的开盘价的上方或下方以及距离它的距离。 白噪声(白噪声) - 这种方法的特点是价格(当前和史前)被认为功率相等,这与简单的移动平均值相结合。白噪声信号更有可能证实这一特征 - 它越偏离当前价格,市场中的趋势运动就越强烈。相反,如果白噪声线接近开盘价,那么这就是趋势结束或横向价格变动的证据。 闪烁噪声(闪烁噪声)概述了趋势的上边界或下边界(取决于线是否高于或低于价格)。此外,这种噪音线与货币对价格的交叉点可以作为新趋势开始的证据,甚至是短期趋势的开始。 布朗噪声在很多方面的行为类似于指数平滑。因此,噪声线跟随价格,只有市场突然和突然的变化才有可能出现大的偏差。 蓝噪声显示趋势对当前趋势的强烈程度。由于蓝色噪声线与当前价格存在较大偏差,我们可以说趋势已经耗尽其力量并接近完成。 紫色噪音表明周期性或周期性价

尽管“ AIS Color Noise Filter ”指示器存在一些缺点,但使用它来平滑价格序列和预测价格的想法看起来非常有吸引力。 这是由于以下几个原因: 首先,考虑到几个噪声成分,可以建立相互独立的因素预测,从而提高预测质量; 其次,价格序列的噪声特征在整个历史中表现得相当稳定,从而可以获得稳定的结果; 最后,噪声变化使我们希望预测系统非常敏感,并且它对价格变化的反应将非常快。 因此,我们得到一个指标,尽管有所有简化,但能够准确预测价格将会移动的渠道。该指标的主要优点是速度快,易于学习。主要缺点是指标无法选择最重要的预测因素。 LH 是一个参数,用于设置进行预测的历史数据的长度。其允许值为0 - 255,而指标处理的柱数超过此参数指定的单位数。

Description Very precise patterns to detect: entry signals as well as breakout, support and resistance reversal patterns. It points out zones in which, with a high probability, institutional orders with the potential to change the price’s direction and keep moving towards it, have been placed. Support: We create great tools for the entire trading community. Most of them are free. If you believe in what we do Support Us Here. KEY LINKS: Indicator Manual - All Products
How is this ind

This is Gekko's Bollinger Bands indicator. It extends the use of the famous Bollinger Bands and calculates strong entry and exit signals using price action on the edge and on the middle bands. You can set it up in many different ways, eg: pullback, pullback against trend, middle band crossing and middle band crossing against trend. Inputs Number of Bars to Plot Indicator: number of historical bars to plot the indicator, keep it low for better performance; Produces Signal Only When a Bar Closes:

简介:
TradeCopy是一款高效,易用的跟单系统,通过简单的设置(可参考下方截图),即可以实现 MT5之间互相跟单 、 MT5与MT4之间互相跟单 。 需要注意的是,如果想要实现MT4与MT5之间互相跟单,还需要购买Tradecopy的MT4版本,MT4上运行MT4版本,MT5上运行MT5版本。 跟单的时候需要让MT4、MT5运行在同一台电脑上,如果不懂怎么在一个电脑上运行多个MT5客户端的朋友,可以私信我,非常乐意教你。 使用视频介绍 需要测试效果的朋友可以下载免费的可以用于模拟帐号交易的版本 : MT4模拟账号测试版本地址: Trade Copy MT4 Demo Free MT5模拟账号测试版本地址: Trade Copy MT5 Demo Free 特点: 1、可实 MT5之间互相跟单 、 MT5与MT4之间互相跟单 。 2、发射端和接收端为同一个文件,使用时只需要在参数中设置成发射端或者接收端,非常方便。 3、跟单方式多, 可以按结余、净值、手数比例或者固定手数跟单 。 4、可以设置反向跟单。 5、币种不同名字,可以进行转换。 6、 1次购买获得20个激活码 ,

简介:(此版本用于模拟账号测试功能)
TradeCopy是一款高效,易用的跟单系统,通过简单的设置(可参考下方截图),即可以实现 MT5之间互相跟单 、 MT5与MT4之间互相跟单 。 需要注意的是,如果想要实现MT4与MT5之间互相跟单,还需要购买Tradecopy的MT4版本,MT4上运行MT4版本,MT5上运行MT5版本。 跟单的时候需要让MT4、MT5运行在同一台电脑上,如果不懂怎么在一个电脑上运行多个MT5客户端的朋友,可以私信我,非常乐意教你。 使用视频介绍 需要测试MT4效果的朋友可以下载免费的可以用于模拟帐号交易的版本 : MT4模拟账号测试版本地址: Trade Copy MT4 Demo Free
特点: 1、可实 MT5之间互相跟单 、 MT5与MT4之间互相跟单 。 2、发射端和接收端为同一个文件,使用时只需要在参数中设置成发射端或者接收端,非常方便。 3、跟单方式多, 可以按结余、净值、手数比例或者固定手数跟单 。 4、可以设置反向跟单。 5、币种不同名字,可以进行转换。 6、 1次购买获得20个激活码 ,极大节约多账号管理者的经费。 使用向导:
FREE

Trading was never easy until experience and continuous improvement is used as a strategy. Trend Sniper Fire scalper is one of the best EA witch is now available for MT5 platforms. This Expert Adviser uses a combination of indicators and Price Action to analyse the market. Its major strategy used a trailing stop and hedging to ensure continuous profits. It is slightly affected by the economic news but there is also an MT4 version with a news filter. Regardless of news effects, this EA was revised

SparkLight EA is a fully automated expert advisor that uses advanced algorithms for the price analysis of the latest trends. Every order has StopLoss and every order is placed based on the primary or the secondary trend analysis algorithm. This EA does NOT use Martingale or Arbitrage strategy. It can trade more orders at the same time but every order has the same Lot size if using FixedLotSize. SparkLight EA is NOT a minute scalper or tick scalper that produces high number of trades per da
FREE

Description: The indicator shows the TDI indicator in a separate window, and with the RSI component, the indicator finds possible divergences with M or W patterns. KEY LINKS: How to Install – Frequent Questions - All Products Functions: Finds Market Makers patterns. Finds extremes or exhaustion into the market. Looks for a trend continuation. Content: TDI Indicator Divergence and M or W Signals Note 1: This indicator should only be considered as a part of any trading strategy. You shoul

Session Volume Profile is an advanced graphical representation that displays trading activity during Forex trading sessions at specified price levels. The Forex market can be divided into four main trading sessions: the Australian session, the Asian session, the European session and the favorite trading time - the American (US) session. POC - profile can be used as a support and resistance level for intraday trading.
VWAP - Volume Weighted Average Price.
ATTENTION ! For the indicator to
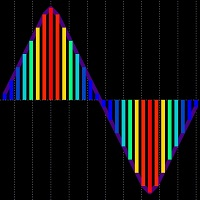
Markets Heat indicator can help you determine correct course of action at current market situation, by calculating market's "heat level". What is market's "heat level"? Well, it's my own way of simplifying complex market conditions to ease decision-making process. How does it work? Most of time market is moving in some narrow range and can't "decide" where to go -> flat market -> cold market. Other times, price goes Up or Down -> making trend movements -> heating the market. More powerful trends

MarkerElliottWave is a panel for rapid and user-friendly manual markup of Elliott waves. One can select a color and a font of marks. There are also functions for removing the last markup and the entire markup made by the indicator. Markup is made in one click. Click five times - have five waves! MarkerElliottWave will be a great instrument both for beginners and professional analysts of Elliott waves.
Asesor Experto (EA) totalmente automático, opera sin ayuda del usuario, se llama Titan T-REX Robot (TTREX_EA),actualizado a la versión 2, diseñado a base de cálculos matemáticos y experiencia del diseñador plasmado en operaciones complejas que tratan de usar todas las herramientas propias posibles. Funciona con todas las criptomonedas y/o divisas del mercado Forex. No caduca, ni pasa de moda ya que se puede configurar el PERIODO desde M1..15, M30, H1.... Utiliza Scalping de forma moderada busca

Intraday Volume Profile analyze short-term information about price and volume, help you visualize the movement of price and volume. In short-term trading on Forex, usually use 5-, 15-, 30-, 60-minute and etc. intraday charts when trading on a market day. It is possible to use as an additional tool for intraday scalping .
The volume profile provides an excellent visual image of supply / demand for each price for the selected timeframe. Representing the Point of Control ( POC ), which indicate

The EA uses a trend strategy based on several relative Strength, Average True Range and Stochastic oscillator indicators. it Also uses a grid and averaging positions up to 6 orders. The EA uses the main timeframe H1 and M15, M30 as additional. Orders use stop loss, take profit, breakeven, trailing stop and smart filter to transfer positions to breakeven. Attention! This EA is only for "hedging" accounts. МetaТrader 4 version : https://www.mql5.com/en/market/product/39786 Multi_Currency_BackTest

A scalping indicator based on mathematical patterns, which on average gives signals with relatively small SL, and also occasionally helps to catch big moves in the markets (more information in the video)
This indicator has three main types of notifications: The first type warns of a possible/upcoming signal on the next bar The second type indicates the presence of a ready signal to enter the market/open a position The third type is for SL and TP levels - you will be notified every time price r
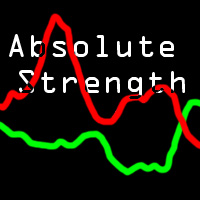
The Absolute Strength (AS) is intended to chart the current and historical gain or loss of an underlying based on the closing prices of a recent trading period. It is based on mathematical decorrelation. It shows absolute strength momentum.
This indicator is not measured on a scale like Relative Strength (RSI). Shorter or longer timeframes are used for alternately shorter or longer outlooks. Extreme high and low percentage values occur less frequently but indicate stronger momentum of the un
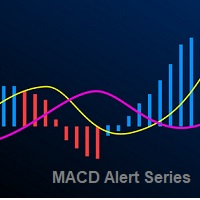
The Moving Average Convergence Divergence Indicator (MACD) is both a trend–seeking and momentum indicator which uses several exponential moving averages set to closing prices to generate trading signals. We added many types of alerts plus the Delay Cross Filter to aid in your search for better opportunities in the market.
Product Features Sound alert Push Notification (Alerts can be sent to your mobile phone) Signs on chart Alert box Alert on zero histogram cross or line sign cross. DelayCros
Strategy Builder offers an incredible amount of functionality. It combines a trade panel with configurable automation (covert indicators into an EA), real-time statistics (profit & draw down) plus automatic optimization of SL, TP/exit, trading hours, indicator inputs. Multiple indicators can be combined into an single alert/trade signal and can include custom indicators, even if just have ex4 file or purchased from Market. The system is easily configured via a CONFIG button and associated pop-u

选择StopLoss和TakeProfit的水平会对交易的整体表现产生非常强烈的影响。除了交易交易的明显参数 - 可能获胜或可能亏损的大小 - 止损和止盈的水平也会影响交易的预期持续时间以及一般交易的盈利能力。 如果您已使用“ AIS-ODT ”脚本确定了最佳事务持续时间,则可以开始确定与StopLoss和TakeProfit级别关联的参数。 为此,我们按以下步骤操作。首先,我们将确定在一个方向或另一个方向上的所有可能的价格偏差,并计算在一定时间内实现它们的概率。之后,您可以根据其大小,概率和预期利润值计算StopLoss和TakeProfit的最佳水平。 为此,请在感兴趣的货币对的图表和所需的时间范围内运行脚本。使用属性窗口中的ILB参数,设置交易仓位的期望持续时间,以柱数表示。在实用程序的工作期间,分析整个历史记录的数据,并选择最佳值。在脚本结束时,形成了两个文件 - “Buy.csv”和“Sell.csv”,其中包含获得结果的表 - 图1。 在表格的第一列中,指示了可能的TakeProfit大小,在第二列中,指示了最佳的StopLoss大小。第三列显示以百分比表示获胜这些参数的概
FREE

The indicator calculates volume profiles dynamically and displays the result as VAL, VAH and POC curves.
Indicator features The indicator uses the historical data of the lower (relative to the current) timeframes for calculations: M1 - for timeframes up to H1, M5 - for timeframe H1, M15 - for timeframe H4, H1 - for timeframe D1, H4 - for timeframe W1, D1 - for timeframe MN. The color of the DPOC curve sections is determined by comparing the volume of the POC levels of all profiles that make u

Are you the type that likes to protect your trades by moving the stop loss to the entry point and also using trail stop?
Cool! This EA will help you with that. What's more, it also partially closes the trade when the trail stop is activated. That's it!
Beyond all this it shows the stop loss projection (which you can move) and notify you when it is activated.
EA can be used by configuring the default window or by using a custom window , which makes it easy to change settings.
You can t

Short-term price imbalances allow the EA to earn regularly. The test showed profitability on all currency pairs and, especially, on the ones offered below. Account. MT5 (Hedging), preferably with a fixed spread of up to 12 points. Currency pairs. CADCHF, EURCAD, EURCHF, EURGBP, GBPCAD, GBPCHD, GBPJPY, USDCHF Timeframe. M15 Parameters. Number of lots: maximum of 1.00 lot on the 1000 margin with leverage 1:500 Hour of start hour of the rollover at the terminal time
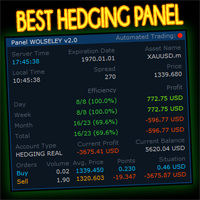
WOLSELEY's Trading Panel View your history in a structured and detailed manner, with efficiency rate and profit rate separated by day, week, month and total, as well as asset details, server time and positions&orders in progress. This panel was created looking on HEDGE-type accounts, but it can be used on NETTING-type accounts without any problems. In the PREMIUM version of this Panel you have the option to use buttons to facilitate the processing and execution of positions&orders in progress.
FREE
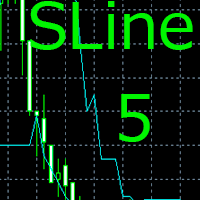
Данный индикатор помогает трейдеру выявить импульс цены,а также рассчитать его силу относительно среднего истинного диапазона движения цены. Индикатор будет незаменимым помощником для трейдеров использующих в своей торговой стратегии,теорию "Снайпер",в которой для торговли используются так называемые "импульсные уровни".Индикатор работает с любыми валютными парами находящимися в окне Обзор Рынка МТ5,металлами,индексами и т.д. Для работы по индикатору,нужно дождаться момента,когда 3 линии с вверх

Didi Index Alert Plus Filter
Indicator developed by Brazilian and analyst Odir Aguiar (Didi), consists of "Moving Averages", known for the famous needles Didi, which allows the visualization of reversal points. The concept is very simple, when you insert 3 Moving Averages on display, one of three periods, an 8 and the other 20, there appears the formation of the indicator which works on an axis or center line 0. The needles occur when the intersection of averages comes closest to the line 0.

Product Description This trading robot uses historical chat data to predict the future direction of the forex market. The EA uses Price Action, ADX indicator and secret formula to make predictions for the next trading signal. The Expert Advisor is fully automated, and the user must only change the maximum risk size in the input parameters. Results This EA is designed to operate on the EUR/USD to make the best profits. This EA was run for each year between 2017 to 2019 separately and was found to

DESCRIÇÃO
O TS Trade é um robô desenvolvido por profissionais com longa experiência no Mercado Financeiro. É baseado em algoritmos de negociação avançados. Tem como principal característica uma gestão de risco rigorosa. É perfeito para quem busca uma ferramenta eficaz para automatizar suas negociações. Instale o Robô e deixe que ele faça todo o trabalho por você. MÉTODO O TS Trade utiliza um algoritmo o qual possibilita identificar uma tendência do mercado a partir da movimentação de duas méd

Simple Day Trading Strategy SDT VERY RELIABLE DAY TRADING AND SCALPING INDICATOR THAT CAN MAKE EVEN A NEWBIE PRODUCE TREMENDOUS RESULTS. IT IS SIMPLE AND FAST, NO FANCY ON-CHART OBJECTS. JUST BUY AND SELL ARROWS. IT TELLS YOU WHEN TO ADD TO A POSITION AND WHEN YOU SHOULD CONSIDER EXITING. THE BEST TIME TO EXIT ALL TRADES COMPLETELY IS ON OPPOSITE SIGNALS
GREAT PRODUCT FOR ALL TRADING STYLES (swing, day trading, scalping, etc). JUST TRY IT ON ALL TIME FRAMES AND CURRENCY PAIRS AND SETTLE ON

该指标的独特之处在于交易量核算算法:在所选时段内直接进行累积,而无需参考当天的开始。可以从计算中排除最后的柱线,那么当前数据对之前形成的显着水平(交易量)的影响较小。 为了更精确的计算,默认使用 M1 图表中的数据。规范了价格量的分配步骤。默认情况下,显示的右边框设置为用于分析的数据开头对应的栏,但如果需要,可以设置为您需要的栏。显示的音量带的长度(右边界)由系数调节,也可以向左或向右移动到 0(当前)条或参照当前条进行镜像。 参数: Accumulation period - 累积量计算周期 Number of excluded last bars - 从计算中排除的最后一根柱线的数量 Accumulation price step - 按价格参数的成交量总和步骤 Graph length multiplier - 显示数据的长度比例 Use data from timeframe - 用于分析的图表(时间范围) Graph show shift - 开始显示数据的移位,如果留为0,则数据将从分析数据周期开始时间对应的条开始显示; “-1”——显示在左侧; “-2” - 显示

该指标自动计算并绘制斐波那契支撑位和阻力位 - 最有效的市场分析工具之一。 计算使用所选期间和时间范围的平均价格数据。此期间的最小值和最大值被视为运动的开始和结束。 斐波那契水平让您可以看到潜在的参考点,围绕这些点价格走势可以放缓或逆转,也就是说,它们用于预测进一步的走势,以及设置止损和限价单。 参数: PartsShow - 从当前柱状图显示的历史级别数 CalcPeriod - 价格平均周期 SmoothingMethod - 价格平均法(26 个选项) TF - 用于计算的时间范围 LevelColor - 水平线的颜色 ZeroLevelColor - 零级颜色 ShowVerticalLine - 启用/禁用水平之间的垂直线的显示 VLineStyle - 垂直线的样式 VLineColor - 垂直线的颜色 ShowInfo - 启用以标签形式显示有关级别百分比值的信息,否则以对象描述的形式显示 InfoFontSize - 信息字体大小 InfoColor - 信息字符串的颜色 FiboLevels - 显示水平的百分比值

【ZhiBi Dragon】是依据的震荡原理,可以预测市场的横向整理形态和趋势形态,再根据市场形态,给出下单信号,并且,还有信号的概率和趋势的质量! 绿、红、水绿,这三根细线向上穿过黄线是向上的趋势,这三根细线向下穿过黄线是向下的趋势。 信号的概率分为三个等级:25%或50%或75%,概率越高准确性越高。(Buy是买单的信号,Sell是卖单的信号;Top是可能到达了顶部,市场可能会向下;Low是可能到达了低部,市场可能会向上)。 信号的质量分为两个等级:30%或70%,质量越高准确性越高。(Up是向上的趋势,Down是向下的趋势,Caution!是市场横向整理)。 参数设置: 【Waves】是波动幅度,数值越大越稳定,数值越小越激进,建议设置为20-60之间。 【WinAlerts】弹窗消息的开或关;true=开、false=关; 【MessageAlerts】消息推送到移动终端的开或关;true=开、false=关; 【eMailAlerts】电子邮件的开或关;true=开、false=关;
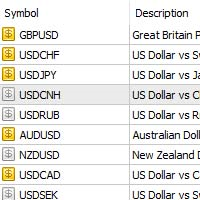
This product is design to export all pairs that you have it in your meta trade if you have too many pairs , shares , indicators , CFDs etc you just need 1 click to export all or them to txt file Works as an Script, reading all pairs . There's no option to change. There's no Web Request. There's no DLL use. File location: MQL5\Files . with name broker name._Symbols.txt
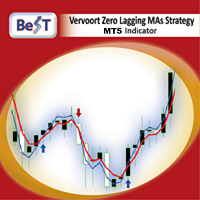
All those involved in trading do certainly know that Moving Average Crossovers for being tradable should be reliable and also they need to have minimal lag.
BeST_Vervoort Zero Lagging MAs Strategy is an outstanding indicator that can help you to achieve it and is based on S.Vervoort's work about Reliable and of Zero Lag MAs Crossovers as described in his TASC_05/2008 article " The Quest For Reliable Crossovers ". It's a Multipotentiality Indicator as it can display of either simply the Zero Lag
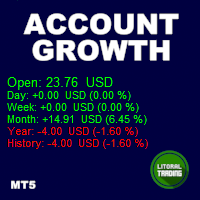
Tired of calculate every weekend and the end of the month to know how much you've earned and how much your capital has grown?
Then this indicator will help you! It informs you how much your capital has grown in money and percentage in the day, week, month, year and in history, plus show how much volume ou used, how much trades you did and how much comission and swap you paid. Alo the open positions result are showed in money and percentage. Note: The amount of trades displayed may differ from

RoundNumbers indicator is a simple and powerful psychological price levels. Trader usually use these levels as a Support and Resistance (SnR). Indicator Input: Levels - Numbers of levels drawn on chart. Default 30 levels. BoxSize - Box size drawn on each levels, indicate buffers around levels. Default value 1pips (10point) above and below each levels. ZoneSize - Distance between each levels, default value 10pips (100point). Style & Colours - User inputs customization. For MT4 version, p
FREE

ATR is an excellent indicator to visualize if volatility is increasing or decreasing. But what if you want to compare the volatility to another pair or instrument? Since each pair with different quote currency has different pip value, the output of the ATR doesn't really say that much. Comparing pairs to other instruments is even harder. What you as a trader care about is how much the pair has moved up or down in percentage, therefore normalizing ATR to percent would make things much easier. T
FREE

This is an original trend indicator. The indicator draws three lines in a separate window. Its values vary from -1 to +1. The closer the indicator is to +1, the stronger is the ascending trend. The closer it is to -1, the stronger is the descending trend. The indicator can be also used as an oscillator for determining the overbought/oversold state of the market. The indicator has one input parameter Period for specifying the number of bars to be used for calculations.
FREE

Very simple work on the principle of work. The elementary neural network is used, with the help of which the normalized RSI indicator is analyzed, the neural network has three outputs. One is responsible for the direction of trade, the other two for stop loss and take profit. Thus, by optimizing the coefficients of the neural network (this is the usual optimization using a genetic algorithm), we get a well-adapted network to work in the future. Sampling according to the results of optimization m

This Copier allows you to copy trades between Metatrader terminals even when they are installed on separate computers.
Having both MT4 and MT5 versions of the Copier makes it possible to send trades from MT4 to MT5 and vice versa. Demo version: https://www.mql5.com/en/market/product/39290 MT4 version: https://www.mql5.com/en/market/product/19928 Only Hedging Accounts are supported! Netting Accounts are not! Features
Fast execution (~1 sec, depending on location/broker) Automatic symbol pre

Технический индикатор "Reversal patterns" является математической интерпретацией классических разворотных паттернов: Pin Bar, Harami и Engulfing. То есть «Разворотного бара», «Харами» и «Поглощения». Данный индикатор позволяет определить момент разворота котировок на основе рыночной динамики и победителя между «быками» и «медведями». Индикатор отображает момент разворота на локальных максимумах и минимумах графика любого таймфрейма, что позволяет повысить точность сигнала. Также индикатор имеет
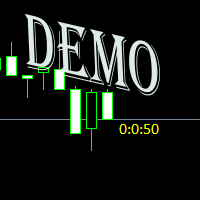
Простая утилита показывающая время до формирования свечи. Может быть очень полезна, если вход в сделку завязан на начале/завершении свечи. Демо версия работает на валюте EURUSD Входные параметры FontColor - Цвет текста. FontSize - Размер текста. FontName - Шрифт текста. TimeOnly - Указывать только время, без дополнительного текста. TypeOfDrawing - Тип отображения информации Важно : возможна задержка в 1 сек.
FREE

Niubility Trend Niubility Trend displays the trend direction for all time frames in real time.
You'll see at a glance at which direction the trends are running, how long they last and how powerful they are.
All this makes it an easy-to-use trend trading system for beginners, advanced and professional traders.
Features
Easy to trade Customizable colors and sizes It is non-repainting and non-backpainting It is fantastic as a trailing stop method It implements alerts of all kinds

Niubility Scalping The Niubility Scalping indicator detects trend, give sell point and buy point. this indicator can use for scalping technique, and also use for trend technique.
Attention
Chart statistics will help you to optimize your trading, statistical accuracy to the hour.
It can works on every timeframe.
The indicator analyzes its own quality and performance.
Losing signals are highlighted and accounted.
The indicator is non-repainting.
It implements sound alerts.
Parame

Niubility RSI and Fibo The RSI will send an alert when the RSI value of the price gets to the level specified in the settings.
The input of the indicator can allow for change of RSI period, overbought and oversold.
The RSI will work for multi timeframe.
The RSI will scan different pairs.
This Fibo is designed to draw a Fibonacci retracement, using as a basis the ZigZag indicator.
Description:
'up' word means up trend.
'down' word means down trend.
' -- ' word means no tre

Alert Stochastic plus delay and level Filter
A stochastic oscillator is a momentum indicator comparing a particular closing price of a security to a range of its prices over a certain period of time. We added many types of alerts plus the Level Cross Filter to aid in your search for better opportunities in the market. Product Features Sound alert Push Notification (Alerts can be sent to your mobile phone) Signs on chart Alert box Level Filter Delay Level Filter
Indicator Parameters K

Оптимизируемый, автоматический торговый советник. Основан на техническом анализе, за основу взята стратегия отскока от уровней. В стратегии НЕ используется "Сетка", "Реверс позиций" и "Мультипликатор последующего лота". Торгует одним ордером. Сделки держит от нескольких часов до нескольких дней. Закрытие позиций происходит по сигналу и по Стоп Лосс, Тейк Профит.
Базовые параметры настроены под EURUSD M5 .
Общие рекомендации: Пинг до сервера ДЦ не больше 300 ms. Тайм фрейм M5. Минимальный де

您认为在价格可以瞬间变化的市场中,下单应该尽可能简单吗? 在 Metatrader 中,每次您要开单时,您都必须打开一个窗口,您可以在其中输入开盘价、止损和止盈以及交易规模。 在金融市场交易中,资本管理对于维持您的初始存款并使其倍增至关重要。 因此,当您想下订单时,您可能想知道应该开多大的交易? 在这单笔交易中,您应该承担多少百分比的存款? 您可以从这笔交易中获利多少,利润风险比是多少? 在您设置交易规模之前,您需要进行必要的计算,以获得交易规模应该是多少的问题的答案。 想象一下,您有一个工具可以自动完成所有这些工作。 您打开图表,进行市场分析并用水平线标记入场点、防御点(止损)和目标(止盈),最后您定义风险水平,例如 作为可用资本的百分比,您可以在此交易中承担,此时程序提供: 定义风险和止损规模的可接受交易规模 以点数、点数和账户货币计的止损和获利值 风险回报率 现在剩下的就是点击面板上的相应按钮来打开交易。 如果您是黄牛,需要在不设置防御或目标的情况下快速打开和关闭交易,那么您可以在交易管理器面板中轻松掌握一切,您可以在其中定义固定订单参数并通过单击“购买”或 “卖出”按钮。 关闭

正在寻找可以帮助您轻松识别有利可图的交易机会的强大外汇交易指标? Beast Super Signal 就是您的不二之选。 这个易于使用的基于趋势的指标持续监控市场状况,寻找新的发展趋势或跳入现有趋势。当所有内部策略一致且彼此 100% 融合时,Beast Super Signal 会发出买入或卖出信号,无需额外确认。当您收到信号箭头警报时,只需买入或卖出。
购买后给我留言,让我加入我的私人 VIP 群组! (仅限购买完整产品)。
购买后给我发消息以获取最新的优化设置文件。
此处提供 MT4 版本。
在此处 获取 Beast Super Signal EA。
查看评论部分以查看最新结果!
Beast Super Signal 根据您偏好的 1:1、1:2 或 1:3 风险回报率建议入场价、止损和获利水平,让您放心交易。这个 Beast Super Signal 是 100% 不可重新绘制的,这意味着它永远不会重新计算或重新绘制,每次都能为您提供可靠的信号。 Beast Super Signal 指标适用于所有时间范围,包括货币对、指数、商品和加密货币对。

Coulter 指標取引システムはありません。この作業では、保留中の注文であるBUYSTOPとSELLSTOPを使用します。 アドバイザ設定の説明: ロット-注文の開始ボリューム StartDist-保留中の注文を開始する距離 OrdersDist-注文間の距離 Countlimitorders-同時に開いている注文の数 ProfPercent-パーセンテージとしての利益レベル MagicNumber-アドバイザー注文識別子 lot_ratio-注文ロットの乗数 Coulter 指標取引システムはありません。この作業では、保留中の注文であるBUYSTOPとSELLSTOPを使用します。 アドバイザ設定の説明: ロット-注文の開始ボリューム StartDist-保留中の注文を開始する距離 OrdersDist-注文間の距離 Countlimitorders-同時に開いている注文の数 ProfPercent-パーセンテージとしての利益レベル MagicNumber-アドバイザー注文識別子 lot_ratio-注文ロットの乗数
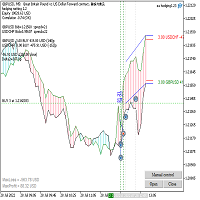
EA在MT5netting账户终端上工作。 (您可以在测试仪中测试EA,并优化历史记录上的参数!) EA策略: 我们知道,高度相关的货币几乎总是以镜像的方式行事。 但也有偏差的时刻(货币背离)从正常值。 该EA在货币趋同的方向打开订单。 如果差异发生很长时间,则使用重新填充系统。 此外,当利润总额达到CloseProfit(所有头寸关闭时的存款货币价值)时,EA将关闭交易。
对于交易,选择具有高相关性的货币,例如: 欧元兑美元-英镑兑美元 AUDUSD-NZDUSD USDCHF-USDCAD
在参数中有一个点 仪表_2 这是第二种货币对的名称。 第一种仪器是安装了EA的仪器。 如果您将Instrument_2留空并将EA设置为上述对中的一个,则EA将确定第二个工具本身。 如果您需要其他选项,您可以在Instrument_2中编写任何仪器名称。 您可以使用其他选项,如金银或石油和天然气或国有企业的股份。 最主要的是,他们有一个高比例的相关性。 EA不使用指标。 它分析了在给定区域内的工具(在我们的例子中是货币对)的分歧。 选项BarsWind是蜡烛上的货币差异分

该脚本的设计使交易者可以确定交易交易的平均持续时间,在此期间可能的利润和损失的比率将是最佳的。 首先,让我们看一下确定贸易交易最佳持续时间的一般方法。我们介绍以下变量: R - 交易的结果; T - 交易开放的时间; W - 上一笔交易结束与下一交易开盘之间的时间。 每个交易者都努力在最短的时间内获得最大的利润。这种愿望可以通过以下简单表达来描述: R/(T+W)→max 。 很明显,变量 T 和 W 取决于交易的总持续时间和交易数量。设 ATD 是交易的平均持续时间, N 是交易总数。然后,交易的平均持续时间应与其总数的平方根成比例增长,即: ATD~√N 。 但是,有一些有根据的问题出现 - 任何交易持续时间等同于其他交易持续时间,交易持续时间如何影响交易操作的结果?为了得到所提问题的答案,我们将对历史数据的价格行为进行一项小型研究。 我们继续如下。我们将历史数据划分为由一定数量的柱组成的系列,对应于交易的平均持续时间。在每个这样的系列中,我们计算最大价格变动,我们将引用更大的偏差 StopLoss ,并且更小 - 到 TakeProfit 。 之后,我们将计
FREE

让我们看一下外汇市场价格变化的本质,而不是关注这些变化发生的原因。这种方法将使我们能够确定影响价格变动的主要因素。 例如,让我们看一下欧元兑美元货币对和H1时间框架的开盘价。对于这些价格,我们构建了Lameray图(图1)。 在该图中,可以看出价格变动基本上根据线性方程发生。要确定此等式的参数,可以使用最小二乘法。在这个特定的例子中,改变开盘价的等式采用以下形式: Open [i] = 0.99989 * Open [i + 1] +0.00013。 让我们来看看这个等式如何充分描述价格变动。为此,我们删除线性分量并分析残差(图2)。 从图中可以清楚地看出,这些残留物相当混乱,如果我们将它们视为噪声,我们可以得到一个相当简单的系统来预测下一个柱的开盘价,这是以该指标的形式实现的。

UPDATE MAR/20 OBS: Please after purchase contact US via CHAT to suport. This Product is a Market Scanner based on Didi Index Indicator. He can scan all time frames of Symbols in Market Watch, client can customize according the demand, its can scan a single symbol or more than 100.
Manual: Link Driver Link do Manual Video: LINK The Scanner informs 4 kind of signals, all alerts are providing from Didi Index Indicator:
1 - Didi Index - Alert of Buy : Cross up of "Curta" short moving averag

Analysis and management of a large number of open positions . Cumulative take, stop, trailing stop and many other closing scenarios.
The Expert Advisor runs on any pair and sees all open positions on all pairs. Analyzing profit and other parameters can close all positions or selective ones following the settings.
It can work with all open positions as well as take into account Magic, a trading pair or a direction - LONG or SHORT.
DOES NOT OPEN POSITION himself, only in the strategy tes

BeST_Trend Exploiter is a Metatrader Indicator based on a smart proprietary algorithm which can detect the market Median Trend while it filters out the noise providing Buy and Sell Signals and also wherever it is applicable it provides us with TP Levels of High Probability. Additionally as it has Built Inside all the necessary features it can be used as a Complete Strategy of very Impressive Results. Essential Advantages of the Indicator
Clear and Easily Understandable trading rules. Real

PLEASE MAKE SURE TO GO THROUGH THE UDEMY COURSE TO UNDERSTAND THE FUNCTIONALITY OF THIS EA (COMING SOON)
UTOPIA - THE ALL IN ONE EXPERT ADVISER
Utopia is all in one Expert Adviser and gives the trader multiple options to trade. There are thousands of options you can trade with this EA.
- Custom Manual Trading
- Multiple Time frame entries
- Multiple Currencies Trading
- Hedging in multiple currencies option
- Trend Trading option
- Basket of Grid Option
- Averaging Option
- Ma

If you trade Forex, having detailed information about the currency strength and currency pairs correlation can take your trading to new heights. The correlation will help to cut your risk in half, and strength analysis will help to maximize the profits. This indicator provides a hybrid approach for selecting the most appropriate currency pairs using the strength analysis and currency pairs correlation.
How to use the Currency Strength Analysis
Suppose your trading strategy provides a buying o

this is an indicator to clarify seeing Low and High in the market and is very useful for facilitating those who are studying technical price action
this is a type of indicator that gives color to the candlestick where the indicator is divided into 3 colors red = bearish green = Bullish
Gray = base
this indicator can be used on the forex market or the mt5 binary market. https://t.me/SBA_FOREX_SIGNAL
MetaTrader市场提供了一个方便,安全的购买MetaTrader平台应用程序的场所。直接从您的程序端免费下载EA交易和指标的试用版在测试策略中进行测试。
在不同模式下测试应用程序来监视性能和为您想要使用MQL5.community支付系统的产品进行付款。
您错过了交易机会:
- 免费交易应用程序
- 8,000+信号可供复制
- 探索金融市场的经济新闻
注册
登录