适用于MetaTrader 5的新EA交易和指标 - 132

Breakout based strategy, generates market entry signals when the price crosses a border of a certain price range. To create the strategy, we have used the history data with 99,9% quality for the last 15 years. The best signals had been selected and the false signals have been filtered out. The Expert Advisor performs technical analysis and considers only the breakouts that show the best result.
It uses a system of filtering false signals. The EA uses adaptive trailing stop. The EA uses a v

The BodySizeHistogram analytical indicator is designed to monitor the actual movement of the exchange rate on the body of the candle. The candle body is a universal tool for analyzing the price chart without using indicators that use mathematical formulas. In my view, the body of the candle is almost all that is needed to understand what is happening with the price. This indicator displays the histogram of the bodies of the candles in the points. The higher the histogram, the larger the candle b

The DuettoFXTompson indicator is designed to work with two instruments that have a high level of correlation. the indicator can be used for pair trading on currencies, stocks, and other financial instruments. The indicator shows the moment when the instruments diverge and the sum of the two instruments (yellow line). additionally, the parameter of the Average MA value is calculated.
Recommended timeframe for M5 operation. Contacts for communication 777basil@mail.ru we will prepare an expert, a
FREE

Excellent dashboard for analytics. The panel helps to analyze the values of the Parabolic SAR indicator and its signals.
With this panel you can: watch the current signal from Parabolic SAR on all timeframes; watch the current signal from Parabolic SAR for different symbols; watch the current Parabolic SAR value; several types of signals for analytics.
Values in a table cell: value of Parabolic SAR
Signal type: Parabolic SAR crosses Price Parabolic SAR upper/lower Price
Work

This indicator is an extended implementation of Weis waves. It builds Weis waves on absolute volumes (which is the classical approach) or delta of volumes (unique feature) using different methods of wave formation and visualization. It works with real volumes, if available, or with tick volumes otherwise, but also provides an option to use so called "true volume surrogates", as an artificial substitution for missing real volumes (for example, for Forex symbols), which was introduced in correspo

This is a non-parametric ZigZag providing 4 different methods of calculation. Upward edge continues on new bars while their `highs` are above highest `low` among previous bars, downward edge continues on next bars while their `lows` are below lowest `high` among previous; Gann swing: upward edge continues while `highs` and `lows` are higher than on the left adjacent bar, downward edge continues while `highs` and `lows` are lower than on the left adjacent bar. Inside bars (with lower `high` and
FREE

PROMO: ONLY 10 LEFT AT $90!
Next price: $199 Price will be kept high to limit number of users for this strategy.
This EA starts trading at the open of London (UK) Session . It is based on analysis of advanced statistical distributions combined with short to medium term reversal patterns which have mean-reversion attributes. The EA includes several smart features and allows you to trade with a fixed or automatic lot size. The EA is not sensitive to spreads but can be backtested on bo

No Demand No Supply This indicator identifies No Demand –No Supply candles to your chart and plots volume bars colored according to the signal. It can be applied to all timeframes or to a specific one only. It can also be used as regular volume indicator with exceptional future of WEIGHTED VOLUME. Furthermore is has an alert notification, sound and email when a signals occurs. The indicator does not repaint but the alert will come on two candles back due to the definition of No Demand No S

Buy and sell signals based on the Wave Setup strategy for entering a trade on the pullback after a reversal.
How does the indicator work? The indicator activates the buy and sell signal when their respective conditions are met. For an uptrend, we need a reversal up on the EMA9 followed by prices above the ascending SMA21 making a pullback and a touch on it. For a downtrend, we need a reversal down on the EMA9 followed by prices below the descending SMA21 making a pullback and a touch on it.

Indicator of the colour display of the zones of buyers and sellers in the bar with a change of colour as the volume increases.
From bar maximum to bar closing - this is the sellers' zone.
From bar closing to bar minimum - this is the buyers area.
As the bar volume increases in comparison to the previous bar, the respective zones are coloured in a different colour.
Input parameters volumes (tick or real)

Max ScalperSpeed MT5 is a fully automated expert advisor. This system has been developed to improve the efficiency of generating more returns. Rely on scalping trading strategies and recovery strategies with appropriate trading frequencies, and also able to work well in all market conditions, whether trend or sideways, able to trade full time in all conditions. Enable or disable news filtering according to user needs. Added a proportional lot size adjustment function, where users can choose t
Features
An amazing scalper created for EURUSD 5 min time frame, with very low risk and high reward at the same time. After more than 500h of optimization I am glad to present you this EA . It was made in mind for IC markets MQL5 platform, an adapted for their data, but I suppose it must works on other brookers as well. I will also publish soon the MT4 version for IC markets as well. Link to 1 min scalper https://www.mql5.com/en/market/product/54413
Description
Strategy is made from ADX tog

Общие сведения Советник определяет наиболее вероятные места движения графика и открывает ордера на Buy или Sell. Не использует высокорискованные стратегии, такие как Мартингейл. Ордера закрываются по наиболее возможному профиту или небольшой потерей. Что имитирует Take Profit и Stop Loss. Мультивалютный.
Важно перед запуском прочитать! Для запуска советника достаточно запустить его на одном единственном графике например EURUSD. Во вкладке "Обзор рынка" в идеале отобразить все символы для
Indicator summary Индикатор информационная панель отображает значения и торговые действия, а так же выводит сводную информацию о торговых действиях, основанных на 11 встроенных индикаторах. Встроенные индикаторы:
RSI (Relative Strength Index )- пересечение зоны перекупленности сверху вниз - сигнал на продажу. Пересечение зоны перепроданности снизу вверх - сигнал на покупку. При колебаниях в зоне между перекупленостью и перепроданостью сигнал формируется в зависимости от нахождения значения о

The Make me Money EA is an MQL5 Expert advisor that allows you to enjoy your free time while it trades on your behalf, generating profits for you. If you have limited capital, don't worry. With the Make me Money EA, you can start earning profits from as little as $100. As shown in the attached screenshot, with a starting capital of just $100, you can earn a profit of $221 in the first 6 months of 2020, trading with a minimum volume of 0.01 lots. Moreover, profits more than doubled during the vo
Features
An amazing scalper created for EURUSD 1 min time frame. Compared to the 5 min version https://www.mql5.com/en/market/product/54412#!tab=overview , this one is a higher risk/ reward . Just like the 5 min version, this one needed more than 500h of optimization . It was made in mind for IC markets MQL5 platform, an adapted for their data, but I suppose it must works on other brookers as well. I will also publish soon the MT4 version for IC markets as well.
Description
Strategy is made

FOREX 顧問 HERO 使用網格策略(根據趨勢運動開倉)和金字塔(根據趨勢開倉)。 EA 僅適用於市價訂單。第一筆交易的開倉發生在指定時間內的極值崩潰時,其中集中了 N 個限價訂單(價格已多次測試該水平)。如果價格突破水平但 N 品脫在 N 秒內沒有通過,則該信號被認為是錯誤的。
MT4 版本 - https://www.mql5.com/en/market/product/52194
它具有方便的資金管理、每個 N 餘額的初始手數以及網格和訂單金字塔的乘數。圖形顯示信息,易於配置和優化。
工作時間框架在 EA 參數中設置,默認為 H1,EURUSD 符號。以下貨幣對適合顧問:GBPUSD、USDCAD、EURUSD、USDJPY、USDCHF、AUDUSD、NZDUSD ...
選項:
TIMEFRAME - 工作時間框架; EXTREMUM_BARS, SHIFT - 搜索極值和移動的柱數; MAX_RANGE - 最大價格範圍; MIN_BARS_IN_RANGE - 範圍內高/低的最小數量; MIN_DISTANCE, TIMER_SEC - 以秒為單

指标VolumeTick用于快速识别可能的反转点, https://youtu.be/tmHZKdMCMGo
当合并和双向交易交易者的条件下,市场上的交易量数量急剧增加,这显示了参与者改变工具市场运动方向的兴趣,并 通过这种方式,我们可以预见停止交易或交易在另一个方向,或增加交易量时,确认的举动是在我们的方向。 它可以在任何时间段使用,将是任何成熟的交易系统的一个很好的补充。
通讯联系人777basil@mail.ru 我们将为您的任务准备一个专家,一个指标。
Indicator VolumeTick made for rapid identification of possible reversal points, when the conditions of consolidation and bi-directional trading traders, the number of volumes in the market increases sharply, which shows the interest of the participants to

Excellent dashboard for market analytics. The panel helps to analyze the values of the Stochastic indicator and its signals.
With this panel you can: watch the current signal from Stochastic on all timeframes; watch the current signal from Stochastic for different symbols; watch the current Stochastic value; several types of signals for analytics.
Values in a table cell: Stochastic - Main line Stochastic - SIgnal line Stochastic - Main line minus signal line
Signal type: Sto

Excellent dashboard for analytics. The panel helps to analyze the values of the Alligator indicator and its signals.
With this panel you can: watch the current signal from Alligator on all timeframes; watch the current signal from Alligator for different symbols; watch the current Alligator value; several types of signals for analytics.
Values in a table cell: Jaw Teeths Lips Jaw - Teeth Jaw - Lips Teeth - Lips
Signal type: Lips - Teeth - green line (lips) crosses red line (

The indicator is based on a proven successful strategy. It shows buys and sello signals with suggested stop and target. In the same way, it calculates the essential trading analysis statistics as successful and profit ratio. KEY LINKS: Indicator Manual – How to Install - Frequent Questions - All Products Indicator features Effective and understandable signals. It can be used as a complete trading strategy. Complete trading statistics to evaluate the indicator performance. It shows exact

Victory Price Direction I'm glad to present you my new indicator.
This indicator includes all the best strategies that I have researched. When developing and optimizing, I used ML algorithms. The indicator is very easy to use.
Now the indicator has 3 basic strategies and the ability to customize your own strategy. I am constantly looking for better strategies.
You get: A simple and effective indicator of reversals. The indicator will help you place Take Profit correctly.
Sputnik it is a Secure Automated Software for trade Forex market and indices.
The architecture is a Fully Automatic Autonomous Robot Expert capable of
Independently analyzing the market and making trading decisions
Sputnik It is an advanced trading system. This is a fully automatic Expert Advisor. Sputnik is a plug and play system Sputnik It is a 100% automatic system, The system is self-sufficient, performing all the work. You can download the demo and test it yours

The indicator plots a curve of the difference between the values of two trading instruments (currency pairs).
The purpose of the indicator is to observe the processes of divergence and convergence of the values of two trading instruments. The results obtained can be used for trading strategies of statistical arbitrage, pair trading, correlation, and others.
Trading strategy
The indicator is attached to the chart of any trading instrument. In the input parameters, the names of trading i
FREE
新機能:Ver3.5 28通貨ペアの強弱も表示するようにしました。 監視ペアで最強、最弱の通貨ペアとなった場合、四つ葉のマークが出るように変更しました。 15分足、1時間足、4時間足単位での通貨ペアの強弱を表示するようにしました。
詳細な情報はこちらにサイトがあります。 https://toushika.top/tc-cs-plus-cfd/
注:こちらはTitanのデモ口座で動作します。 XMで使用したい場合は こちらのでセットファイル を使用してください。
機能: 一目で現在の通貨の方向性と強弱が確認できます。 15M,1H,4Hでの方向性を表示します。 15M,1H,4Hでの方向が揃った場合にドットが表示されます。 通貨の相関が揃った場合にドットが表示されます。 ※相関はピアソン相関係数を使用しています。 より詳しい情報につきましてはこちらを参照してください。 https://www.mql5.com/ja/articles/5481 通貨の強弱を表示します。 現時点でのボラリティーの状況を表示します。 過去20日/過去5日/今日のボラリティーを

The previous day's vwap is used by some traders as a support and resistance point, after all it is one of the ways to consider the fair price of that asset or that pair the day before. Possible defenses can occur in this region indicating a reversal, or triggering stops starting a new, more directional movement. It is a matter of analyzing how it will add to your operational.
To avoid manually drawing the previous day's vwaps and saving time for your analysis, use the Vwap Freeze indicator,
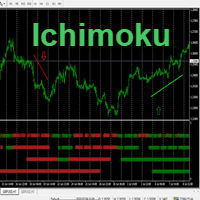
Hello This Indicator will draw Green (Up) and Red (Down) small arrows from Multi TimeFrames based in ( Ichimoku ) to help you to take decision to buy or sell or waiting If there 4 green arrows in same vertical line that's mean (Up) and If there 4 Red arrows in same vertical line that's mean (Down) and the options contain (Alert and Mobile , Mail Notifications). Please watch our video for more details https://youtu.be/MVzDbFYPw1M and these is EA for it https://www.mql5.com/en/market/product/590

SR Breakup Indicator it is an indicator based on support and resistance . It makes price breakout levels visible by opening the trader's mind to spot market opportunities.
Attention!!! This Indicator can be used in any time frame.
Suggestion of use Wait until the support and resistance lines are horizontal and closer. Do Trade (BUY): if price breakout resistance level (outside line). Do Trade (SELL): if price breakout support level (outside line). Use internal lines as Sto

WT Vwap 5 Bands
The WT Vwap Bands indicator is an indicator that combines price and volume, helping to show whether the price is within the "fair price", overbought or oversold.
The indicator code was designed for performance and has already been tested in a real trading account.
In addition to the visual inputs (color, thickness and line style), the user can define a% value that depends on the price.
The default values work with the most distant band at 1% of the price and then di

To calculate strength of currencies and to show in table There is 1 parameter: . Show recommended pairs: true/false -> To show top 1 of strong and weak currency Tips to trade: . To trade only with strongest vs weakest currency . When H1, M30, M15, M5 of specific currency is up or down -> consider to open BUY/SELL . It can combine: + strongest currency vs weakest currency + strongest currency vs 2nd weakest currency + 2nd strongest currency vs weakest currency
FREE

It is the very same classic Stochastic indicator, but with a little twist: NO NAME and data is shown in the sub window. It could be stupid, BUT, if you are running out of space in Micro windows like Mini Charts, where the indicator's name is totally useless, you came to the right place. And that's it! I know it seems stupid but I needed the classical version of Stochastic indicator without that annoying name on my Mini Chart, so I did it that way... The original formula is right from Metaquote's
FREE

this is a multi-functional orders all closing script
MT4 version
Feature: 1, it can close all orders of the chart symbol or all symbols. (select mode) 2, it can close all orders of buy, sell or both type. 3, it can close all orders of profit, loss, or any. 4, you can specify magic number, order comment as filters for the order closing operation. 5, it can also do partial closing by percentage to all orders.
it's strongly recommended to set a "hotkey" to this script when you use it. wish
FREE
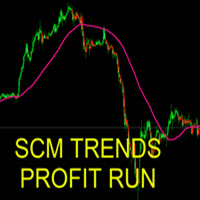
The indicator can be used in several ways. The simplest is to buy when the SCM Trends Profit Run line is painted green and sell when it is red. This indicator that allows you to detect several changes and dynamics in price that many traders can’t estimate or see without an indicator, which highlights its essence and usage.
Accordingly, traders can draw conclusions and make estimates about how the prices will change based on the information they have and then they can modify their strategy fo

The safest Martin EA实际表现可见信号 https://www.mql5.com/zh/signals/814986 The safest Martin 是一个多货币 EA,采用马丁策略,以其自有的波段算法为基础,并配以控仓技巧。只有价格到达关键位后EA才会发生交易。 The safest Martin 使用即时交易 4种货币对:EURUSD、AUDNZD、NZDUSD、USDCAD,GBPCAD。算法信号通过十年数据跑测验证,可以实现平稳盈利。 EA 在所有时间框架上都有效,不会丧失其盈利能力。然而,在 H4上观察到了最大效率。在此周期上的风险/盈利比最好。 建议使用账户余额在美元 10000 以上,且每一万美金的仓Lots建议0.01开始。
Lots 是选择固定手数后的具体数值。 H01Symbol--H05Symbol 是参与操作的7个货币对。请根据交易商特有商品表示对应改动。货币对后缀添加。

The Trend Quality Indicator (by David Sepiashvili) is intended to measure trend activity. Some benchmarks can be used to determine the strength of a trend.
In the range of values from -1 to +1 ( Ignored zone parameter) , the trend is buried beneath noise. It is preferable to stay out of this zone.
The greater the value, the less the risk of trading with a trend, and the more reliable the trading opportunity.
The range from +1 to +2, or from -1 to -2, may be treated as zone of weak tr

支撑和阻力筛选器是 MetaTrader 的一个级别指标,它在一个指标内提供多种工具。 可用的工具有: 1. 市场结构筛选器。 2. 看涨回调区。 3. 看跌回调区。 4.每日枢轴点 5.每周枢轴点 6. 每月枢轴点 7. 基于谐波形态和成交量的强大支撑和阻力。 8. 银行级区域。 限时优惠:HV 支撑和阻力指示器仅售 50 美元且终生可用。 (原价 125$)
通过访问我们的 MQL5 博客,您可以找到我们所有带有分析示例的高级指标: 单击此处
主要特点
基于谐波和音量算法的强大支撑和阻力区域。 基于谐波和成交量算法的看涨和看跌回调区域。 市场结构筛选器 每日、每周和每月的枢轴点。
文档
所有支持和阻力筛选器文档(说明)和策略详细信息均可在我们 MQL5 博客的这篇文章中找到: 单击此处。
接触 如果您有任何问题或需要帮助,请通过私信联系我。
作者
SAYADI ACHREF,金融科技软件工程师,Finansya 创始人。

Trend Power Indicator is an indicator which helps to identify trend direction and its power by using moving averages ZigZag pattern and correlations of tradable instruments. It provides trend power data with user-friendly interface which can be read easily and fast. This indicator by default is configured for trading of Adam Khoo's ( Piranhaprofit ) strategies. It saves mass of time for searching of tradable pairs by his strategies. It indicates when all required moving averages are align

This is an advanced multi-timeframe version of the popular Hull Moving Average (HMA) Features Two lines of the Hull indicator of different timeframes on the same chart. The HMA line of the higher timeframe defines the trend, and the HMA line of the current timeframe defines the short-term price movements. A graphical panel with HMA indicator data from all timeframes at the same time . If the HMA switched its direction on any timeframe, the panel displays a question or exclamation mark with a tex

当价格不利于您时,这种成本平均专家顾问 (EA) 会在与原始(手动打开)订单相同的方向上进行额外交易。它可以用作网格系统或纯鞅系统(批量的指数增加)或平滑的鞅(例如批量的线性增加)。由于所涉及的风险,此 EA 更适合中级到高级交易者,他们非常了解如何处理风险管理和交易已经盈利的策略或 EA。 EA 可以管理任何手动交易或由另一个“EA 交易”针对已加载该 EA 的代码进行的交易。 特征
当平均向下(网格)订单应该被打开时,有许多选项可供选择。 可以打开锁定(对冲)订单以固定浮动损失。 有关订单篮实际状态的信息显示在图表的左上角。 EA 符合 NFA FIFO 规定。仅当锁定(对冲)订单被禁用时,EA 才能与美国经纪商账户一起使用。 输入参数
请在此处 找到输入参数的说明和解释。 重要的
强烈建议在模拟账户上测试这个 EA 一周,以清楚地了解它在不同设置下的表现。 EA 不能用于净额账户类型。

Graph configuration and buy and sell signals based on Stormer's (Alexandre Wolwacz, Brazilian trader) swing, position and day trade strategy, described on his youtube channel (https://www.youtube.com/watch?v= 0QZ_NjWkwl0)
The buy and sell indications are based on 2 candle patterns ( Inside Bar [Yellow] and Reversal Closing Price [Blue and Red] ), 3 Moving Averages and 1 Stochastic .
Indicators: Inside Bar - Candle pattern indicating trend continuity, or reversal Reversal Closing Price - Ca
FREE

O Indicador CoioteChart foi construído pra facilitar desde a leitura de contexto de mercado até a micro estrutura do candle, facilitando ajustes operacionais e tomadas e decisão com alta eficácia.
Possui um controle para habilitar e desabilitar a visualização das pocs, vwap, zonas de máxima e mínima negociação, pode ser utilizado data sources de tempos gráficos para cálculos ou utilizado os ticks de agressão do time and trades, funciona com volume real e volume de ticks.
As colorações são at

ToolBot Probabilistic Analysis - FREE An effective indicator for your negotiations
The toolbot indicator brings the calculation of candles and a probabilistic analysis so that you have more security on your own.
Also test our FREE tops and bottoms indicator: : https://www.mql5.com/pt/market/product/52385#description Also test our FREE (RSI, ATR, ADX, OBV) indicator : https://www.mql5.com/pt/market/product/53448#description
Try our EA ToolBot for free: https://www.mql
FREE
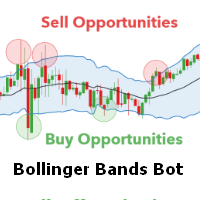
The Strategy this EA uses Bollinger Bands as indicator and Standart Deviation to determine good and safe signals; it automatically calculates Take Profit and Stop Loss based on Bollinger Bands; it is also provided with Trailing Stop Loss and Trailing Take Profit; it has a pannel to keep you informed about the EA's activities. Short Positions Inputs Lots volume for Short Positions; Trailing take profit for Short Positions; Trailing stop loss for Short Positions; Maximum number of simultaneous Sho

VolumeDeltaScanner is a volume delta monitor for multiple (up to 10) time scopes. It works by online ticks or history ticks. Indicator monitors tick volumes for buys and sells separately, and find their delta on every bar and larger scopes, then displays the volume deltas for all the scopes. Every scope is presented by its own buffer/line. The smallest scope is the current timeframe. It's required. All other scopes should be multiples of it. For example, if placed on a M5 chart, it can calculat
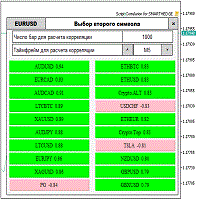
Script for quickly selecting a tool with high correlation. The script is placed on the tool to which you need to select the second correlating one. Then you can change the number of bars to calculate and the timeframe. The script iterates through all available symbols in the market overview and returns the 20 most correlated ones. You can use the selected pairs to trade with THE new SH expert Advisor
FREE

Moving average indicator to work with the F12 Replay simulation and replay tool.
In this way, the F12 Replay tool now supports the moving average indicator.
F12 Replay: https://www.mql5.com/pt/market/product/38313
This is a product developed by Renato Fiche Junior and available to all MetaTrader 5 users!
Partners: "Águia Traders" team ( Eagle Traders ) by Larissa Sihle #aguiatraders #larissasihle
Input Parameters
Period Shift Method
FREE

It is a Graphical and Trend indicator that brings several advantages. Eliminates noise.
Facilitates the identification of the trends. Can be used as directional force indicator. Identify lateralization: candles with close and open price closer. Identifies high volatility: candles with shadows larger than the body. Attention!!! Works on any asset and any time frame.
Easy setup Symbol: anyone Time frame: anyone Parameters: Indicator Period Recommended Period : betw

Tick channel scalper for flat markets or for markets with frequent pullbacks. The robot is set to EURAUD. Brokers with minimal spreads and commissions are recommended. For example Rannforex.com or ICMarkets.com The EA has a unique algorithm that works on ticks and does not depend on the timeframe. Opening hours are configurable. Trading is possible both at any time period and around the clock.
File for optimisations and test on Tester include in my blog - https://www.mql5.com/ru/blogs/post/

The indicator identifies two most important patterns of technical analysis - Pin Bar and Engulfing. MT4-version: https://www.mql5.com/en/market/product/53591 Settings: Mincandle size for PinBar - The minimum size of the Pin-Bar candlestick; Percentage of candle body on size - The percentage of the candle body in relation to its length; PinBar Alert - Alert when a Pin-Bar is detected; PinBar Mail - Sends an email when a Pin Bar is found; PinBar Notification - Sends a push notificati

This Indicator is based on the high's moving average and the low's moving average for trend following and/or trailing stops.
How does the indicator work? The indicator plots the uptrend dots until there is a close below the moving average of the lows. When this happens, a downtrend begins and is plotted until there is a close above the moving average of the highs. When this happens, another uptrend begins. And so it goes.
How to use it? - Trend following: You can use it as buy signals when

Do you already know Display N Bars?
Do you already know the Start tool (from Midas indicators)?
In this indicator, we unified the two tools, allowing you to define which candle will start counting, or use the automatic numbering that was already available in the previous version.
Description of the utility follows:
Display N Bars
The Display N Bars utility is a simple tool that aims to help identify candles.
If a trader tries to share the knowledge with a colleague but it i
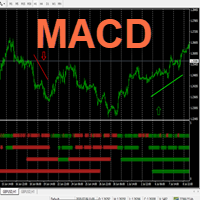
Hello This Indicator will draw Green (Up) and Red (Down) small arrows from Multi TimeFrames based in ( MACD ) to help you to take decision to buy or sell or waiting If there 4 green arrows in same vertical line that's mean (Up) and If there 4 Red arrows in same vertical line that's mean (Down) and the options contain (Alert , Mobile and Mail Notifications). Please watch our video for more details https://youtu.be/MVzDbFYPw1M and these is EA for it https://www.mql5.com/en/market/product/59092 G

This expert advisor joins 18 strategies on crosses and changes, each of them identify a gap on specific custom sessions and try to close the gap. All the parameters are in the code so you can select only the size used for each strategies the base magic number: the real magic numbers used strating from base+1 to base+18. You can specify also the "Suffix" parameters, a special char following the name of the cross in some brokers (eg: EURUSD. EURUSD# EURUSDm) You can also activate/deactivate eve
FREE
Trade with your MT5 Account on a custom API-Endpoint.
1. Activate API on your Signal Site.
2. Enter your Username.
3. Enter your Account-Password.
4. Enter the API-Endpoint URL to your MT5 Account (Extras -> Options -> Experts -> Allow WebRequest).
Lot Size Settings
Auto Lot = 0 and Fixed Lot = 0 : Copy Lot Size.
Auto Lot : Option to send normalized Lot-Size depends from Free Margin on Trading-Account. Because other Traders will start with different Account Size.
For Example:

Candle de Volume Coiote O Candle de Volume Coiote é um indicador que mede a variação do volume no tempo, seu corpo é pela variação do volume anterior pelo volume atual, sua direção pelo fechamento do preço.
1. identificado um topo no indicador Candle de Volume Coiote (marcado o fechamento do preço).
2. identificado um fundo no indicador Candle de Volume Coiote (marcado o fechamento do preço).
3. fundo 3 igual fundo 2 no indicador Candle de Volume Coiote, preço no 3 é diferente de fundo 2

Candle com coloração de Volume Price Analysis (VPA) segundo as definições da Anna Coulling, é possível configurar períodos de climax e rising, fator de extreme e fator de rising.
Pode-se usar volume real ou volume de ticks. O VPA considera a variação de preço por volume do período, indicando se um movimento está recebendo ignição, está em seu climax ou se já não existe mais interesse.
TrendFollowMT is a fully automated trading system which is using large time frame to determine the trend and use small time frame to find the entry point. Once the trend changed to opposite side, the system will wait for another entry point to recover with bigger lot size. Moreover, the target profit will be moved up when more position had been opened. The aim is to cover the cost of waiting time and risk.
Free version will only trade on buy signal and locked the initial Lot size (0.01). Paid
FREE

Indicador que cria um painel para acompanhamento to total de posições abertas no ativo do gráfivo.
São apresentados os dados: Ativo do gráfico Total de posições de venda em aberto Quantidade do volume de posições de venda em aberto Total de posições de compra em aberto Quantidade do volume de posições de compra em aberto.
Painel simples mas eficiente para o equilíbrio das ordens
FREE
TrendFollowMT is a fully automated trading system which is using large time frame to determine the trend and use small time frame to find the entry point. Once the trend changed to opposite side, the system will wait for another entry point to recover with bigger lot size. Moreover, the target profit will be moved up when more position had been opened. The aim is to cover the cost of waiting time and risk.
Trend filter: ADX and zzFibo (suggest time frame: H4) Entry: RSI and Pin bar (use curren
EA finds the largest volume in the market and determines the level for entry. After crossing the level towards the breakdown, a market order is opened. The EA builds a two-sided grid of orders, adapting to the market. Each direction of orders works separately and has its own take-profit. Thus, the adviser covers the whole trend, starting from its start, while the adviser perfectly passes the flat market condition, trading both directions. Please see all my products: https://www.mql5.com/en/user
FREE
你好!.
CatchCandleLimitOrderOneSymbol-flat expert Advisor,用于从通道边界到中心开仓订单,从自定义通道宽度指标TMA开始回调支撑和阻力水平,具有固定的S/L和T/P。总是更好地等待最佳偏差,然后用订单buylimit进入市场;selllimit,以及我认为我们已经 创建 了一个专家,跟踪价格的整体运动定义了从总趋势回报的入口点。
盈亏平衡水平被使用-交易的实际部分的概念,当交易者达到一定的利润水平时,开仓位置的止损被转移到合同的开仓价格,从而使得在任何情况下都可以在没有损失的情况下平仓。
M5操作的推荐时间表。 通讯联系人777basil@mail.ru 我们将为您的任务准备一个专家,一个指标。 https://youtu.be/WBoduCjpJCM

速度略有变化。 测试人员需要一个新的顾问,谁有兴趣,写信给我通过电子邮件777basil@mail.ru
该指标基于历史价格变化计算,并以数学方式计算,每次再次接收数据时重新计算。 它可以在不同的时间框架上使用。 从70%的指标边界来看,价格运动或整合方向发生变化。 通过这种方式,您可以在趋势和通道中间从其边界进行交易。 最好在趋势交易中使用它来确定阻力位/支撑位。 在视频中,您可以看到指标是如何工作的: https://youtu.be/UG2ZZEH9B_U 通讯联系人 777basil@mail.ru 我们将为您的任务准备一个专家,一个指标。
该指标基于历史价格变化计算,并以数学方式计算,每次再次接收数据时重新计算。 它可以在不同的时间框架上使用。 从70%的指标边界来看,价格运动或整合方向发生变化。 通过这种方式,您可以在趋势和通道中间从其边界进行交易。 最好在趋势交易中使用它来确定阻力位/支撑位。 在视频中,您可以看到指标是如何工作的: https://youtu.be/0hRltsRNmPE
FREE
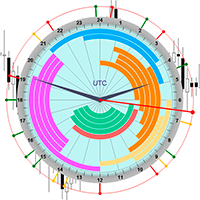
The professional browser of News and Trading Sessions is now available in MetaTrader 5.
Now all the most important market information is collected on one dial!
News located on the Time scale. Planning your working time has never been so easy and convenient ... The news scale can be switched a day, two, a week, a month forward or backward (see the details in the short video). All news updates in real time.
Thanks to the built-in filters, you can configure the display of news by importanc

该指标是基于指标内置的标准指标,该指标考虑到当前指标30个指标 并给出买入或卖出的信号,其他指标的所有趋势的总趋势。 在输入参数中,您可以为每个指标配置特殊参数。 该指标以振荡器的形式执行,并显示所有指标在一个或另一个方向的总趋势和优势。
该指标是基于指标内置的标准指标,该指标考虑到当前指标30个指标 并给出买入或卖出的信号,其他指标的所有趋势的总趋势。 在输入参数中,您可以为每个指标配置特殊参数。 该指标以振荡器的形式执行,并显示所有指标在一个或另一个方向的总趋势和优势。 并显示所有指标在一个或另一个方向的总趋势和优势 。 并显示所有指标在一个或另一个方向的总趋势和优势 。 并显示所有指标在一个或另一个方向的总趋势和优势 。 。 https://youtu.be/UG2ZZEH9B_U
FREE
MT4: https://www.mql5.com/en/market/product/52715
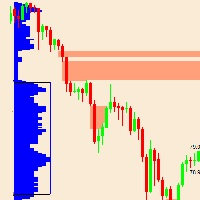
该指标基于市场概况理论。 单打区到底是什么? 理论:市场概况单打: 轮廓的单张或单张打印或间隙放置在轮廓结构的内部,而不是上边缘或下边缘。 它们以在市场资料上打印的单个TPO表示。 单身人士将我们的注意力吸引到价格快速波动(冲动)的地方。它们使低交易量的节点留有流动性缺口,从而导致市场失衡,并向我们展示了失衡的区域。通常,当市场对意外消息做出反应时,会创建单个。这些报告能够引起极端的失衡,并为买方和卖方的极端情绪反应做好准备。 市场将希望重新访问该区域,并检查这些价格水平是否不是对以这些价格进行交易感兴趣的交易者。这些商人为什么要在那里?因为市场从字面上飞过该地区,只有少数交易者有机会在该地区进行交易。为此,将来可能会填补这些领域。 这些低效的举动往往会被填补,一旦它们被填补,我们就可以寻找交易机会,或者我们也可以在它们被填补之前进入,并使用这些单张图作为目标。 用作支撑/阻力区域,但并非总是要小心。通常,它在趋势日表现良好。请参阅市场概况日:趋势日(策略1-买入-第三张图)和具有

This Expert advisor is advanced with Force indicator which detects the momentum change and cuts the position by using its intelligence Where it generates revenue in long term .User can change the lot size based on risk calculation which provided by our team .It differs from other EA where this suits for long term usability with decent returns ,This has to be run on EURUSD 1 hr time frame ,Minimum recommended capital is 500 dollar ,still clients can operate in low capital by changing the lot size

Excellent dashboard for market analytics. The panel helps to analyze the values of the Ichimoku indicator and its signals.
With this panel you can: watch the current signal from Ichimoku on all timeframes; watch the current signal from Ichimoku for different symbols; watch the current Ichimoku value; several types of signals for analytics.
Values in a table cell:
Value of Tenkan-Sen Value of Kijun-Sen Value of Senkou Span A Value of Senkou Span B Value of Chikou Span S


Excellent dashboard for market analytics. The panel helps to analyze the values of the RSI indicator and its signals.
With this panel you can: watch the current signal from RSI on all timeframes; watch the current signal from RSI by different symbols; watch the current RSI value; several types of signals for analytics.
Values in a table cell: RIS value.
Signal type: RSI crosses level buy out/level sell out (outside); RSI crosses level buy out/level sell out (inside);
RSI is u
MetaTrader市场提供了一个方便,安全的购买MetaTrader平台应用程序的场所。直接从您的程序端免费下载EA交易和指标的试用版在测试策略中进行测试。
在不同模式下测试应用程序来监视性能和为您想要使用MQL5.community支付系统的产品进行付款。
您错过了交易机会:
- 免费交易应用程序
- 8,000+信号可供复制
- 探索金融市场的经济新闻
注册
登录