适用于MetaTrader 5的新EA交易和指标 - 112
Трендовая торговая система для работы на рынке Forex на одной из десяти валютных пар - EURUSD, GBPUSD, AUDUSD, USDCAD, USDCHF, USDJPY, EURJPY, GBPJPY, AUDJPY,XAUUSD. Система может открывать одновременно до десяти позиций с использованием десяти различных, независимых друг от друга алгоритмов входа в пределах одного трендового направления с индивидуальными стопами для каждой позиции. Для каждого алгоритма предусмотрен свой магик-номер. При смене тренда все открытые позиции закрываются одновременн

Plug & Play portfolio - series of high-quality EURUSD H1 strategies for maximized success. The 4th out of 8 strategies portfolio set. Each EA works well as a standalone, works even better as portfolio. Triple tested - backtest, robustness tests , portfolio correlation. Uses a well-known CCI indicator combined with an ADX indicator.
Why to buy Fully automatic EA with really easy set-up. Only risk amount to be set and you are good to go. Developed using genetic algorithms on 'in sample' data

Plug & Play portfolio - series of high-quality EURUSD H1 strategies for maximized success. The fifth strategy from the EUR-8 portfolio uses the direction of the MACD indicator for recognizing the trend and then set the pending order according to KeltnerChannel. This fully automatic EA was Triple tested - backtest on 'Out of sample data', robustness tests and portfolio correlation. Easy set-up. You define only risk amount and you are good to go.
Learn why I do Monte Carlo, robustness and

Plug & Play portfolio - series of high-quality EURUSD H1 strategies for maximized success. The sixth strategy from the EUR-8 portfolio. Your only work here is to buy it, attach to the EURUSD on H1 , set your risk and wait for results. This fully automatic EA was Triple tested - backtest on 'Out of sample data', robustness tests , portfolio correlation. No tunned backtest or over-fitted strategy. This is professionaly developed EA.
Benefits for you Amazing Plug & Play system - studyi

Plug & Play portfolio - series of high-quality EURUSD H1 strategies for maximized success. The eighth strategy, the last one from the EUR-8 portfolio , uses BollingerBands mean reversal method for setting up the pending order. To have a whole portfolio of strategies, which trades for you is incredibly efficient, don't miss that opportunity. Check my other strategies today! and assemble your portfolio.
Benefits for you Plug & Play system , designed to have simple initial setup . That's saved
MT5 trend indicator works without redrawing. Provides signals for entering trades, works on charts of any instrument. Трендовый индикатор МТ5, работает без перерисовки. Выдает сигналы для входа в сделки, работает на графиках любого инструмента. Input parameters are for styling and messages only. / Входные параметры только для оформления и сообщений. All original signal calculations do not need additional parameters. / Все оригинальные расчеты сигнала, не нуждаются в дополнительных параметрах.
In order to detect "Big activity", new elements of the VWAP standard indicator were incorporated into this project.
In short, the plotted lines represent the moving average with EMA[VWAP]=VWAP[EMA].
Averages of the prices have been combined with volumetric weights and exponential decay.
Also, it was included the same weights to compute the standard deviation.
The parameter called as "strain" is a linear constant shifting the result (strain)xSD(VWAP).
So, a any set of bands can be plotted.
An indicator of patterns #39 and #40 ("Rounding Tops" and "Rounding Bottoms") from Encyclopedia of Chart Patterns by Thomas N. Bulkowski. Parameters: Alerts - show alert when an arrow appears Push - send a push notification when an arrow appears (requires configuration in the terminal) PeriodBars - indicator period K - an additional parameter that influences the accuracy of pattern shape recognition. Changes from 0 to 1 ArrowType - a symbol from 1 to 17 ArrowVShift - vertical shift of arrows
An indicator of patterns #11 and #12 ("Diamond Tops" and "Diamond Bottoms") from Encyclopedia of Chart Patterns by Thomas N. Bulkowski. Parameters: Alerts - show alert when an arrow appears Push - send a push notification when an arrow appears (requires configuration in the terminal) PeriodBars - indicator period K - an additional parameter that influences the accuracy of pattern shape recognition ArrowType - a symbol from 1 to 17 ArrowVShift - vertical shift of arrows in pixels ShowLevels - s
An indicator of patterns #37 and #38 ("Rectangle Tops" and "Rectangle Bottoms") from Encyclopedia of Chart Patterns by Thomas N. Bulkowski. Parameters: Alerts - show alert when an arrow appears Push - send a push notification when an arrow appears (requires configuration in the terminal) PeriodBars - indicator period VertexCount - the number of tops and bottoms: 2, 3, 4. ArrowType - a symbol from 1 to 17 ArrowVShift - vertical shift of arrows in piхels ShowLevels - show levels ColUp - colo
An indicator of patterns #7 and #8 ("Bump-and-Run" and "Bump-and-Run Reversal") from Encyclopedia of Chart Patterns by Thomas N. Bulkowski. Parameters: Alerts - show alert when an arrow appears Push - send a push notification when an arrow appears (requires configuration in the terminal) PeriodBars - indicator period K - an additional parameter that influences the accuracy of pattern shape recognition ArrowType - Character: from 1 to 17 ArrowVShift - vertical shift of arrows in pixels ShowL

You can think of these indicators as moving pivot points. MasterChartsTrading Price Action Indicators show good price levels to enter or exit a trade. The Blue indicator line serves as a Bullish Trend setter. If your instrument closes above the Blue line, we think about going Long (buying). When your trading instrument closes below the Red line, we think about Shorting (selling). It is very easy to read price action if you have a reference point. These support/resistance lines are there to help

This indicator displays fractal symbols and bars Use this indicator to show different symbols for bearish and bullish fractals: Choose from 144 symbols (refer to table below) Colors, size and offset of fractals can be modified Fractal price bar or candle color can be changed Hide fractals and show fractal price bar only Frequency in fractal calculation can be changed
How to use 1. Select which symbols to use for bearish and bullish fractals; 2. Select which colors to use for bearish and bulli
FREE

O Leopard BB é um expert advisor baseado em bandas de bollinger utilizando três tempos gráficos na tomada de decisão, desta maneira ele aumenta a confiabilidade da operação. Caso a primeira entrada não dê resultado ele fará novas entradas para chegar ao lucro baseando no preço médio. Baixe a versão de demostração e comprove os excelentes resultados com esse expert advisor multimercado. Pares de forex testados: EURUSD, GBPUSD, GBPAUD, AUDUSD, EURCAD, EURGBP, GBPCHF, USDCAD, XAUUSD e BTCUSD. At
J.M.T.I
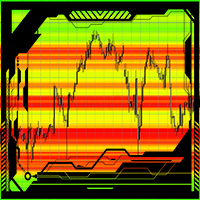
This indicator automatically shows a level or support and resistance in the currant market. Can be used on any time frame Can be used on any currency pair Works on the active bars in the window To add more bars one can simply zoom out. Red zones can be strong liquidity pools. Green zones usually is where an possible break out might occur. The higher the contrast of the colors the stronger the support or resistance levels will be. The indicator has an option to refresh on each tick

This reliable, professional trade copier system is without a doubt one of the best on the market, it is able to copy trades at very fast speeds from one master account (sender) to one or multiple slave accounts (receivers). The system works very fast and mimics the master account a full 100%. So changing stop losses, take profits, pending orders on the master account is executed on the slave accounts too, like each other action. It is a 100% full copy (unlike many other copiers who only copy ma
FREE

DYJ Tradays Economic Calendar is calendar Indicators of macroeconomic events for fundamental market analysis. Therein you will find financial news and indicators for the largest global economies – from the US and the EU to Australia and Japan, a total of 23 economies, involving more than 60 currency pairs. More than 800 macroeconomic indicators and events are collected from public sources in real time. Historical, current and forecast values, as well as importance characteristics are available

EMA Crossover Pro MT5 this EA uses two exponential moving average crossover, a slow ema, and a fast ema on which it takes buy/sell decision.
A default ema configuration is 12 and 35 where 12 is the value of slow ema, and 35 is the value of fast ema.
Expert advisor parameters:
stop loss (greater than 40, but some brokers accept stop loss under 40)
take profit (greater than 40, but some brokers accept stop loss under 40)
trailing_stop (set it as 0 for disabling trailing stop)
slow ema (21 by

This is a tool created for scalping. it can generate pending orders with 4 input: 1. Volume : Lot for the Pending Orders 2. Distance : Distance within the Orders in Points 3. Total Order : Total Generated Orders 4. Take Profit : TP for the generated Orders in Points 5. Stop Loss : SL for the generated Orders in Points It also have another tools which can monitor the floating and close at defined profit using Closed at Profit Input What's new: - Stop Loss in Pip
FREE

Exchange Chart Free The ease of observing the market anytime, anywhere
Exchange chart is the software for the professional trader to follow what happens in the financial market in real time. Developed by those in the market, it keeps up with the latest research on successful traders who show that the best, the ones who get consistent results use few types of chart configurations, in several different symbols.
All market watch passing through your chart
Exchange chart makes all the symbol
FREE

This reliable, professional trade copier system is without a doubt one of the best on the market, it is able to copy trades at very fast speeds from one master account (sender) to one or multiple slave accounts (receivers). The system works very fast and mimics the master account a full 100%. So changing stop losses, take profits, pending orders on the master account is executed on the slave accounts too, like each other action. It is a 100% full copy (unlike many other copiers who only copy ma

MT4 Version: https://www.mql5.com/en/market/product/61215
Some users are very comfort 2 able keeping their trades for ages, while other users are happy to get the least and leave :)
If you cannot wait on your trades, then this expert will be the best for you!
The expert tries to enter trades on a high probability of success, and in most cases it do catch the right wave. If not , don't worry because the expert will deal with the situation by itself and will take the trades to profits!

Super Bollinger EA is an exclusive expert advisor that uses Bollinger Bands as indicator. It´s possible to configure the EA to trade as a low frequency or high frequency one - Scalping expert advisor. A Stochastic Oscillator filter is implemented to have some specific trades on Bollinger Bands. Takeprofit and Stoploss are calculated according to Bollinger Bands width or even with fixed TP and SL ( in points ). A trail and trade out system can also be configured and optimized. A number of orders

O Indicador BOPCoiote é uma releitura do indicador Balance of Power proposto por Igor Livshin em Agosto de 2001, publicado na Stocks and Commodities Magazine. Uma média móvel de 14 períodos é recomendada para gráficos diários. Embora o número de períodos possa variar dependendo da natureza do mercado e dos prazos.
O nível em que ele agrupa seus fundos e topos é considerado uma das propriedades mais importantes do indicador BOP.
Durante as tendências de alta, suas máximas frequentemente tocam
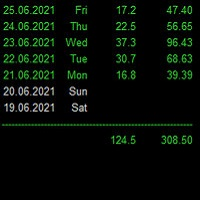
Statistics for each day
Индикатор показывает статистику - итоговую конечную прибыль/убыток по каждому отдельному торговому дню с учетом свопов и комиссий. Параметры : Dey - количество анализируемых дней; Weekday color - цвет будних дней; Weekend color - цвет выходных дней; Loss color - цвет убытка; font_size - размер шрифта; font_face - название шрифта; Для удобства просмотра статистики за большие временные периоды, при инициализации индикатор выгружает данные в Statistics.csv
Созданный файл и
OCTOBER SALE!!! OCTOBER SALE!!! OCTOBER SALE!!!
Heiken Ashi Short Grid is an EA that is using the Heiken Ashi Indicator for the initial trade and uses grid trades when the the trade is on the losing side.
OPTIMIZED SETTINGS ARE AVAILABLE IN THE COMMENT SECTION!!! Optimized Currency Pairs: - AUDCAD - USDCAD - AUDUSD
Parameters: - Initial Volume 1 = 0.01 Lot will not open a martingale system 3 = 0.03 Lot for every $10,000 - Grid Size - Multiplier - Take Profit HEIKEN ASHI SETT

EQUITY DRAWDOWN MONITOR This is a simple mt5 advisor that monitors the drawdon levels Features:
Easy to use Useful for money managers How to Use Load the EA once a single chart Type the maximum drawdown desired in inputs
Leave the EA alone and never close that chart The EA monitors all trades and magic numbers in your account.
Input Parameter Drawdown Percent: Maximum drawdown in percentage terms allowable in the account. When the drawdown level is surpassed, the EA will close all tra

NEW PROMO: Only a few copies copies available at 349$ Next price: 449$ Make sure to check out our " Ultimate EA combo package " in our promo blog ! Gecko runs a simple, yet very effective, proven strategy. It looks for important recent support and resistance levels and will trade the breakouts. This is a "real" trading system, which means it will use a SL to protect the account. It also means it will not use any dangerous techniques like martingale, grid or averaging down. The EA shows its


AW Super Trend - 这是最流行的经典趋势指标之一。它有一个简单的设置,让您不仅可以处理趋势,还可以显示由该指标计算的止损水平。 好处:
仪器: 货币对 、股票、商品、指数、加密货币。 时限:М15 及更高。 交易时间:全天候。 显示当前趋势的方向。 计算止损。 它可以在交易时使用。 三种类型的通知:推送、电子邮件、警报。 MT4 版本 -> 这里 / 新闻 - 这里 能力:
该指标以相应的颜色显示当前趋势方向。
- 蓝色表示当前时间范围内使用的交易品种的上升趋势。
- 该线的红色表示所选交易品种所用时间范围的下降趋势。
该指标可用于设置止损。
指标线不显示在条柱上方,而是相对于条柱有一些偏移。这个显示趋势线的地方可以被交易者用来设置止损。 当趋势发生变化时,指标线会在趋势变化的时刻重新绘制并显示为垂直线。该显示是由于该指标可用于标记止损。 可能会在较小的时间范围内过滤信号,并在较高的时间范围内显示方向。 怎么运行的:
1. 也就是说,如果您在 M15 或 M30 时间范围内工作
2. 在更高的时间框架上运行指标。 H4 或 D1。
FREE

The robo t opens a buy or sell position using the signs.
Know our products
Position openings are based on the parameters identified as signals, if you activate all the robot will issue a trading order only if the number of signals is greater than the minimum stipulated by the user.
The filters are used to increase the accuracy of the signals and if activated and not met your criteria, the order is not sent.
EA also offers MOBILE STOP with the Parabolic SAR indicator and also by dis

趋势使您可以预测价格变动并确定交易结束的主要方向。可以使用适合交易者交易风格的各种方法来构建趋势线。 该指标根据 von Mises 分布计算趋势运动的参数。使用这种分布可以得到趋势方程的稳定值。除了计算趋势之外,还会计算可能的上下偏差水平。 该指标根据当前价格值更新其值。他的行为显示在视频中:
指标参数: iPeriod - 用于计算趋势和水平的柱数 Shift - 继续线向前的柱数 WidthTrend - 趋势线的宽度 WidthLvl1 和 WidthLvl2 - 水平线的宽度 StyleTrend - 趋势线样式 StyleLvl1 和 StyleLvl2 - 水平线样式 ClrTrend - 趋势线颜色 ClrUp - 水平线的颜色 ClrDown - 水平线的颜色

Cryptosecurency - 一种 专门用于交易加密货币的完全自动趋势交易顾问。该顾问在价格波动增加的时刻朝着冲动的方向进入交易。冲动是由两种算法之一确定的:根据一定时间段内价格的百分比变化或基于布林带的内置指标。可以使用 ADX 指 标来衡量趋势的强度。交易使用止损 / 获利来关闭。 不建 议在高点差和佣金的经纪商处使用该顾问。一种使用方法可能是在 MT5 上安装在模 拟账户上 , 并在低佣金的专业加密货币交易所上复制交易。可以设置您的工作时间。 在将 顾问安装到真实账户之前 , 务必检查交易量参数 ! 已 经优化以适用于许多加密货币 , 包括 BTCUSD 、 ETHUSD 等 , BTCUSD H1 的 标准设置。其他参数的预设值已发布在讨论部分。也可以进行优化以适用于其他工具。 优势和特点 适用于任何 规模的存款。 不使用像网格和 马丁格尔这样的高风险策略。 基于存款大小自 动计算交易量的功能。 每次开 仓时 , 止损和获利的大小可以设置为交易工具当前价格的百分比。 可以在开 仓时启用推送通知和警报。 建 议在 H1 时间框架上使用。 输入参数 工作 时间设置 TimeT

指标供需 RSJ PRO 计算并在图表上绘制“供应”和“需求”区域,识别区域类型(弱、强、已验证、已证明),并在区域重新测试的情况下显示它的次数 被重新测试。 “供应”区是出现供大于求的价格区域,导致价格下跌。 “需求”区域是需求大于供应的价格区域,从而推高价格。
区域分类 弱:价格区域,如果重新测试,可能会被违反。 强:价格区域已经改变了趋势方向,不太可能很快被重新测试。 已验证:强价区,最多有1-3次复测,但价格未能突破该区。 证明:强势价格区域,有3次或以上复测,但价格未能突破该区域。 Broken/Turncoat:被打破的价格区域,在支撑的情况下成为阻力,在阻力的情况下成为支撑。 设置 视觉设置: 显示弱区:将显示分类为弱的区域。 显示未测试区域:将显示未测试区域。 Show Broken Zones:显示被破坏的区域 合并区域:指标将非常接近的区域转换为更宽的区域 扩展区域:指标将检查是否有与绘制区域对应的先前限制,并将扩展相同 计算设置: 用于分析的蜡烛数量:指标将用于对区域进行分类的蜡烛数量。 它可以在 500 到 5000 根蜡烛之间。 ATR 周期:用于计算 A

///////////////////////////////////////////////// ///////////////////////////////// 该指标使用多项式回归来相应地绘制三个通道和六条线。 第一个通道及其边界具有大周期,第二个具有平均值,第三个具有小周期。 设置很简单 - 您只需要指定颜色并启用/禁用价格标签的显示。 该指标的读数也很容易理解。 通道线用于设置止损和获利水平。 如果您在策略测试器中没有看到指标读数,请尝试缩小图表窗口。 ////////////////////////////////////////////////// /////////////////////////////////// 我希望该指标对您成功交易非常有用。 祝你好运。
////////////////////////////////////////////////////////////////////////////////////////////////// 这很简单 - 没有设置。 只需要指定箭头的颜色和大小。 该指标的读数也很容易理解。 向上箭头是买入信号,向下箭头是卖出信号。 尝试在策略测试器中对其进行测试 - 你会喜欢的!!! ///////////////////////////////////////////////// /////////////////////////////////////////////////// 我希望该指标对您成功交易非常有用。 祝你好运。
2024 - the return of a legend and a major update and modernization of PriceTracker EA!
PriceTracker EA is specially designed for real trading, taking into account all real market conditions and factors. This is not a test grail where you get profit is only in the strategy tester. PriceTracker EA is a multi-currency, high-yield system with an incredible account trading diversification strategy that shows results in REAL trading, in LIVE Accounts! PriceTracker EA wiil be great work on any rea

Volume is a widely used indicator in technical analysis, however there is a variation that is even more useful than Volume alone: the Moving Average of Volume.
It is nothing more than a moving average applied to the popular Volume indicator.
As the name says, Volume + MA serves to display the transacted volume (purchases and sales executed) of a certain financial asset at a given point of time together with the moving average of that same volume over time.
What is it for? With the Volume
FREE
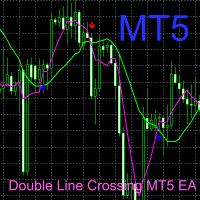
这是基于双均线交叉和箭头标识下单的自定义指标编写的EA。 当出现蓝色箭头向上时做多单。 当出现红色箭头向下时做空单。 当粉红色线向上穿过绿色线交叉时,粉红色线在上方,绿色线在下方,出现金叉,会出现蓝色箭头。 当粉红色线向下穿过绿色线交叉时,粉红色线在下方,绿色线在上方,出现死叉,会出现红箭头。
这是经典的双线交叉金叉死叉很好的实现,并且用箭头标识出下单点,准确率较高,然后编写出来根据线颜色和箭头很好标识下单方向的指标,无时间,货币对限制。 当前EA在同一种货币对只会开一单。 当前EA最好在1小时上工作,效果较好,当然其它时间周期上也是可以工作的,但需要自己去优化参数,获取到最佳工作周期,鱖后更改bigCycle和smallCycle这两个参数。 当前EA默认优化参数在EURUSD 1小时工作周期上效果最佳。 一般100美元挂0.01手,以这样的比例相对安全。 由于外汇交易是24小时运行,手工下单的话容易受到个人时间和情绪的影响,用当前的EA来挂单交易,是个不错的选择。
参数说明: bigCycle:大均线周期 smallCycl

EA has a live track record with many months of stable trading with low drawdown: Best Pairs (default settings) High-risk performance Night Hunter Pro is the advanced scalping system which utilizes smart entry/exit algorithms with sophisticated filtering methods to identify only the safest entry points during calm periods of the market. This system is focused on a long-term stable growth. It is a professional tool developed by me years ago that is constantly updated, incorporating all the late

BEHOLD!!!
One of the best Breakout Indicator of all time is here. Multi Breakout Pattern looks at the preceding candles and timeframes to help you recognize the breakouts in real time.
The In-built function of supply and demand can help you evaluate your take profits and Stop losses
SEE THE SCREENSHOTS TO WITNESS SOME OF THE BEST BREAKOUTS
INPUTS
MaxBarsback: The max bars to look back
Slow length 1: Period lookback
Slow length 2: Period lookback
Slow length 3: Period lookbac
FREE
This new indicator allows you to know the intensity of the movements of a certain period. It is a powerful indicator with which it is easy to identify trend changes. It should be noted that this indicator is new and it is likely that nothing similar exists, it is also only available in MT. A high intensity indicates that during the established period the movement of the price in each bar has been of great amplitude, that is to say, that there is a great difference between the opening and closing
Arielfx Smart Money Imbalance Indicator
What is Imbalance? imbalance noun: Lack of proportion or relation between corresponding thing
We Use Imbalance as a part of our trading system. When an imbalance is filled or price comes into it we often see big reactions and moves from those areas!
How can you use it?
You can take a trade an scalp reactions off of imbalance zones

This indicator displays the spread with extra options Simple and easy to use and fully customisable: View as Pips or Pipettes Chart symbol can be hidden Text display can be changed Change colour and text styles Add or hide a decimal point Spacing options between inputs Default screen positions Screen position inputs
Pro version includes: Drag and drop box on the screen Add an alert when the spread is too high Alert colours for text and text box changeable
How to use 1. Simply use the defaul
FREE

This Expert Advisor is a Combination of Averaging & Martingale.
1. Trend : to define what position the EA should Trade - LONG SHORT ( EA will open both BUY and Sell ) - LONG ONLY ( EA will only open BUY ) - SHORT ONLY ( EA will only open SELL ) 2. Distance between Each Positions - Point value of each Positions 100 : - if 100 Points reached between the last position and current price, new Position will be open by EA - EA will set up a higher volume for this new Position - new TP calculated u

Binance Futures MT5 is a tool for charting and manual trading Bitcoin & Altcoin on Binance Futures Market from MT5 platform. Support all order types: Limit, Market, Stop-Limit, Stop-Market , StopLoss and TakeProfit.
Parameters Symbol = symbol name HistoryData = start time to download history data APIKey = your binance api key SecretKey = your binance secret key Leverage = to set leverage MarginType = to set margin type (crossed or isolated) Po
目前全额购买折扣 中
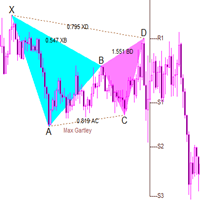
任何交易者的最佳伙伴! 该指标为经典的蝴蝶指标(谐波交易) ,默认可以识别20种形态并进行提示,也可以加入自定义形态的参数进行自定义提示, ,提示合适的止损和获利水平。 该指标内置的算法独一无二,为独门的波段算法 . 指标特性 Gartley形态又称Gartley“222”, 最初由美国形态技术分析的先驱H.M.Gartley在1935年提出的,它发现了4个单独价格段之间的黄金分割关系,目的是指导大家怎样在无序的区间市场里交易。 目前在其基础中发展出非常多的形态, 本指标将其归类并且融合对波段的算法. 基本内容 包含20种价格形态 历史与当前的形态判断 止损和获利水平 电子邮件/声音/警报 基本设置 设置计算的周期。
设置指标波段算法1.灵敏 2.稳定 设置谐波指标计算模式选择 1.默认算法 2.自定义算法 3.两个算法都需要 自定义形态名称,以及XA-B MIN XA-B MAX AB-C MIN AB-C MAX BC-D MIN BC-D MAX XA-D MIN XA-D MAX共8个参数,加上形态名字共计
An indicator of patterns #47 and #48 ("Triangle, ascending" and "Triangle, descending") from Encyclopedia of Chart Patterns by Thomas N. Bulkowski.
Parameters: Alerts - show alert when an arrow appears Push - send a push notification when an arrow appears (requires configuration in the terminal) PeriodBars - indicator period K1 - an additional parameter that influences the accuracy of pattern shape recognition K2 - an additional parameter that influences the accuracy of pattern shape recogn
An indicator of pattern #49 ("Triangle, symmetrical") from Encyclopedia of Chart Patterns by Thomas N. Bulkowski. Parameters: Alerts - show alert when an arrow appears Push - send a push notification when an arrow appears (requires configuration in the terminal) PeriodBars - indicator period K - an additional parameter that influences the accuracy of pattern shape recognition ArrowType - a symbol from 1 to 17
ArrowVShift - vertical shift of arrows in pixels ShowLevels - show lines ColUp - c

Monkey Springs EA is an expert advisor that analysis two moving averages difference (stretch) . It´s possible to trade on trend or reversal. It´s possible to configure each moving average and its difference value - stretch, as soon as a stochastic and OBV filter . Takeprofit and stoploss are configured according to a percent of the moving averages difference. A trail system can also be configured, according to moving averages and stochastic. It´s also possible to configure a average

Sends price alerts conveniently to your Android/IOS device. Make sure push notifications are enabled in Metatrader settings and the PC/VPS is online 24/7. Price levels are updated automatically, but you can modify them in global variables, if needed. Suitable for any market instrument, but if notifications are too frequent, increase point value of the indicator parameter.
FREE

Indicator works with two moving average, when this moving averages cross, then change of colors. You can change the color both moving average and chage all setup if you want, like a native moving average . If you want to put this indicator, all buffers are disponible and their are work fine. In case of doubt or any question don't exitate to write me, I'll read and aswer all the question.

Эксперт торгует по сигналам индикатора SystZ Trend Lines . Входные параметры: Take in atr, 0 - do not use a take profit - размер тейк профита по ATR (50) , рассчитанному на текущем таймфрейме. Если значение параметра равно 0, то не используется; Stop in atr, 0 - do not use a stop - размер стоп лосса. Если значение равно 0, то не используется; Risk factor, volume eq Equty*Risk factor/1000 - используется для расчета размера рабочего лота, который вычисляется как Эквити*Risk factor/1000. Нап
FREE
All words I spent time to describe this EA trading system does not worth a download that you can do to test this expert advisor.
MC Datrix EA is a trading system that combines trend filter, trigger points with specific conditions, smart takeprofit and stoploss calculations, a break orders system based on smart reversal trend.
Trend filter was developed with TRIX indicator and also can be enabled or not.
Trigger points were specially projected with MACD indicators values and signals. Tr

Let the KING trades!!!
KING of TRADES is a trading system that can be optimized according to: - Trend indicator: Ichimoku Kinko Hyo (either in different timeframe) - Trigger system: Fractals - Filter - trade in: Stochastic Oscillator (values and upper and lower limits) - Stops definition: ATR (period and long and short takeprofit and stoploss) - General: magic number, autolot (% balance), symbol digits, max spread and max number of openned orders Default configuration on EURUSD, H1.

" A successful trading means being able to master the art of timing, the art of execution and the art of protecting your capital in a very simple and faster way ". HermanGhost Manager is the most powerful tool that's actually designed to help you win in terms of executing different operations BUY,BUY STOP, BUY LIMIT, SELL,SELL STOP, SELL LIMIT, STOP LOSS, TAKE PROFIT, BREAKEVEN, TRAILING STOPS, all can be executed in seconds.
features : The intuitive interface One time configuration One click
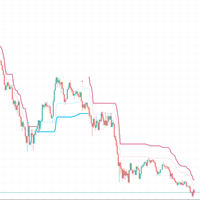
Using ATR to judge the trend, the dotted line is a short-term trend, and the solid line is a stable trend
Set different parameters according to different products. In most cases, please use the default parameters
Time cycle 5 minutes 15 minutes 1 hour
This indicator performs well in monetary products and gold
Index without future function
The entity part of the K line exceeds the entity trend part, which represents the trend conversion. Please wait for the K line to finish

市场真的很喜欢整数,它们通常在下跌的市场中充当支撑,或在价格上涨时充当阻力。 该指标旨在以整数值绘制价格水平。它会自动执行此操作,但您也可以选择覆盖它并确定您希望看到的级别。 一轮水平可以像 10 步一样简单,例如 10、20、30 等,或者如果您从事外汇交易,您可能希望看到 0.1 或 0.01 的变化。 该指标绘制两类线,Major 和 Minor,每类都有不同的格式。这使您可以同时查看两个不同电平变化之间的变化。 警报
该指标包括当价格在可配置距离内时在主要、次要或两个价格水平发出警报的能力。 自动设置 默认情况下,该指标将为主要价格和次要价格确定适当的水平。它使用可配置的 DensityIndex 设置来做到这一点,该设置控制您希望随时在屏幕上看到多少行。 如果您设置自己的缩放比例,使用 MajorGap 和 MinorGap 设置,您仍然可以通过使用 ReduceAtScale 设置来获得限制在屏幕上绘制的线数的指标。 请查看屏幕截图以更清楚地了解此功能。
设置 基本配置 重大差距 当设置为 0.0 时,指标会自动计算出合适的刻度 小间隙 当设置为 0.0 时,指标会自
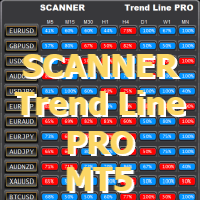
使用趋势线PRO指标并设置由优化器实用程序创建的文件 您可以下载其他程序:这里
扫描仪设计用于接收从M5到MN1的所有对和时间帧上的趋势线PRO指标的新信号
为了使扫描仪工作,您必须有一个指示器。 扫描仪趋势线专业的主要优点是能够使用一个单独的设置文件为每对和时间帧。 您可以在附加扫描仪窗口中自动调整、更改和保存每对的设置。 您还可以使用由特殊趋势线优化器实用程序开发和优化的现成设置文件。 扫描仪允许您仅使用所需的设置,从而加快其工作速度。 扫描仪是手动交易和测试新策略所必需的。 只需在您的计算机或VPS上的任何图表上安装Trend Line PRO SCANNER,它就会通知您一个新的信号,并向您的手机上的移动版Meta Trader发出警告或短信,无论您身在何处。
如何使用扫描仪: https://www.mql5.com/en/blogs/post/749265
1. 在使用之前,加载所需字符的历史记录(按 Ctrl+U) 2. 使用优化器实用程序为您要交易的每对和时间帧优化和保存参数 3. 首先,在图表上安装趋势线PRO指标 4. 之后,将扫描仪添加到
FREE

Aggression Wave PRO 是一个指标,用于监测买卖谈判的侵略量的分歧、强度和连续性。 Agrression Wave PRO 具有允许您查看超过当天累积增量的功能。
注意:该指标不适用于没有攻击类型(买入或卖出)的经纪商和/或市场。加密货币和外汇不提供此类信息,也就是说,它不能与它一起使用。
手术
可以设置音量类型: 真实交易量(在此模式下,每笔资产交易的交易量都会被计算在内) Ticks Volume(在此模式下,将统计资产的交易数量。)
可以定义计算的开始时间: 当前日期 最后一天 LAST_TWODAYS LAST_FOURDAYS 上个星期 上个月 LAST_6MONTHS 去年 LAST_2YEARS ALL_AVAILABLE_DAYS
可以配置信号线: 方法:SMA / EMA / SMMA / LWMA

This scalper helper helps you manage your trader by placing AUTOMATIC stops and takes. When you enter a position and the market quickly turns against you, it's pretty boring isn't it? but with this helper your StopsLoss and TakeProfit will be AUTOMATIC, just configure how many pips you want and that's it. Besides, the helper has AUTOMATIC BreakEven, you just choose the amount of pips you want to place, and finally it contains a stop protector, whenever a candle closes in profit in your favor, it

ScalpJumping July 50% OFF Hey, haven't you tried it yet? What are you waiting for???? Try yoursef. It is a buy scalper robot with a recommended risk of 6%.This is not magic, it works well in a bullish context. you can do a back test yourself and check its operation. It is a multi-currency robot although it was tested with greater success on the EURUSD pair. Recommendations: currency EURUSD, timeframe 5M, Stop Loss 60, Take Proffit 60, Trailing Stop 0, Dynamic Lots true although you can tes

The Donchian Channel Channels are among the most popular tools of technical analysis, as they visually convey to the analyst the limits within which most price movement tends to occur. Channel users know that valuable information can be obtained at any time, whether prices are in the central region of a band or close to one of the border lines.
One of the best known techniques to explore these concepts is Bollinger Bands. However, John Bollinger was not the only one to research the applicatio
FREE

Two Factor Customizer is an fully custimizable Expert Advisor. You can choose multiple parameters that act as a trigger to execute a buy or sell order. Additionally you can choose a previous step (Two Factor), where you can also combine multiple parameters previous to those configured for the buy and sell orders. The parameters available to configure to your liking are: lots, stop loss, take profit, dynamic lots, order type,timeframe. Indicator combinations for triggering orders and for precondi

Convenient drawing of parabolic channels by four points (two lower and two upper extremums). Additional control keys: N (New) - Start drawing a new channel. C (Clear) - Deletes the current channel. By default, the current channel is the last channel. But you can click on the line of any channel to make it current. Click on the gear in the upper right corner to set some parameters for all channels or the current channel. All work is visible from the animated Gif.
Do not forget to express your
FREE

The indicator draws the daily open line. Parameters
GMT shift (minutes) The time zone could be shifted. The value is given in minutes. Draw closest regular bar's open price This parameter could fine-tune the open price line when using GMT shift. Yes - Draw the open line based on the current chart period's closest regular bar No - Draw the open line based on the M1 chart's closest bar. Let's assume that your shift is 10 minutes, and you are using H1 chart and the first candle in every day is
FREE

Delta Aggression Volume PRO is an indicator developed to monitor the strength and continuity of the aggression volume of sell and buy negotiations. Note: This indicator DOES NOT WORK for Brokers and/or Markets WITHOUT the type of aggression (BUY or SELL). Cryptocurrencies and Forex do not provide this type of data, that is, it does not work with them.
O Delta Agrression Volume PRO has features that allow you to view beyond the delta volume of the day.
Operation
Multi symbols (those who pro

Simple indicator used in technical strategies to analyze tops, bottoms and reversal or continuation points. Developer information:
Line values and colors:
Buffer 0 : ZigZag line value;
Buffer 1 : ZigZag color value;
Buffer 2 : Median line value;
Buffer 3 : Median color value; Buffer to get the values of each top and bottom. Buffer 4 : Top value;
Buffer 5 : Bottoms value;
Buffer that returns the type of the last direction.
Buffer 9: 0 = Not updated, 1 = High, -1 = Low;
FREE

Trendy Stock is a price following indicator that uses Stochastic to show when the price is out of the oversold or overbought areas. The algorithm allows you to stay longer in a trend where the bulls or bears are in control. The indicator changes color immediately the price exits oversold/overbought state. In short, the downtrend [red] bars start to paint when the buying pressure decreases while the uptrend [green] bars form as the buy pressure kicks in. For MT4 version, follow :: https://www
FREE

This indicator uses support and resistance, volume and some special formula to calculate the volume to filter the candles. If the volume reaches a specific value, And at the same time, Candle breaks the support/resistance line, There would be a signal and we can enter the market. Signals appear when the current candle closes. then you can enter the trade when a new candle appears. Please don't forget to follow your money management plan.
MT4 Version Support/Resistance Breakout MT4 : https
MetaTrader市场是您可以下载免费模拟自动交易,用历史数据进行测试和优化的唯一商店。
阅读应用程序的概述和其他客户的评论,直接下载程序到您的程序端并且在购买之前测试一个自动交易。只有在MetaTrader市场可以完全免费测试应用程序。
您错过了交易机会:
- 免费交易应用程序
- 8,000+信号可供复制
- 探索金融市场的经济新闻
注册
登录