适用于MetaTrader 5的付费技术指标 - 12
This Renko is: Live : constantly updated on the market prices Dynamic : updating on each new ATR value Backtestable : Generating the chart during backtest, allowing Real Ticks Accuracy and Time Period Accuracy Guppy Built-in : GMMA with 12 EMA built-in This is what you are looking for! RENKO A Renko chart is a type of chart, developed by the Japanese, that is built using price movement rather than both price and standardized time intervals like most charts are. It is thought to be named a

MACD Histogram tracks the difference between the MACD line and the Signal line (which is the exponential moving average of the first line). For better visibility, when plotting the lines and the histogram in the same window, we scale up the histogram by a factor of 2. Furthermore, we use two separate plots for the histogram, which allows us to color-code the bars for upticks and downticks. The MACD Combo overlays MACD lines on MACD Histogram. Putting both plots in the same window enables you to

iVolX indicator horizontal volumes for all time periods
Main settings of the indicator: VolumeSource - select data for volumes (tick or real) PeriodMinutes - selection period for rendering of volumes PeriodsNumber - number of periods to show on the chart StartDate - the start date of the calculations ClusterPoints - cluster width Color - color MaxVolColor - maximum volume color ValueArea - the value of the zone of balance ValueAreaColor - color of the balance zone MaxVolFontSize - font size Ma

The indicator displays the delta and the cumulative delta based on the "Time & Sales" deals list data. In addition to the standard timeframes, the indicator displays data regarding the seconds timeframes (S5, S10, S15, S20, S30) to choose from. Using the rectangle, user can select an arbitrary area in the indicator subwindow to view the ratio of the volumes of deals of buyers and sellers within this area.
Indicator features:
The indicator works correctly only on those trading symbols for whi

" A trading range occurs when a financial instrument trades between constant high and low prices over a period of time. The upper part of the trading range of a financial instrument often provides price resistance, while the lower part of the trading range usually offers price support. Traders can enter in the direction of a breakout or breakdown from a trading range... "
This is the "Classical Theory" understanding of ranges. We have a different understanding of the nature of ranges and th

In the "Masters of Risk" trading system, one of the main concepts is related to places where markets change direction. In fact, this is a change in priority and a violation of the trend structure at the extremes of the market, where supposedly there are or would be stop-losses of "smart" participants who are outside the boundaries of the accumulation of volume. For this reason, we call them "Reversal Patterns" - places with a lot of weight for the start of a new and strong trend.
Some of the im
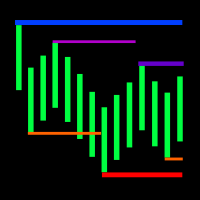
The indicator displays the fractal levels of one, two or three different higher timeframes starting beginning with the current one. When a new fractal appears, a new level is plotted. The indicator can be used for visual analysis of the current chart and applied in an EA. If more levels are needed, start a new instance of the indicator.
Features The indicator works on any timeframe and symbol. If a timeframe smaller than the current one is selected in the settings, the level of the current tim

Uses the built-in news calendar of the MT5 terminal or the Investing.com website (in the latter case, the Get news5 utility is required) Has the Scale parameter={100%, 110%, 125%, ...} to adjust the comfortable size of the text and control elements
Tells you in which direction it is safer to open positions 3 in 1: news + trends + news impact index
news for the selected period: current and in tabular form
actual trends for 5 customizable timeframes and trend reversal levels
forecast of exc

[ MT4 Version ] Order Block Indicator MT5 Order Block Indicator MT5 is currently the most accurate and customizable indicator in the market. It has been developed to facilitate the analysis of operations based on Order Blocks and Supply and Demand Zones. These zones are possible reversal points of a movement. Order Blocks indicate a possible accumulation of orders in one area. The price usually gets to reach and react strongly to those areas. The most relevant levels for this reaction are the c
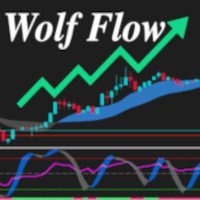
The Wolf Flow Indicator for MetaTrader 5 is the perfect solution for traders looking for instant clarity and precision in their market analysis. Simple to use and immediate to view, this tool offers you a complete overview of market dynamics in a single glance.
Strengths:
Absolute Simplicity: A clean and intuitive interface guarantees effortless use, even for less experienced traders. I mmediate and Rapid: Key data is presented in real time, allowing you to make instant decisions with

FFx Universal Strength Meter PRO is more than a basic strength meter. Instead of limiting the calculation to price, it can be based on any of the 19 integrated strength modes + 9 timeframes. With the FFx USM, you are able to define any period for any combination of timeframes. For example, you can set the dashboard for the last 10 candles for M15-H1-H4… Full flexibility! Very easy to interpret... It gives a great idea about which currency is weak and which is strong, so you can find the best pai

The FFx Watcher PRO is a dashboard displaying on a single chart the current direction of up to 15 standard indicators and up to 21 timeframes. It has 2 different modes: Watcher mode: Multi Indicators User is able to select up to 15 indicators to be displayed User is able to select up to 21 timeframes to be displayed Watcher mode: Multi Pairs User is able to select any number of pairs/symbols User is able to select up to 21 timeframes to be displayed This mode uses one of the standard indicators

Expert Market Edge is scalping, trending, reversal indicator, with alerts . You can use it all and fit with your strategy whatever it fits you. My recommendation is to combine with my Colored RSI , and when 2 signals are matched, and pointing same direction (for example buy on this indicator, and green on RSI, you can take a long position, stop loss should be last local low, if you want to be more conservative, add ATR. ) you can take position. If you using moving averages, that's even better i

!! FLASH SALE !! Over 80% off !! For ONE week only. Now only $47 - normally $297! >>> Ends on 30 June 2023 - Don't miss it!
The Consolidation Breakout Alerts Indicator will revolutionize your trading strategy. Our innovative indicator offers unique buy and sell arrows when price breaks out from consolidation, allowing you to get in at the most optimal entry with minimal risk and maximum reward potential. Never again will you miss out on the lucrative trading opportunities available

The best Vwap Midas coding for Metatrader 5 you can find in White Trader indicators.
The indicator has been optimized not to recalculate (improving performance) and has several visual settings for you to adapt in your own way. TRY IT FOR FREE by clicking the free demo button Where and why to use Vwap Midas (and Auto Zig Vwap Midas) can be used on a variety of indices, currencies, forex, cryptocurrencies, stocks, indices and commodities.
Many successful traders use price and volume to ge

The Inversion Fair Value Gaps (IFVG) indicator is based on the inversion FVG concept by ICT and provides support and resistance zones based on mitigated Fair Value Gaps (FVGs). Image 1
USAGE Once mitigation of an FVG occurs, we detect the zone as an "Inverted FVG". This would now be looked upon for potential support or resistance.
Mitigation occurs when the price closes above or below the FVG area in the opposite direction of its bias. (Image 2)
Inverted Bullish FVGs Turn into P

Introduction
One of the patterns in "RTM" is the "QM" pattern, also known as "Quasimodo". Its name is derived from the appearance of "Hunchback of Notre-Dame" from Victor Hugo's novel. It is a type of "Head and Shoulders" pattern.
Formation Method
Upward Trend
In an upward trend, the left shoulder is formed, and the price creates a new peak higher than the left shoulder peak . After a decline, it manages to break the previous low and move upward again. We expect the pric

"Introducing Dynamic Supply and demand Pro – Your Ultimate Supply and Demand Trading Companion! Unleash the power of precision with this advanced indicator designed for traders seeking unparalleled market insights. Dynamic Supply and demand Pro dynamically identifies key reversal zones, showcasing the delicate dance between supply and demand forces.
This cutting-edge tool provides a comprehensive view of the market, highlighting potential turning points with pinpoint accuracy. Witness the ebb

Bar Strength Divergence Indicator BarStrength Indicator is an exclusive indicator to trade Forex, Stocks, Indices, Futures, Commodities and Cryptos.
BarStrength Indicator shows the strength of each candle.
The indicator shows in a separate windows candles relatively to 2 price levels representing resistance and support in the market.
Once candle is near resistance it is highly probable that price movement will change direction and will go down in the next candles.
Once candle is near sup

The liquidity swings indicator highlights swing areas with existent trading activity. The number of times price revisited a swing area is highlighted by a zone delimiting the swing areas. Additionally, the accumulated volume within swing areas is highlighted by labels on the chart. An option to filter out swing areas with volume/counts not reaching a user-set threshold is also included.
This indicator by its very nature is not real-time and is meant for descriptive analysis alongside other c

The indicator measures and displays the difference in the number of "Bid" and "Ask" prices changes in the form of digital, analog and graphic indicators. Designed for market research and for determine the moments of position closing during scalping trade with H1 or less timeframe. Use with bigger timeframe is not prohibited, but it is not informative because of a large number of accumulated values. Theory
"Bid" and "Ask" prices do not change simultaneously for most symbols. Often you can see h
RSI Traffic Lights Dashboard Trend is you friend, one of the classical Trend following is the Relativ Streng Index (RSI). With RSI Traffic Light Dashboard you get an Overview how the current trend is moving for several Pairs. How many pairs you monitor, can be configured in Indicator settings. The order of symbols is equivalent to your Market Watchlist. The RSI Traffic Light Indicator alerts you if the trend is changing for your pair. Alert can be switched on/off
Important: Get informed about
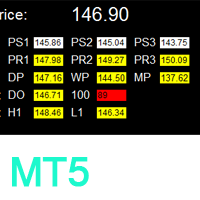
如果产品有任何问题或者您需要在此产品上添加功能,请联系我 Contact/message me if you encounter any issue using the product or need extra feature to add on the base version.
To access the free demo version, please re-direct to this LINK . To access the dashboard version, please re-direct to this LINK . Critical Support and Resistance is an intuitive, and handy graphic tool to help you to monitor and manage critical support and resistance price point easily with one glance to know status of all important S&R. Price is likely
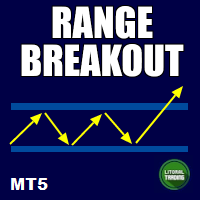
This is an indicator that highlights the price range, specifically in the morning. So it is very easy to identify when these zones are broken, giving you an excellent entry opportunity! Range Breakout works on all symbols and timeframes. It displays past price regions and projects the current one. If you find any bug or have any suggestion, please, contact us. Enjoy!
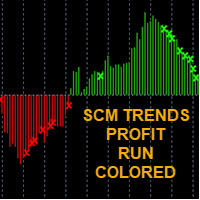
-EASY TO FOLLOW TRENDS -RED SELL / GREEN BUY -CROSS SIGNAL IS MEAN "TRENS WARNING" TO EXIT ORDER (WEAK TRENDS)
-WITH AUDIBLE ALERT ON/OFF
SCM indicator with different colors at levels 0, 100 and -100. The cross is a signal for " Exit" This exit signal is effective especially in short-term breakout trades, because it prevents early exiting at small corrections.

This indicator shows price changes for the same days in the past. This is a predictor that finds bars for the same days in past N years, quarters, months, weeks, or days (N is 10 by default) and shows their relative price changes on the current chart. Number of displayed buffers and historical time series for comparison is limited to 10, but indicator can process more past periods if averaging mode is enabled (ShowAverage is true) - just specify required number in the LookBack parameter. Paramet

This new unique indicator Actual tick footprint (volume chart) is developed for using on Futures markets, and it allows seeing the volume of real deals right when they are performed. The indicator Actual tick footprint (volume chart) represents a greatly enhanced tick chart that includes additional information about the volume of deal performed at a specific price. In addition, this unique indicator for MetaTrader 5 allows to clearly detecting a deal type – buy or sell. Alike the standard tick c

Benefits: A new and innovative way of looking across multiple timeframes and multiple indicators on any chart. Provides instant multi-timeframe analysis of any market. i.e. forex currency pairs, cryptocurrency pairs, commodities, etc. It offers precise indications across multiple timeframes of volatility as measured by RSI, ADX and STOCH within one chart. Helps you determine high probability trading setups. See example strategy in comments. Can see bullish/bearish volatility building across mult

The Chandelier Exit, introduced by Charles LeBeau, is described in "Come into My Trading Room" book.
It calculates each stop on a long position in an uptrend from the highest point reached during that rally, and gets its name from the chandelier, which hangs from the highest point in the room. The Chandelier Exit uses a multiple of the Average True Range (ATR), subtracting it from the highest high since the trade was entered. It creates a new trade whenever the previous trade is stopped out. Ch

One of the key rules in trading is never move your stops in such a way that your risk increases. Our stop sequence shows the automatic tightening of stops. They appear as a series of decreasing risk points until the trade is eventually stopped out.
The problem is that if you enter a trade at any other point than the initial dot of the sequence, you may be placing the stop too close. Stop-entry plots show you the initial value for the stop for each bar. You can use them when you put on a trade,

The Chandelier Exit, introduced by Charles LeBeau, is described in "Come into My Trading Room" book. It calculates each stop on a short position in a downtrend from the lowest point reached during that decline. The Chandelier Exit uses a multiple of the Average True Range (ATR), adding it to the lowest low since the trade was entered. It creates a new trade whenever the previous trade is stopped out. Chandelier Stops differ from traditional stops by having the ability to move against you if the

One of the key rules in trading is never move your stops in such a way that your risk increases. Our stop sequence shows the automatic tightening of stops. They appear as a series of decreasing risk points until the trade is eventually stopped out.
The problem is that if you enter a trade at any other point than the initial dot of the sequence, you may be placing the stop too close. Stop-entry plots show you the initial value for the stop for each bar. You can use them when you put on a trade,

Elder-Ray is made of both Bulls Power and Bears Power as described in "Come into my Trading Room" book. It is tracking the relative power of bulls and bears by measuring how far the high and the low of each bar get away from the average price. Elder-ray is an indicator developed by Dr. Elder and named for its similarity to x-rays. It shows the structure of bullish and bearish power below the surface of the markets. Elder-ray combines a trendfollowing moving average with two oscillators to show w

The purpose of Impulse Release is to prevent trading in the wrong direction. While the Impulse System operates in a single timeframe, Impulse Release is based on two timeframes. It tracks both the longer and the shorter timeframes to find when the Impulse points in the same direction on both. Its color bar flashes several signals: If one timeframe is in a buy mode and the other in a sell mode, the signal is "No Trade Allowed", a black bar. If both are neutral, then any trades are allowed, showi

脉冲系统在“进入我的交易室”一书中首次描述。 它使用 MACD 直方图和价格指数移动平均线 (EMA) 的方向来定义冲量。 规则是永远不要与冲动交易。
它的颜色代码为您提供了几个信号: 当 EMA 和 MACD 直方图都在上升时,脉冲系统将条形颜色标记为绿色(不允许做空)。 当 EMA 和 MACD 直方图都在下降时,Impulse 系统会将条形颜色标记为红色(不允许购买)。 当 EMA 和 MACD 直方图指向不同的方向时,Impulse 系统会将条形颜色标记为青色(您可以做多或做空)。
参数: MACD_Short_Length (12) – MACD 计算的空头 EMA; MACD_Long_Length (26) – 用于 MACD 计算的多头 EMA; MACD_Smoothing_Length (9) – 信号线的平滑值; Short_EMA_Length (13) – 短期价格 EMA。

The MACD XOver indicator was developed by John Bruns to predict the price point at which MACD Histogram will reverse the direction of its slope.
The indicator is plotted one day ahead into the future, allowing, if your strategy depends on MACD Histogram, to predict its reversal point for tomorrow (or the next bar in any timeframe). If the closing price tomorrow is above the value of this indicator, then MACD Histogram will tick up. If the closing price tomorrow is below the value of this indica

The Market Thermometer is described in "Come into my Trading Room" book. It measures the degree of volatility, as reflected in greater or smaller intraday ranges. When the Market Temperature spikes above its average or stays below its average for a number of days, it gives trading signals, as described in the book. Parameters: Thermometer_EMA_Length (22) – The length of the moving average of the Market Temperature. The default 22, the average number of trading days in a month. Spike_Alert_Facto

SafeZone is a method for setting stops on the basis of recent volatility, outside the level of market noise. It is described in "Come into my Trading Room" book. In an uptrend, SafeZone defines noise as that portion of the current bar that extends below the low of the previous bar, going against the prevailing trend. It averages the noise level over a period of time and multiplies it by a trader-selected factor.
For long trades, SafeZone subtracts the average noise level, multiplied by a facto

One of the key rules in trading is never move your stops in such a way that your risk increases. Our stop sequence shows the automatic tightening of stops. They appear as a series of decreasing risk points until the trade is eventually stopped out.
The problem is that if you enter a trade at any other point than the initial dot of the sequence, you may be placing the stop too close. Stop-entry plots show you the initial value for the stop for each bar. You can use them when you put on a trade,

SafeZone is a method for setting stops on the basis of recent volatility, outside the level of market noise. It is described in "Come into my Trading Room" book.
In a downtrend, SafeZone defines noise as the portion of the current bar that extends above the high of the previous bar, against the downtrend. It averages the noise level over a period of time and multiplies it by a trader-selected factor. For short trades, it adds the average noise level, multiplied by a factor, to the latest high

One of the key rules in trading is never move your stops in such a way that your risk increases. Our stop sequence shows the automatic tightening of stops. They appear as a series of decreasing risk points until the trade is eventually stopped out.
The problem is that if you enter a trade at any other point than the initial dot of the sequence, you may be placing the stop too close. Stop-entry plots show you the initial value for the stop for each bar. You can use them when you put on a trade,

The Smoothed ROC indicator, developed by Fred Schutzman, is described in "Trading for a Living" book. It is created by calculating the rate of change for an exponential moving average of closing prices. When it changes direction, it helps identify and confirm trend changes. Parameters Smoothing_EMA_Length (13) – The length of the EMA used for smoothing; ROC_Period (21) – The length of the rate of change calculation.

The Reverse Bar indicator paints the reversal bars according to trade strategy, described by Bill Williams in "Trading Chaos. Maximize Profits with Proven Technical Techniques" book. The bearish reversal bar has red or pink color (red-stronger signal) The bullish reversal bar has blue or light blue color(blue - stronger signal) It is recommended to use it on hourly timeframe (H1) and higher.
这款剥头皮指标为您显示可以安全赚取 10 个点,且风险仅有 2 个点的那一刻。如果使用正确的资金管理,它可以极大地增加您的资产。 此指标只有一个输入参数 - 柱线数量, 用于趋势计算。 当信号出现, 在高于当前价位 2 点的上方放置挂单 (买单) 或低当前价位 2 点的下方放置卖单。 止损 - 2-3 点; 止盈 - 从 10 点起; 建议时间帧 - M1。 品种高波动且低点差 - EURUSD, AUDUSD, GBPUSD, EURJPY 等等。 如果仓位已开, 但价格未到达止盈价, 修改止损到盈亏平衡点, 并依据前一根柱线的最低价设置多单尾随停止, 或前一根柱线的最高位设置空单尾随停止。
FYI :如果您購買此指示器而不是租用它,您可以通過向我們發送您的付款證明來免費索取其源代碼。

This is a trend indicator, as you can see here. When the white line is above the red, it means a bull market. Conversely, the white line below the red line is a bear market. This index is suitable for long - term trading and is suitable for most trading varieties. --------------------------------------------------------------------------------------------

This indicator let user clearly see Buy/Sell signals. When a bar is closed and conditions meet, arrow signal will come up at Close Price, up is Buy and down is Sell. It works on all Timeframes. And you can set sound alert when signals come up.

This indicator is based on a classic Moving Average indicator. Moving averages help us to first define the trend and second, to recognize changes in the trend. Multi TimeFrame indicator MTF-MA shows MA data from the 4 timeframes by your choice. By default this indicator has external parameters: TF1 = 1; TimeFrame2b = true; TF2 = 5; TimeFrame3b = true; TF3 = 15; TimeFrame4b = true; TF4 = 60; InpPSARStep = 0.02; InpPSARMaximum = 0.2; You can change TF1-TF4 in the next limits: TF1 from M1 (1) to H4
This indicator is based on a classic Momentum indicator. Multi TimeFrame indicator MTF-Momentum shows data from the 4 timeframes by your choice. By default this indicator has external parameters: TF1 = 1; TimeFrame2b = true; TF2 = 5; TimeFrame3b = true; TF3 = 15; TimeFrame4b = true; TF4 = 60; InpPeriod = 14; InpappPRICE = 0; You can change TF1-TF4 in the next limits: TF1 from M1 (1) to H4 (240) TF2 from M5 (5) to D1 (1440) TF3 from M15 (15) to W1 (10080) TF4 from M30 (30) to MN1 (43200) All chos

This indicator is based on a classic DeMarker indicator. Multi TimeFrame indicator MTF-DeMarker shows data from the 4 timeframes by your choice. By default this indicator has external parameters: TF1 = 1; TimeFrame2b = true; TF2 = 5; TimeFrame3b = true; TF3 = 15; TimeFrame4b = true; TF4 = 60; InpPeriod = 14; You can change TF1-TF4 in the next limits: TF1 from M1 (1) to H4 (240) TF2 from M5 (5) to D1 (1440) TF3 from M15 (15) to W1 (10080) TF4 from M30 (30) to MN1 (43200) All chosen TFs should be

This indicator shows Pin Bar candlestick pattern on the chart.
The bearish pin bars have red color, the bullish pin bars have blue color. The indicator shows alert when Pin Bar candlestick pattern is formed. It's recommended to use it at timeframes H1 and higher. The best moment (strong signal) is when Pin Bar is formed close to the support/resistance level.
This version of Stochastic evaluates the probability of taking the specified profit in points. The appropriate value is set in the parameters, and the product automatically shows possible options for the market it is currently applied to. There are much more options and the information is more extensive compared to conventional Stochastic (see the screenshots). Signals: The yellow channel is absent (flat movement, market entry is not recommended). The yellow channel is narrowing (trend is formin

Spearman Rank Correlation indicator featuring enhanced entry and reverse signals Any overbought or oversold zone can be adjusted using Cross Buy or Cross Sell levels (Option 1 = true; Cross Buy and Cross Sell are set by user, if Option 1 = false, it means that this option of generating signals is not applicable). The signals can be generated by crossing over the 0 level, this is Option 2. Please note that there are no reverse levels attached to this option. This option is set up as supplementary
Volume-Weighted Moving Average (VW-MA) is a Moving Average weighted by volume. Standard moving averages use prices and simply ignore traded volumes. Volume-Weighted Moving Average indicator responds to this. Note that unlike stock market, Foreign Exchange market is not centralized. Orders and volumes are not shared among brokers. As a consequence, volumes used in Volume-Weighted Moving Average are depending on your broker. However, ECN accounts are the solution. ECN (stands for Electronic Commun

成交量加权 MACD 成交量加权 MACD (VW-MACD) 由 Buff Dormeier 创建,并在他的《使用成交量分析投资》一书中进行了描述。它代表了成交量加权价格趋势的收敛和发散。
包含成交量允许 VW-MACD 通常比传统 MACD 更具响应性和可靠性。
什么是 MACD(移动平均收敛散度)?
移动平均收敛发散由 Gerald Appel 在 1979 年创建。标准 MACD 绘制短期指数平均值和长期指数平均值之间的差异。当差值(MACD 线)为正且上升时,表明价格趋势向上。当 MACD 线为负时,表明价格趋势向下。
计算此差异的平滑指数平均值以形成 MACD 信号线。当MACD线高于MACD信号线时,说明MACD的动能正在上升。同样,当 MACD 低于 MACD 信号线时,MACD 的动能下降。 MACD 线和 MACD 信号线之间的这种差异经常被绘制为直方图,以突出两条线之间的价差。
MACD和大众MACD有什么区别?
成交量加权 MACD 是用两条指数移动平均线来计算 MACD 与两条相应的成交量加权移动平均线的差值。因此,V

这个指标用于比较图表上的交易品种与其他几个所选交易品种之间的强弱相对关系。
根据每个交易品种基于相同基准日的价格走势进行比较,可以看到几条不同走向的趋势线,反映出几个不同交易品种之间的强弱关系,这样可以更清楚地了解市场的趋势。
例如,你可以在EURUSD图表上应用这个指标,将其与货币对EURJPY和EURGBP进行比较,看看哪个更强。
你需要为指标输入参数: 需要比较的几个交易品种的名称 您需要选择比较基准日期。
请注意,使用指标前应确保相关交易品种的历史数据已经下载。
免费模拟版本是: https://www.mql5.com/zh/market/product/63921 .............................................
Tails is an indicator that predicts where the price will rebound and reach in a day candle. This indicator does not repaint and is to be used in time frames below D1. By default, the indicator will plot two support and two resistance lines. If needed, you can set the extended levels to "true" to show three support and three resistance lines. Input Parameters Extended_Levels - show extended levels in the chart; Clr_Support - color for the support lines; Clr_Resistance - color for the resistance

The indicator displays the "Three white soldiers and Three black crows" candlestick model on a chart. Three white soldiers are color in blue. Three black crows are colored in red. Input parameters: Max Bars - maximum number of bars calculated on the chart. Make Signal Alert - use alert. Type of pattern rules - use a strict model of determining the pattern (short lower shadows for the three soldiers, short upper shadows for the three crows), or a simplified model. Max Shadow Ratio - coefficient o
Только что открыли позицию, а цена резко пошла в другую сторону..Что делать? Просто потерпеть, усредниться или отстопиться (закрыться) и снова войти в сделку, но уже в противоположную сторону? Как поступить...а может просто снимать сливки и торговать по разворотным импульсам ….в этом Вам поможет и подскажет Индикатор тенденций и разворотов на базе коллекции паттернов советника ReversMartinTral https://www.mql5.com/ru/market/product/28761
который кроме рекомендаций и сигналов реверса вклю

Появилось желание торговать движение, пробой на самой высокой волатильности, или запустить советника-усреднителя торговать боковик в тихой низковолатильной гавани тогда этот продукт для Вас! Индикатор анализирует 28 валютных пар (основные и кроссы) и в зависимости от выбранных настроек покажет самые высоковолатильные (max) или наоборот (min). Как измерить волатильность? Существует 2 способа. Первый это измерить рендж заданного количества последних баров (bar). Второй замерить

The indicator displays the "Morning star" and "Evening star" patterns on a chart.
The Evening star is displayed in red or rose. The Morning star is displayed in blue or light blue.
Input Parameters: Max Bars – number of bars calculated on the chart. Make Signal Alert – use alerts. Send Push Notification - send notification to a mobile terminal Type of rules pattern – type of the model of pattern determination (Hard – with the control of length of shadows of the second bar). If Soft is select

The indicator displays the dynamics of forming the daily range in the form of a histogram, and the average daily range for a specified period. The indicator is a useful auxiliary tool for intraday trades.
Settings N Day - period for calculation of the daily range value. Level Indefinite - level of indefiniteness. Level Confidence - level of confidence. Level Alert - alert level. When it is crossed, the alert appears.

本指标的主要目的是根据 "混沌交易, 第二版" 和 "新交易维度" 策略,在动量振荡器的直方图里检测并标记交易信号。 本指标检测并标记以下交易信号: "双峰" - 背离。 信号 "第二智者" - 动量振荡器连续三根柱线之后颜色改变。 直方条与零轴交叉。 信号 "飞碟"。 指标包括一个信号块,用来方便地通知交易者任何新信号的形成。 本指标是基于 "混沌交易" 策略的复杂交易系统的一部分。本指标是形态的一部分。建议指标与以下产品配合使用: 混沌交易法 EA 混沌交易图表 新交易维度图表 改编的加速振荡器 识别 1 2 3 形态 波浪制造者 点差和利息监控 虚拟挂单突破做空 (EA 的简化版本) 虚拟挂单突破做多 (EA 的简化版本)

本指标的主要目的是根据 "混沌交易, 第二版" 和 "新交易维度" 的描述,在加速振荡器的直方图里检测并标记交易信号。信号列表: 当指标直方条低于零轴此为做多信号。 当指标直方条低于零轴此为做空信号。 当指标直方条高于零轴此为做空信号。 当指标直方条高于零轴此为做多信号。 当指标直方条与零轴交叉此为做多信号。 指标包括一个信号块,用来方便地通知交易者任何新信号的形成。 本指标是基于 "混沌交易" 和 "新交易维度" 策略的复杂交易系统的一部分。本指标是形态的一部分。建议指标与以下产品配合使用: 混沌交易法 EA 混沌交易图表 新交易维度图表 改编的动量指标 识别 1 2 3 形态 波浪制造者 点差和利息监控 虚拟挂单突破做空 (混沌交易法 EA 的简化版本) 虚拟挂单突破做多 (混沌交易法 EA 的简化版本)
Twiggs 资金流量指数由 Collin Twiggs 创建。 它源自柴金资金流量指数,但使用真实范围而不是高点减去低点,以防止因缺口而出现尖峰。 它还使用平滑指数移动平均线来防止交易量峰值改变结果。 指数移动平均线是 Welles Wilder 为他的许多指标所描述的。
当 Twiggs 资金流量指数高于 0 时,玩家正在积累,因此价格可能会走高。 当 Twiggs 资金流量指数低于 0 时,参与者正在分配,价格更容易走低。
Twiggs 资金流量指数指标与价格的背离也给出了良好的信号。
该指标适用于所有时间范围,不会重绘过去。 有 2 条线:Twiggs 资金流量指数本身和信号线。 这两条线的交叉也会给你信号。 您可以选择您选择的线条样式和颜色。
如有任何问题,请随时与我们联系。
Money Flow Index is a multiple timeframes indicator that displays the Money Flow Index of any timeframe. It helps you to focus on long term money flow before using the money flow of current timeframe. You can add as many Money Flow Index - Multiple timeframes as desired. Refer to the screenshots to see the M30 / H1 / H4 Money Flow Indexes in the same window for example.

FourAverage: A Breakthrough in Trend Identification With evolving information technology and increasing number of market participants, financial markets get less and less analyzable using good old indicators. Common technical analysis tools, such as Moving Average or Stochastic alone, are not capable of identifying the trend direction or reversal. Can a single indicator show the right direction of the future price, without changing its parameters over 14 years' history, while at the same time re

Synthetic Reverse Bar is an evolution of Reverse Bar indicator. It is well-known that candlestick patterns work best at higher timeframes (H1, H4). However, candlesticks at such timeframes may form differently at different brokers due to dissimilarities in the terminal time on the single symbol, while the history of quotes on M1 and M5 remains the same! As a result, successful patterns are often not formed at higher timeframes! Synthetic Reverse Bar solves that problem! The indicator works on M5

TTMM – "Time To Make Money" – Time When Traders Makes Money on the Stock Exchanges The ТТММ trade sessions indicator displays the following information: Trade sessions: American, European, Asian and Pacific. (Note: Sessions are displayed on the previous five days and the current day only. The number of days may change depending on the holidays - they are not displayed in the terminals. The sessions are also not displayed on Saturday and Sunday). The main trading hours of the stock exchanges (tim

ACPD – «Auto Candlestick Patterns Detected» - The indicator for automatic detection of candlestick patterns. The Indicator of Candlestick Patterns ACPD is Capable of: Determining 40 reversal candlestick patterns . Each signal is displayed with an arrow, direction of the arrow indicates the forecast direction of movement of the chart. Each caption of a pattern indicates: its name , the strength of the "S" signal (calculated in percentage terms using an empirical formula) that shows how close is t

AABB - Active Analyzer Bulls and Bears is created to indicate the state to what extent a candlestick is bullish or bearish. The indicator shows good results on EURUSD H4 chart with default settings. The Strategy of the Indicator When the indicator line crosses 80% level upwards, we buy. When the indicator line crosses 20% level downwards, we sell. It is important to buy or sell when a signal candlestick is formed. You should buy or sell on the first signal. It is not recommended to buy more as w
MetaTrader市场提供了一个方便,安全的购买MetaTrader平台应用程序的场所。直接从您的程序端免费下载EA交易和指标的试用版在测试策略中进行测试。
在不同模式下测试应用程序来监视性能和为您想要使用MQL5.community支付系统的产品进行付款。
您错过了交易机会:
- 免费交易应用程序
- 8,000+信号可供复制
- 探索金融市场的经济新闻
注册
登录